

Synopsis: Alkem Laboratories Ltd has formed a double-bottom pattern on its 30-minute chart, signalling a potential near-term bullish reversal.
A double bottom is a “W-shaped” bullish reversal pattern. It signals that a downtrend is losing momentum and a shift toward an uptrend is beginning. The stock achieved a bullish breakout above its key Rs 5,339 resistance zone, driven by strong buying momentum and rising trading volumes.

On June 8th, Alkem Laboratories Ltd broke above its double-bottom resistance neckline, closing strongly at Rs 5,370.50 on the 30-minute chart. Sustaining above this new Rs 5,339 support level confirms near-term bullish momentum and opens the door for further upside. Traders typically target the next resistance level above the neckline to book profits, while watching momentum for a potential continuation or signs of fading.
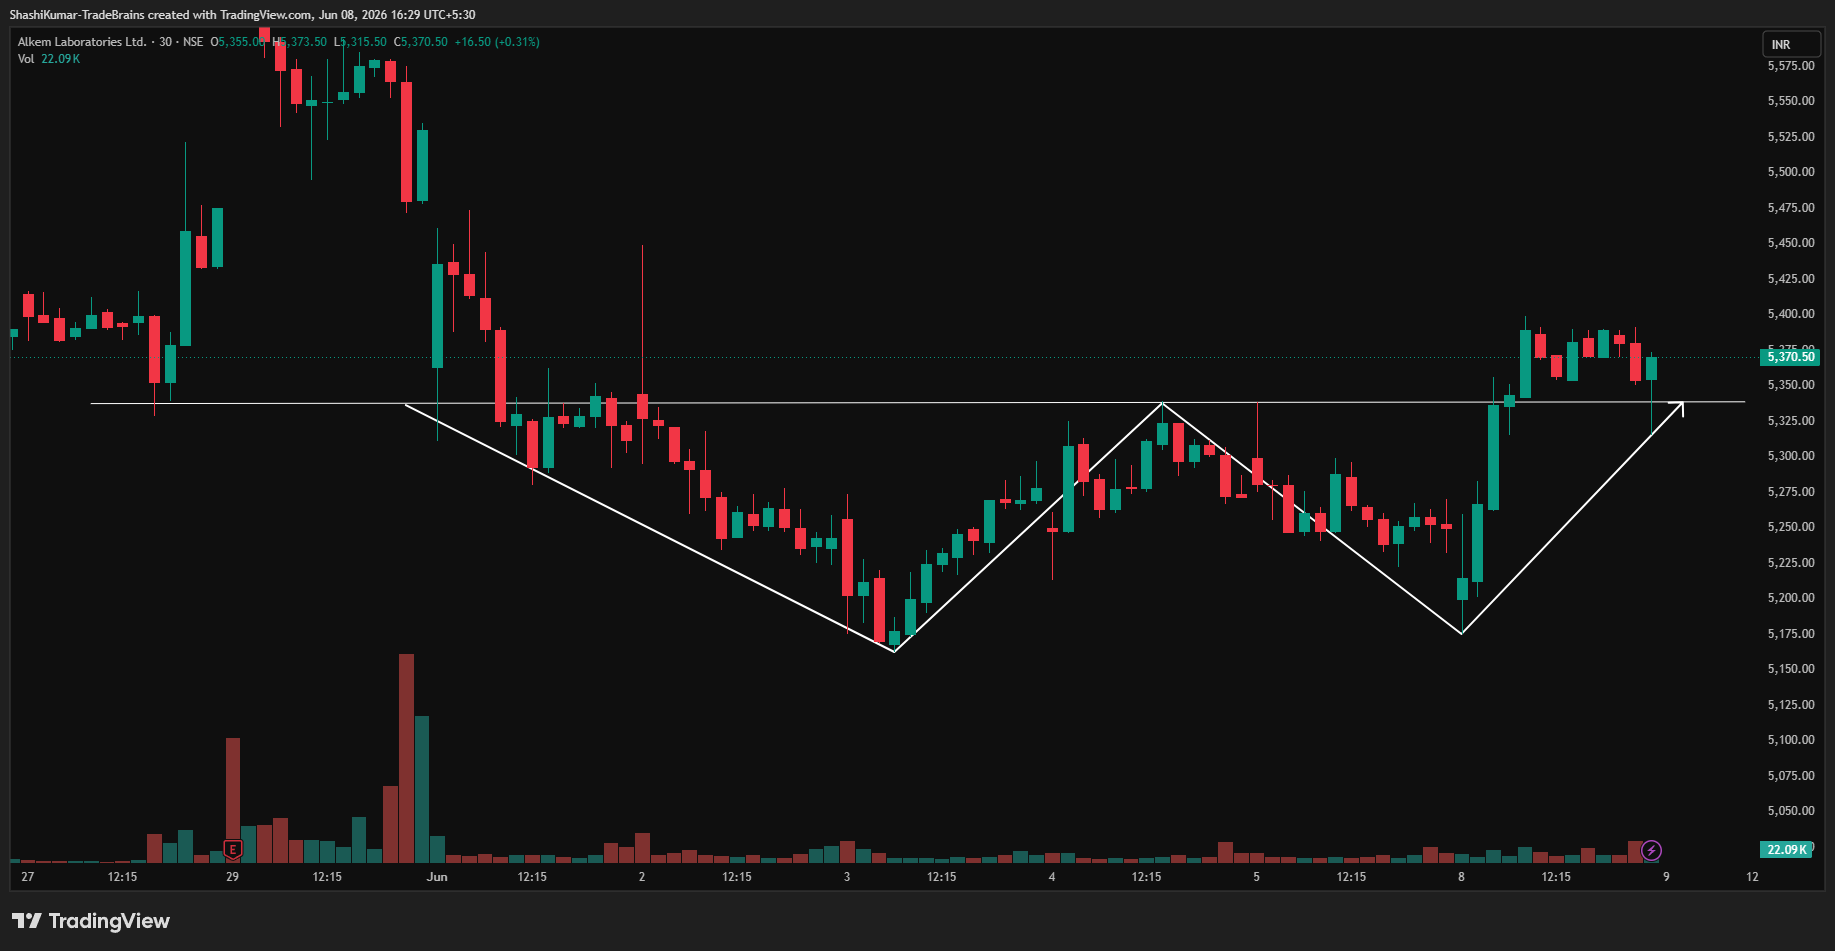
Alkem Laboratories Ltd Chart: 30-min Timeframe
Indicator Confirmation
- RSI: The daily RSI indicates a bullish reversal, as it rose from 40.18 in the previous trading session to 47.42 on Monday.
- Price Volume Trend: The Price Volume Indicator confirms the uptrend, accompanied by a sharp increase in buying volume in the daily time frame.
- On-Balance Volume: The rising OBV and rising price confirmed the trend is a strong, sustainable upward trend driven by high buying pressure in the daily time frame.
Implications
A high-volume close above Rs 5,339 confirms the double-bottom reversal. Sustaining above this level as support validates the near-term upward move and strengthens the bullish outlook.

About the stock
Alkem Laboratories is a 50-year-old leader and India’s sixth-largest pharmaceutical company. It dominates acute therapies like anti-infectives and pain management while rapidly expanding into chronic care, including diabetes and cardiology. Supported by 18 state-of-the-art manufacturing facilities and R&D centres across India and the US, Alkem produces generic formulations, APIs, and biosimilars. The company maintains a strong global footprint, serving patients across India, the US, Australia, Latin America, and Asia.
Over the past month, Alkem Laboratories Ltd saw its stock price decline by 3.85%, extending a six-month downward trend of 4.08%. Despite this recent short-term pressure, the stock is up 10.2% compared to this time last year. For more such technical stock ideas, clickhereto view our research page.

Disclaimer: The views and investment tips expressed by investment experts/broking houses/rating agencies on tradebrains.in are their own, and not that of the website or its management. Investing in equities poses a risk of financial losses. Investors must therefore exercise due caution while investing or trading in stocks. Trade Brains Technologies Private Limited or the author are not liable for any losses caused as a result of the decision based on this article. Please consult your investment advisor before investing.