Many people look at Bitcoin’s price charts or headlines to gauge what’s happening in the market. But there’s much more to Bitcoin’s story than daily price swings. Beneath the surface lies a wealth of data that offers a deeper view of the ecosystem’s health.
That’s where indicators like the Hash Ribbons, MVRV Z-Score, and Stock-to-Flow Model come in. These tools don’t predict price movements or offer trading signals. However, they help explain the underlying forces that shape Bitcoin’s economic landscape.
In this article, we’ll explore three of the most insightful yet often overlooked Bitcoin indicators, breaking down what they are, how they work, and what they can reveal about the network’s long-term trends.
TL;DR
- Bitcoin Hash Ribbons: Show when Bitcoin miners are under stress or recovering, helping analysts understand the network’s health.
- The MVRV Z-Score: Tracks whether Bitcoin is over- or undervalued relative to historical cost basis, providing macro context.
- The Stock-to-Flow (S2F) Model: Measures Bitcoin’s scarcity by comparing its circulating supply to new issuance, offering a long-term view of supply dynamics.
Hash Ribbons Indicator Chart
What It Is
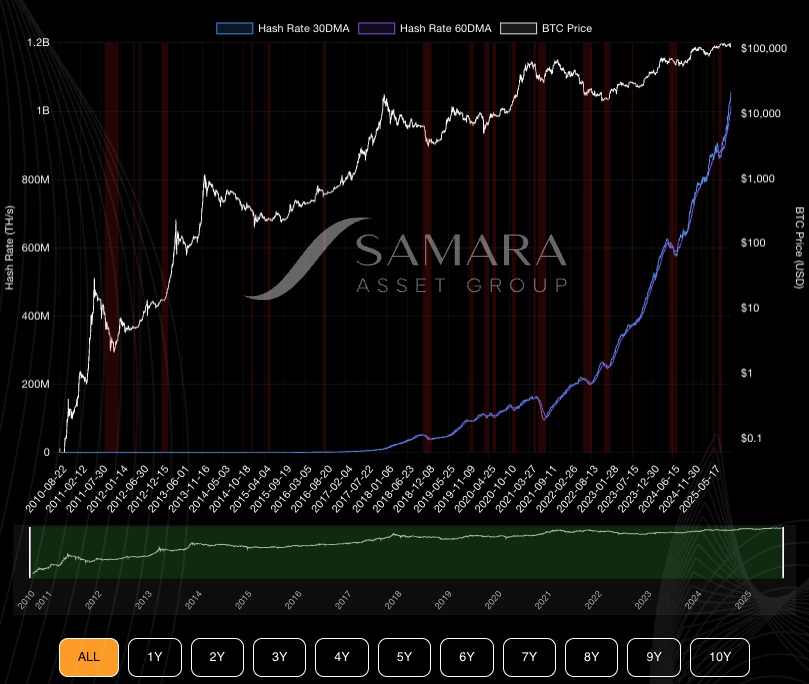
The Hash Ribbons indicator chart is a hash-rate-based network metric that tracks the health of Bitcoin’s mining ecosystem.
It’s based on the 30-day and 60-day moving averages (MAs) of Bitcoin’s total hash rate, the combined computing power miners use to secure the network. When the 30-day MA dips below the 60-day MA, it often signals that miners are shutting down machines due to low profitability, which is a period known as miner capitulation.
When the short-term hash rate recovers and crosses back above the long-term average, it signals that miners are coming back online, marking a return to network strength.
How It Works
- Inputs: Bitcoin’s hash rate data over time.
- Computation: Calculate the 30-day and 60-day moving averages.
- Signal: 30-day MA < 60-day MA → Miner capitulation phase.
30-day MA > 60-day MA → Miner recovery phase.
Some chart versions highlight a “buy” signal when miner recovery begins, not as trading advice, but to show when the worst of the miner stress may be over.
What It Reveals
- The health and confidence of miners, key network participants who secure Bitcoin.
- When selling pressure may be easing, since miners typically sell BTC to cover costs during capitulation.
- Broader market sentiment, since miner recovery often coincides with renewed stability in the network. Historically, these recovery periods have aligned with Bitcoin’s longer-term accumulation phases, but it’s essential to treat the indicator as context, not a prediction.
MVRV Z-Score
What It Is
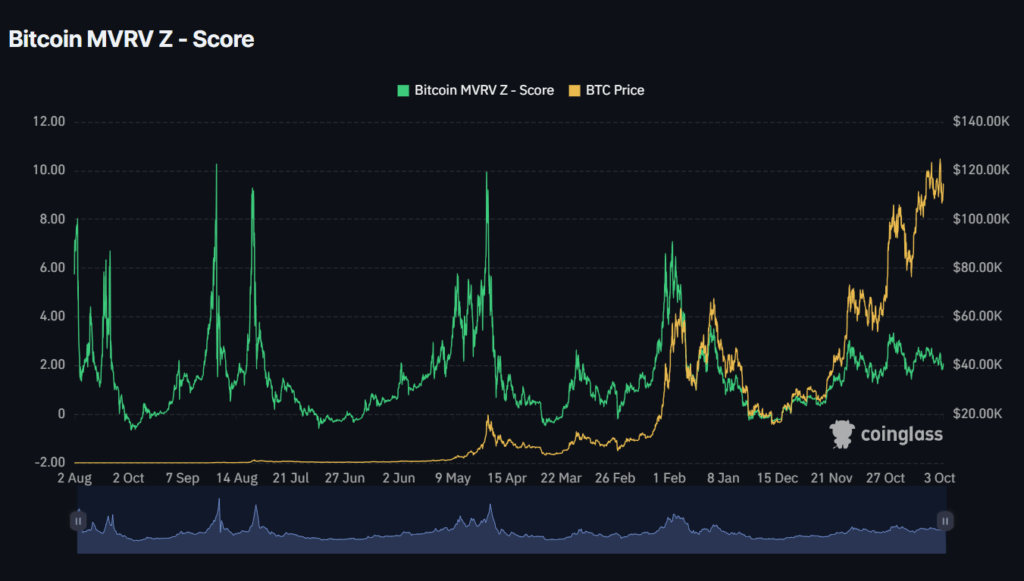
The MVRV Z-Score (Market-Value-to-realized-Value) is a data-driven indicator that compares Bitcoin’s current market capitalization to its realized capitalization, which is a measure of the aggregate value at which all coins last moved on-chain.
In simple terms, it gauges how far current prices deviate from what holders originally paid for their coins. By adjusting for standard deviation, the Z-score highlights when Bitcoin might be statistically over- or undervalued relative to its historical cost basis.
How It Works
- Market value: Current BTC price × circulating supply.
- realized value: Realized value is the sum of each coin’s last on-chain transaction price, valuing every UTXO at its last-moved price.
- Z-Score Formula: (Market Value – Realized Value) ÷ Standard Deviation of (Market Value – Realized Value)
- High MVRV Z-Score: Bitcoin is trading well above average holder cost, which signals a possible overvaluation period.
- Low MVRV Z-Score: Bitcoin is near or below the cost basis, which signals a possible undervaluation zone.
What It Reveals
The MVRV Z-Score helps analysts interpret long-term investor sentiment:
A high Z-score (historically above ~7) suggests exuberant conditions, often near cycle tops, while a low Z-score (close to 0) indicates capitulation or undervalued phases when long-term holders are least profitable.
It reflects how much unrealized profit or loss exists across the network, a strong proxy for market psychology.
Unlike typical price indicators, MVRV is entirely on-chain, offering a transparent window into aggregate investor behavior rather than short-term speculation.
Stock-to-Flow (S2F) Model
What It Is
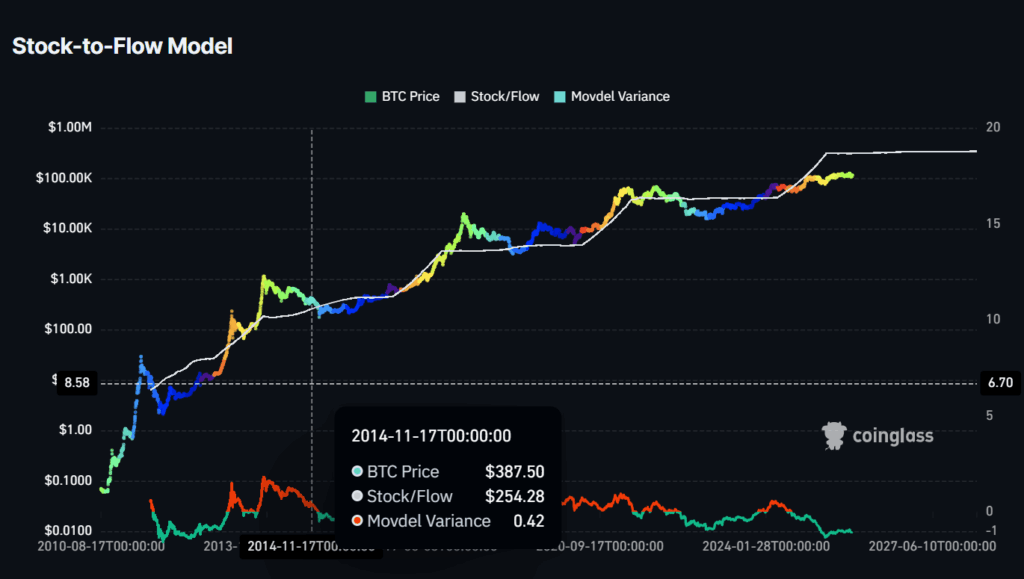
The Stock-to-Flow (S2F) Model is a scarcity-based valuation framework originally used for commodities like gold and silver. It measures the relationship between Bitcoin’s existing supply (stock) and its annual issuance (flow).
Since Bitcoin’s supply is capped at 21 million coins and its issuance rate halves roughly every four years, its stock-to-flow ratio increases predictably over time, suggesting rising scarcity.
How It Works
- Stock: Total circulating BTC supply (≈ 19.7 million).
- Flow: Annual new supply from mining (currently ~164,250 BTC).
- S2F = Stock ÷ Flow. A higher ratio indicates greater scarcity.
Analysts often use regression models to compare historical Bitcoin prices against the S2F ratio, producing a “model price” curve that adjusts upward after each halving event.
What It Reveals
The S2F model offers a macro-level perspective on Bitcoin’s monetary scarcity. It emphasizes Bitcoin’s predictable supply schedule, unlike fiat currencies or mined commodities.
It helps visualize how halvings reduce new issuance, potentially influencing long-term supply-demand dynamics. Analysts use it to frame narratives about Bitcoin as “digital gold,” where scarcity drives long-term value preservation.
However, the S2F model isn’t universally accepted; critics argue it oversimplifies demand and macroeconomic variables. Still, it remains one of the most recognized frameworks for understanding Bitcoin’s economic structure.
Conclusion
The Hash Ribbons Indicator, MVRV Z-Score, and Stock-to-Flow Model don’t predict short-term price moves, but they do offer valuable context for Bitcoin’s underlying fundamentals.
Used together, they provide a multi-layered picture of the Bitcoin network’s health, psychology, and economic framework, helping observers look beyond daily volatility and focus on what really drives this unique digital asset.
Disclaimer: This article is for informational purposes only. It does not constitute financial advice. Always conduct your own research before investing in digital assets.