Candlestick analysis is one of the oldest and most widely used methods in technical trading, applied across forex, equities, and crypto trading markets alike. Traders who can read candlestick formations accurately gain a measurable advantage in identifying potential reversals and continuation setups before they fully develop. The ability to recognize these patterns on a live chart, however, requires systematic study rather than casual observation.
WR Trading has compiled its Candlestick Patterns PDF, also referred to as the Candlestick Bible, as a free, downloadable reference guide covering the full spectrum of single, double, and multi-candle formations. The document is structured to serve both beginners building pattern recognition skills and experienced traders who want a reliable quick-reference tool during active trading sessions.
Traders who download the candlestick patterns PDF by WR Trading gain access to annotated pattern diagrams, approximate win rate data, and step-by-step trade setup instructions for each formation. This is much more detailed than most of the free chart guides available, and so it is a useful working document, not a general introduction.
What the WR Trading Candlestick PDF Contains
Pattern type and complexity are used to arrange the PDF so traders can learn about a particular formation without having to read irrelevant information. Every listing is structured in a similar way that addresses pattern building, market setting, and rules of trade execution.
Single-Candle Patterns
Single-candle formations such as the doji, shooting star, and hammer are among the first patterns covered in the document. Each is presented with construction criteria, the market conditions in which it carries the most significance, and confirmation rules that reduce false signal risk. The shooting star, for example, is documented as requiring a small body, a long upper wick, and placement at resistance for maximum reliability.
Two-Candle and Three-Candle Reversal Patterns
The PDF dedicates substantial coverage to multi-candle reversal setups, including the bearish engulfing, bearish harami, tweezer top and bottom, and the three white soldiers. Each formation includes approximate historical win rate data.
Patterns such as the bearish harami, which signals weakening bullish momentum, are described with win rate ranges of 53 to 63%. This data-driven framing helps traders calibrate expectations realistically rather than treating every pattern as a high-probability signal regardless of context.
Continuation Patterns
The document also covers continuation formations, including the rising three methods, mat hold, and three outside up and down patterns. These are important for traders who want to identify when a trend is likely to resume after a short consolidation, as opposed to reversing. Including continuation patterns alongside reversal formations gives traders a complete toolkit for reading directional intent in price action.
The table below gives a general overview of how pattern categories in the PDF are organized by type and typical application:
| Pattern Category | Number of Candles | Primary Signal | Typical Application |
| Single-candle | 1 | Potential reversal or indecision | Entry confirmation at key levels |
| Two-candle reversal | 2 | Momentum shift signal | Reversal trades at support or resistance |
| Three-candle reversal | 3 | Confirmed directional change | Higher-confidence reversal entries |
| Continuation | 3 or more | Trend resumption after pause | Re-entry or trend-following trades |
How to Study the PDF Effectively

Reading the PDF once is not sufficient to build reliable pattern recognition. The document is designed for repeated use, with each section revisited as traders encounter specific formations in live or simulated charts. Structured study produces faster skill development than passive reading.
Step 1: Learn Pattern Construction Rules First
Each pattern in the PDF is defined by specific construction criteria that must all be present for the formation to qualify as a valid signal. The bearish engulfing, for instance, requires the second candle to open above the prior close and close below the prior open, fully engulfing the first candle’s body. Internalizing these rules is the necessary first step before attempting to identify any formation on a live chart.
Although AI tools become more widely used for pattern scanning, manual recognition skills remain a foundational requirement for interpreting and acting on those signals effectively. Automated screeners can flag potential patterns, but the final judgment on whether a setup is valid within its broader context still relies on the trader’s own analytical skill.
Step 2: Match Patterns to Market Structure
The PDF explicitly states that pattern context determines reliability. A bearish engulfing candle at a well-tested resistance level carries substantially more predictive weight than the same formation appearing mid-range with no structural significance. Traders should practice identifying key support and resistance levels on a chart before overlaying pattern analysis on top of that structure.
Step 3: Apply Confirmation Rules Before Entering
Every pattern in the WR Trading PDF includes a confirmation requirement, typically the close of an additional candle in the expected direction. This step exists to reduce false entries caused by patterns that appear valid in isolation but fail to follow through. In fast-moving markets, waiting for confirmation adds a meaningful filter to overall signal quality.
Traders who apply the PDF’s confirmation framework across their studies consistently report fewer false entries. The core confirmation criteria the document applies to most reversal setups are:
- A follow-through candle closing in the expected direction after the pattern’s final candle has closed.
- Pattern formation at a structurally significant level, such as a tested support zone, resistance level, or prior swing high or low.
- Volume behavior that supports the directional signal, particularly elevated volume on the signal candle relative to surrounding bars.
- Absence of conflicting signals from higher-timeframe trend direction or major upcoming news events that could override the setup.
Applying PDF Patterns to Live and Simulated Trading
Pattern recognition becomes a tradable skill only when it is applied under real or simulated market conditions with actual price behavior. Reading the PDF and studying static diagrams builds foundational knowledge, but transferring that knowledge to a live chart requires structured practice with real-time data.
Using the WR Trading Simulator for Pattern Practice
WR Trading’s free browser-based simulator provides a direct environment for testing PDF patterns without financial risk. Traders can load live EUR/USD or S&P 500 charts, apply the pattern criteria from the PDF, and execute simulated trades to observe how well each formation performs under current market conditions. The simulator runs on real-time price feeds with variable spreads starting from 0.2 pips, which accurately reflects live execution conditions.
Combining PDF Patterns With the Strategy
WR Trading’s strategy is built on wick-based analysis of M1 charts, which means it shares a foundational language with many of the reversal patterns documented in the PDF. Traders enrolled in the WR Trading Mentorship program use the PDF as a supplementary reference that reinforces the wick-reading methodology taught throughout the course. This integration makes the PDF directly relevant to the practical curriculum rather than a standalone document.
Mentorship students apply PDF patterns within a specific workflow that connects theoretical knowledge to executable trades across three practical steps:
- Chart marking: Identifying key support and resistance zones on higher timeframes before switching to the M1 chart to look for reversal formations.
- Pattern validation: Applying the construction criteria from the PDF to confirm that a forming candle structure meets all requirements for the target pattern.
- Trade execution: Entering the simulated or live position at the close of the confirmation candle with a stop placed below the pattern’s low for bullish setups or above its high for bearish ones.
WR Trading’s PDF as Part of a Broader Educational Framework
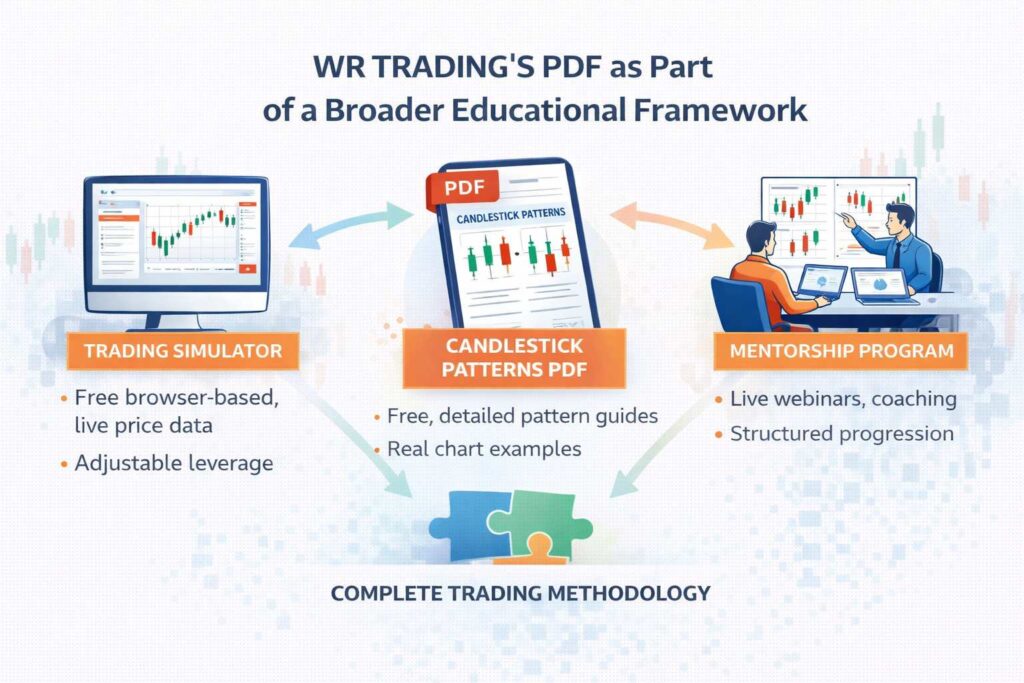
The Candlestick Patterns PDF represents one component of WR Trading’s broader commitment to free, practical trader education. Alongside the PDF, WR Trading provides a range of resources that collectively support the development of a complete trading methodology:
- Free browser-based trading simulator with live price data, adjustable leverage, and no registration requirement.
- Detailed educational articles covering individual candlestick patterns with real chart examples, indicator combinations, and trade execution guidance.
- WR Trading Mentorship program that integrates pattern analysis with live webinars, personalized coaching, and a structured three-phase progression system.
Each of these resources reinforces the others. The PDF builds foundational pattern knowledge, the simulator provides a practice environment to test it, and the mentorship program integrates both into a structured, coached development path. This coherence across resources is a defining characteristic of WR Trading’s brand as a practical, education-first trading platform.
Traders who treat the PDF as a starting point for systematic study rather than a shortcut to profitable trades will find it genuinely useful. The document is available at no cost at wrtrading.com, and no account is required to download it.
