Synopsis: This article explains crypto candlestick charts, their purpose, how to interpret them, and the technical indicators traders use to analyze price movements and make informed trading decisions.
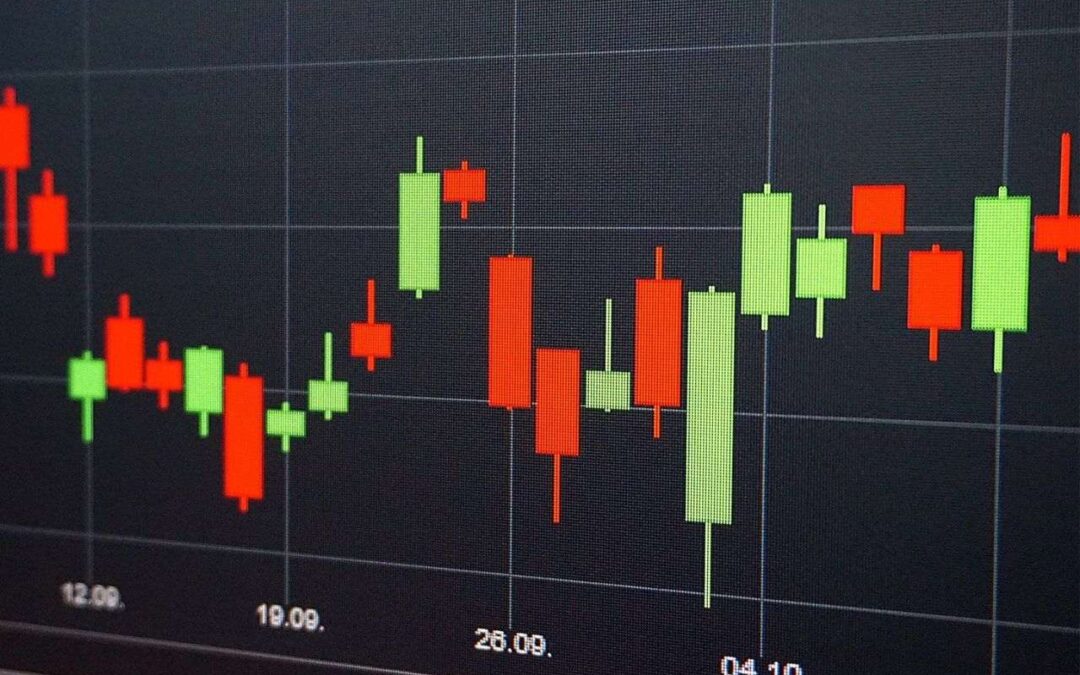
A candlestick chart is a financial visualization tool that displays an asset’s price movement over a specific time period. It graphically represents four key price points: the opening price, closing price, highest price (high), and lowest price (low) within each time interval.

What Is a Crypto Candlestick Chart?
A crypto candlestick chart applies this same visualization method to digital assets like Bitcoin, Ethereum, and other cryptocurrencies. Each candlestick displays:
- Opening price – where the price started during the time period
- Closing price – where the price ended during the time period
- Highest price – the peak price reached during the period
- Lowest price – the minimum price reached during the period
The chart’s vertical axis represents price levels, while the horizontal axis represents time intervals, which can be set to minutes, hours, days, or longer periods depending on the trader’s needs.
Why Are Candlestick Charts Important?
Candlestick charts serve several critical functions for cryptocurrency traders:
- Trend identification – They help identify overall market direction and momentum
- Entry and exit signals – They reveal optimal points to enter or exit positions
- Pattern recognition – They confirm market movements through recognizable patterns
- Volatility assessment – They adapt well to the highly volatile nature of cryptocurrency markets
How to Read Candlesticks in Crypto Trading
Each candlestick represents a specific time period (such as 5 minutes, 1 hour, or 1 day). The rectangular portion, called the “real body,” shows the range between the opening and closing prices during that interval.

- Long body – indicates high volatility and significant price movement
- Short body – indicates low volatility and minimal price change
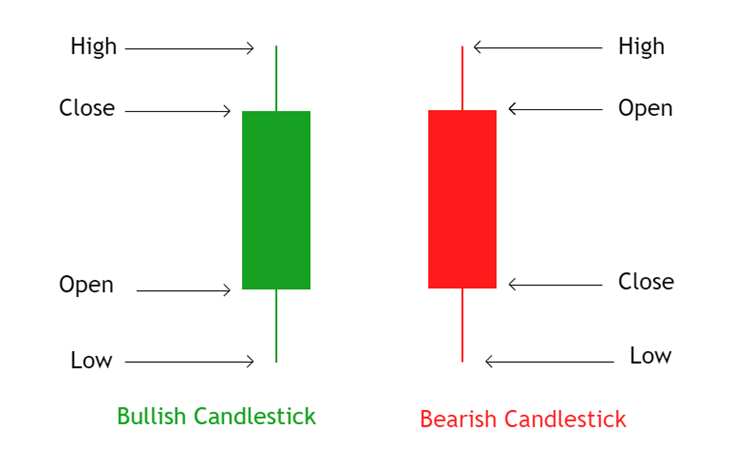
Color-Coded Price Movement
- Candlesticks use color to quickly convey price direction:
- Green (or white) candlesticks indicate a price increase:
- Opening price is at the bottom of the body
- Closing price is at the top of the body
- Represents a bullish (upward) trend
Red (or black) candlesticks indicate a price decrease:
- Opening price is at the top of the body
- Closing price is at the bottom of the body
- Represents a bearish (downward) trend
Wicks and Tails: Highest and Lowest Prices
The thin lines extending above and below the candlestick body are called “wicks” or “shadows.” These represent price extremes that occurred during the time period:
- Upper wick – shows the highest price reached above the opening/closing range
- Lower wick – shows the lowest price reached below the opening/closing range
These wicks reveal the full price range and can indicate rejection of higher or lower prices by the market.
Technical Indicators for Crypto Candlestick Charts
Relative Strength Index (RSI)
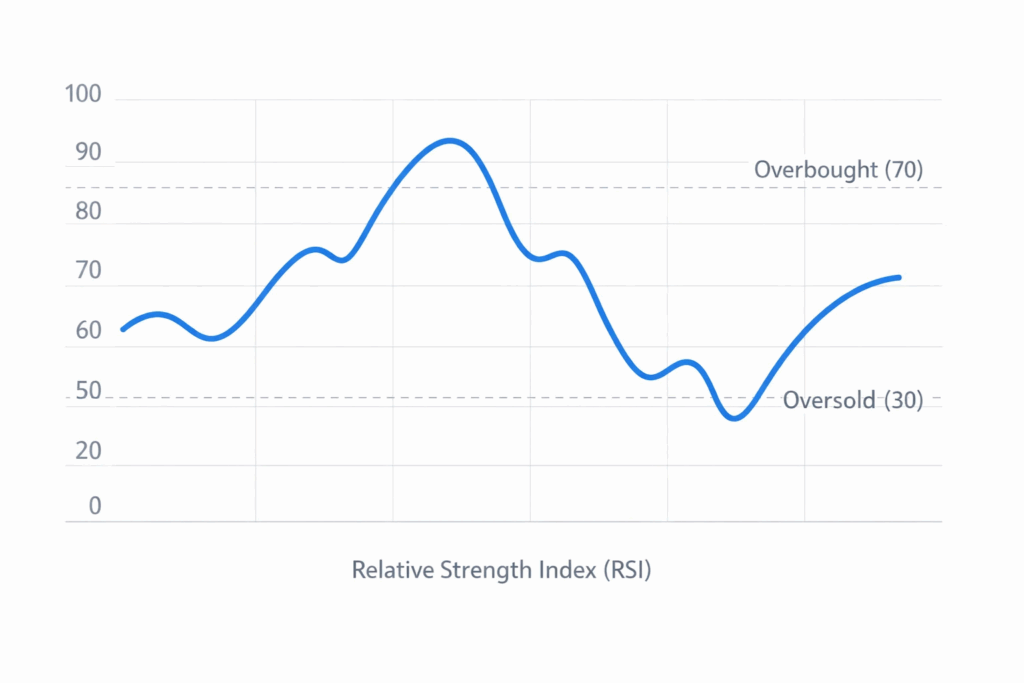
The RSI measures the speed and magnitude of recent price changes on a scale from 0 to 100. This momentum oscillator helps traders identify:
- Overbought conditions – typically when RSI exceeds 70, suggesting a potential price correction
- Oversold conditions – typically when RSI falls below 30, suggesting a potential price bounce
Moving Averages (MA)
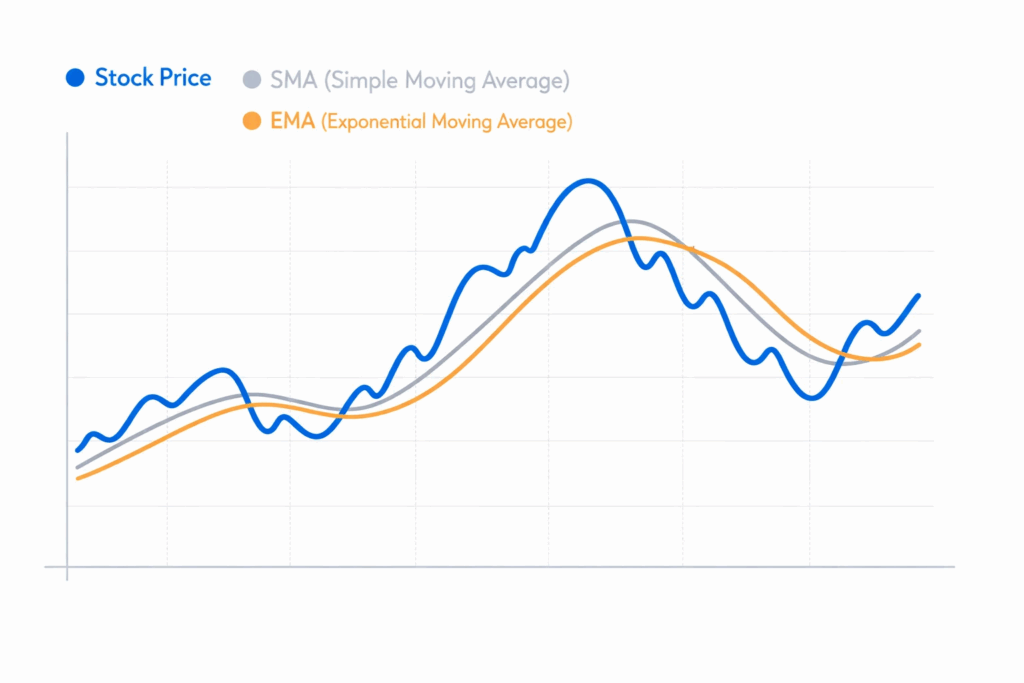
Moving averages smooth out price fluctuations to help traders identify trends more clearly. There are two primary types:
Simple Moving Average (SMA):
- Calculates the average price of an asset over a specified number of periods
- Gives equal weight to all prices in the period
Exponential Moving Average (EMA):
- Places greater weight on recent prices
- More responsive to new price movements and trends
- Particularly useful in volatile cryptocurrency markets
Also Read: TDS on Crypto Trading: What Indian Traders Must Know
Bollinger Bands
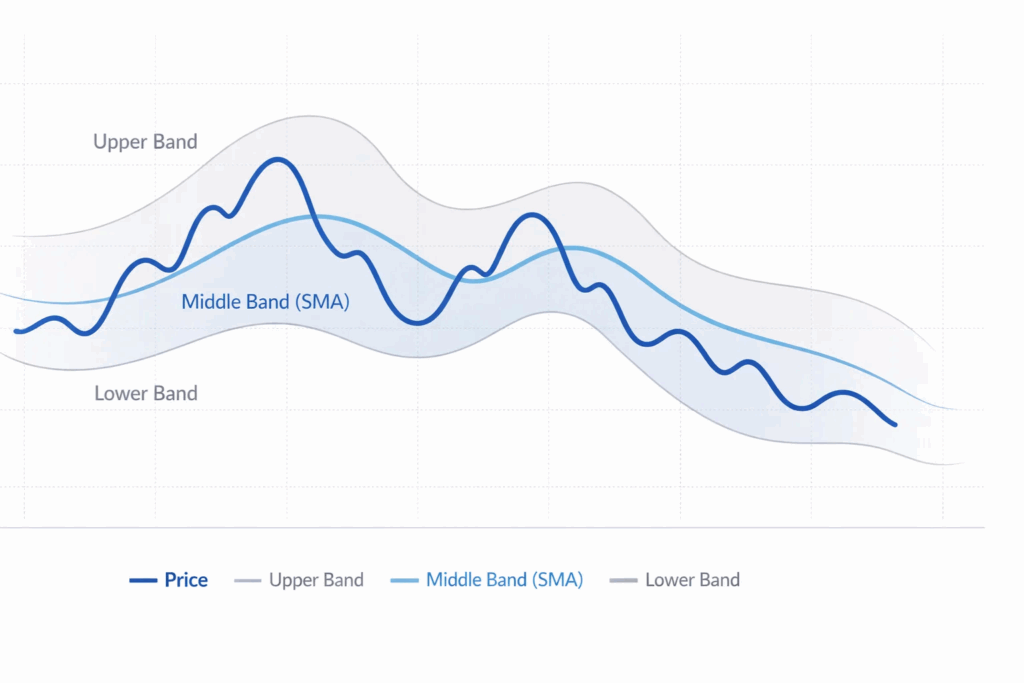
Bollinger Bands consist of three lines:
- A middle line (typically a 20-period moving average)
- An upper band (two standard deviations above the moving average)
- A lower band (two standard deviations below the moving average)
Interpretation:
- When prices move near or beyond the bands, it indicates high volatility
- Prices touching the upper band suggest the asset may be overbought
- Prices touching the lower band suggest the asset may be oversold
- Band width expansion indicates increasing volatility; contraction suggests decreasing volatility
Moving Average Convergence Divergence (MACD)
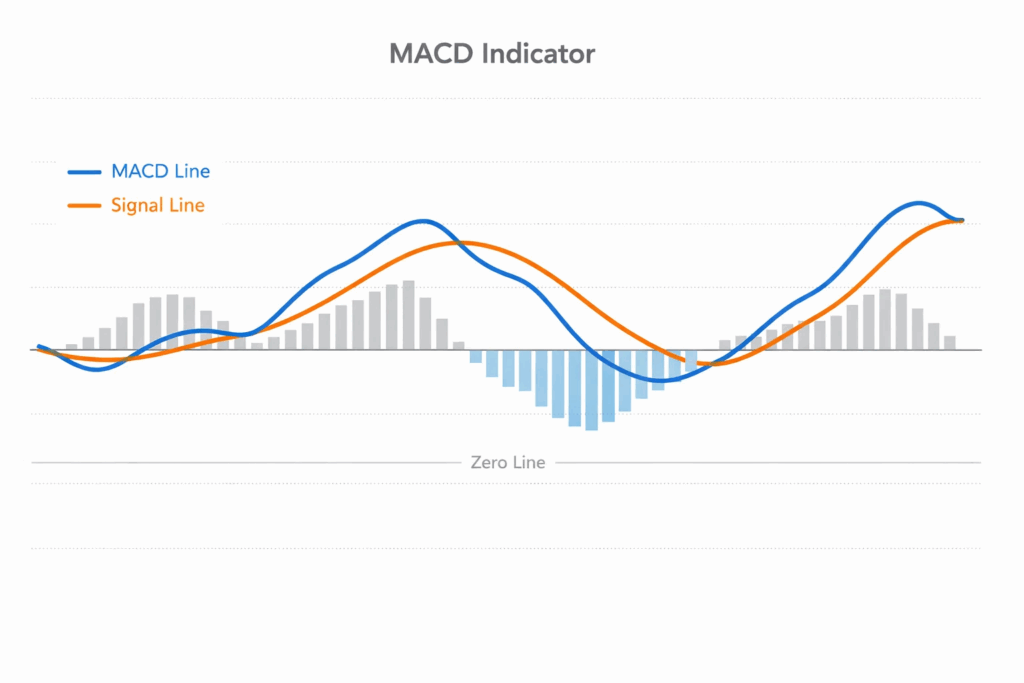
The MACD is a momentum indicator that shows the relationship between two exponential moving averages:
- The MACD line (difference between the 12-day EMA and 26-day EMA)
- The signal line (typically a 9-day EMA of the MACD line)
Interpretation:
- Positive MACD – indicates upward momentum (bullish)
- Negative MACD – indicates downward momentum (bearish)
- Bullish crossover – when the MACD line crosses above the signal line, it may signal a buying opportunity
- Bearish crossover – when the MACD line crosses below the signal line, it may signal a selling opportunity
Understanding crypto candlestick charts is fundamental to technical analysis in cryptocurrency trading. By learning to read candlestick patterns and combining them with technical indicators like RSI, moving averages, Bollinger Bands, and MACD, traders can make more informed decisions about market entry and exit points.
While these tools provide valuable insights, remember that no indicator guarantees success always combine technical analysis with proper risk management and continued learning.
Written by Parvati Anilkumar
