Synopsis: Residential real estate in India is currently witnessing a national weighted average price crossing ₹10,000 per sq. ft. in Q1 FY2026, historically for the first time. All the 8 major cities are showing a positive year-on-year price appreciation, ranging from 3.4% to 24.2%. This article examines all the 8 cities’ price appreciation YoY in Q1 FY26, exploring the demand drivers, market dynamics, and the meaning of these numbers for buyers, investors and developers.
India’s property market has finally entered a mature and demand-dependent growth cycle after years of post-pandemic. The first quarter of 2026 defined a significant sustained broad based price appreciation when supply grew by 1.1% QoQ and sales edged up by 1.0%. Every single one of India’s top eight residential markets showed a positive YoY price growth, as the underlying demand continues to absorb supply even when the prices are elevated.
1. Bengaluru

Bengaluru has the highest YoY residential price appreciation in Q1 2026 with 24.2%, from ₹7,881 per sq. ft. in Q1 2025 to ₹9,785 per sq. ft. This is a gain of ₹1,900 per sq. ft. The sales rose at the rate of 33% YoY and 12% QoQ, with a 3% sequential rise from ₹9,500 per sq. ft in a single year. This is the consequence of the growing capability of Global Capability Centre (GCC), the startup employment ecosystem and the conventional IT environment which generates a consistent housing demand in the city.
2. Mumbai (MMR)
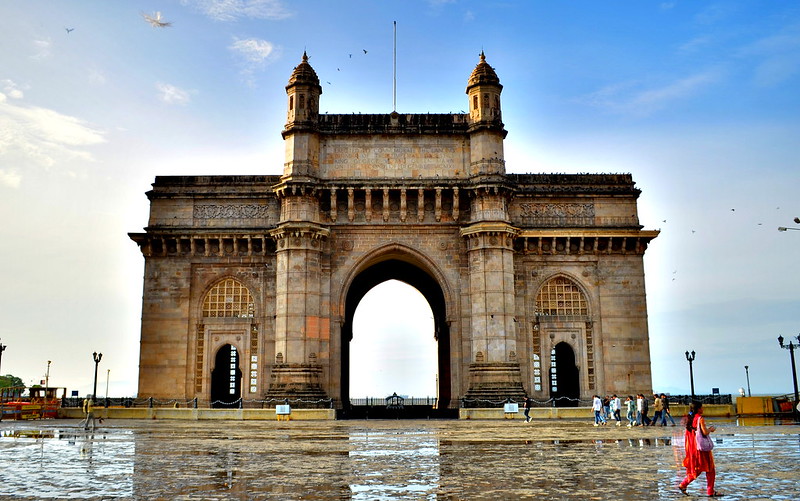
The most expensive real estate market in the country, Mumbai Metropolitan Region (MMR) recorded an annual price appreciation of 20% following the surge from ₹12,600 per sq. ft. in Q1 2025 to ₹15,120 per sq. ft. in Q1 2026. The QoQ price appreciation was seen as 8%. The new supply of all launches in Q1 2026 is 29.2% from all the 8 cities combined. This price appreciation is driven by the volume of supply and the value appreciation of the residential real estate in the city.
3. Delhi NCR

The capital of the country has seen a price appreciation of 17.6% from ₹8,106 per sq. ft. in Q1 2025 to ₹9,534 per sq. ft. in Q1 2026. The sales are growing by 11.4% YoY and 2.4% QoQ. The new supply of the projects rose at 28.6% YoY. The key factors behind this rise is the demand for luxury segments, because of the high income and aspirational buyers in the city. This also confirms that the price and the volume of the real estate are moving in the same direction with respect to the residential real estate demand of this city.
4. Pune
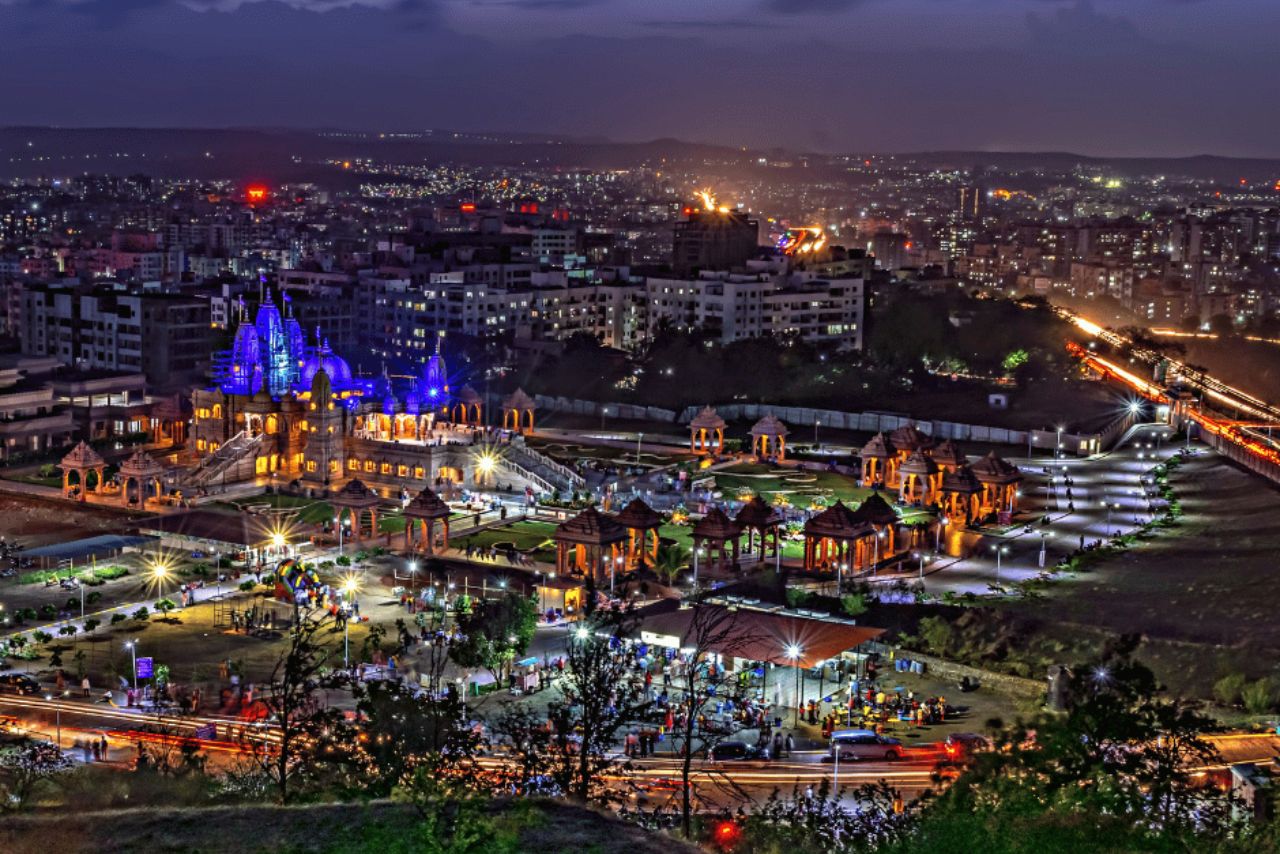
The city with the manufacturing hubs, the growing automotive power and the IT infrastructure has an annual price appreciation of 11.9% from ₹7,109 per sq. ft. in Q1 2025 to ₹7,957 per sq. ft. in Q1 2026, with a highest QoQ price appreciation of 9% among all the mentioned 8 cities. As the city is still growing and developing in infrastructure it will be interesting to note that the price appreciation will be welcomed by the mid-income segment buyers further in the year, as the affordability pressure will be sustained or the demand will grow despite this price appreciation.
Also Read: KWIN City Impact: Why North Bengaluru Could Become Karnataka’s Biggest Investment Corridor
5. Hyderabad
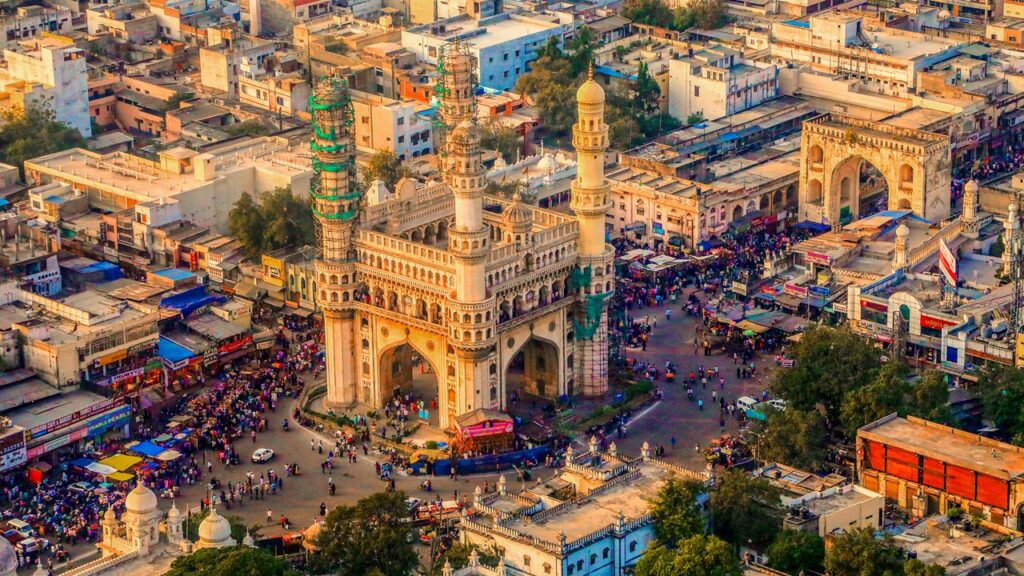
Hyderabad property prices rose from ₹7,412 per sq. ft. in Q1 2025 to ₹8,240 per sq. ft. Q1 2026 which is a gain of 11.2% annually. The QoQ price appreciation is 3%, and the sales growth in the city is 24.9% YoY which is recorded as the second highest in the country. These numbers mirror the growing IT, pharma, and data centers potentially rising demands.
6. Ahmedabad
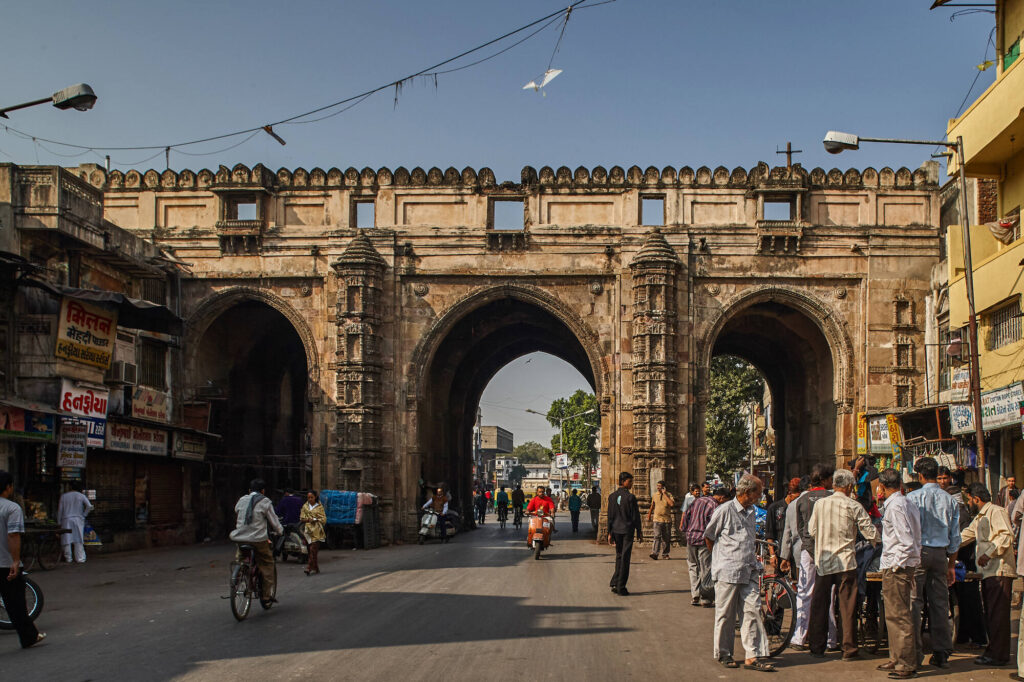
The most affordable real estate market among all the 8 cities is Ahmedabad. The annual price appreciation of this city is 8.3% from ₹4,568 per sq. ft. in Q1 2025 to ₹4,949 per sq. ft. in Q1 2026. The QoQ price appreciation was seen as 1%. The new supply grew by 95.6% YoY. The city’s affordability sustains the demand for the residential property, further becoming responsible for the price appreciation.
7. Kolkata
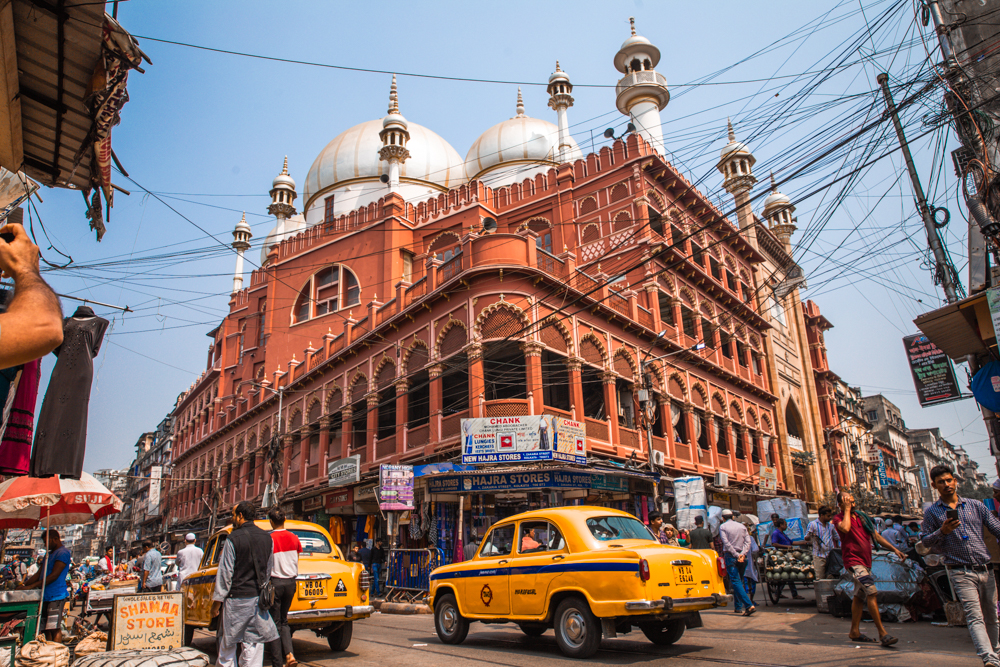
The price appreciation was seen as 6.6% from ₹5,839 per sq. ft. in Q1 2025 to ₹6,222 per sq. ft. in Q1 2026. This is the second lowest price appreciation of the city in the list as it was impacted by the election cycles in the state which caused the buyers to hold the property buying decisions. The QoQ price trend was recorded as 2%. Despite this, the price appreciation was still in effect. The South Kolkata region and the eastern corridors are expected to rise in demand due to the Joka-Esplanade Metro Phase 2 and the New Garia-Airport line in H2 ongoing projects.
8. Chennai
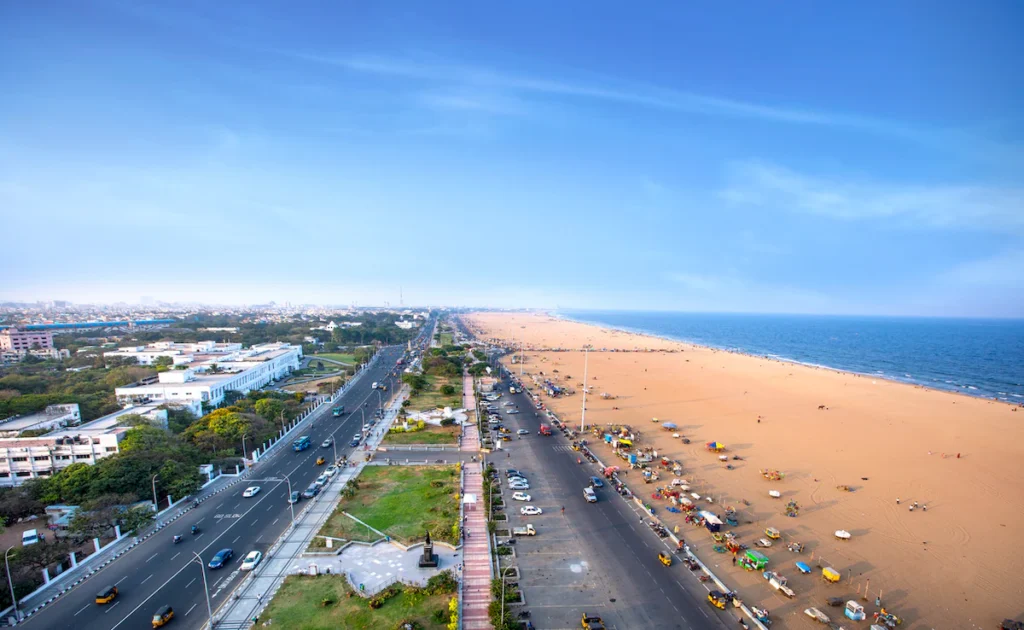
Though the election environment slowed down the launches, Chennai still recorded an annual price appreciation of 3.4% from ₹7,173 per sq. ft. in Q1 2025 to ₹7,416 per sq. ft. in Q1 2026. The QoQ price uptrend was 3%. The demand scenario during the low supply was that, a total of 6,841 units sold against the 4,251 new launches. This consistent demand is expected to rise post-elections as the state policies are introduced.
City Comparison: Q1 2026
Source: PropTiger RealInsight Residential Report, Q1 2026 (Jan-Mar 2026)
All in all
Bengaluru leads with a YoY appreciation of 24.2%, while Pune leads with QoQ appreciation of 9.0%, which suggests the price appreciation is accelerating faster in Pune in the near future. The Mumbai MMR is still the costliest at ₹15,120 per sq. ft. has shown a strong surge of 8% in QoQ indicating that the demand is still high at the premium end.
Written by Jahnavi