Synopsis: UPI transactions hit a record of ₹29.9 lakh crore in value across the nation. This wave is further verified by the NPCI’s statewise contribution data on UPI usage, of April 2026, with Maharashtra topping the charts, followed by Uttar Pradesh, Karnataka, Telangana, and Tamil Nadu.
In the recent data from NPCI, the Unified Payment Interface (UPI) transactions in terms of value displayed an annual appreciation of 19%, from ₹25.14 lakh crore in April 2025 to rising up to ₹29.03 lakh crore in April 2026. This data positions UPI as one of the fastest growing digital payment systems in the world. The states and the top districts pushing this wave are discussed below.
Top States and Regions having most UPI Usage
Maharashtra
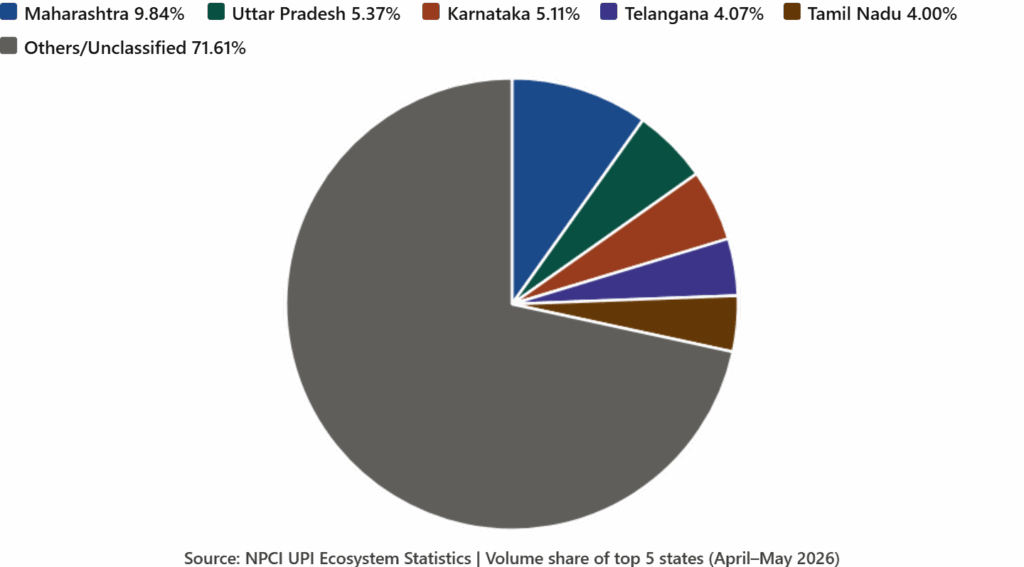
Maharashtra leads the UPI adoption in India by contributing 9.84% in transaction volume and 9.11% in terms of transaction value.
- Mumbai Suburban- The Mumbai Suburban is the leading district in the state of Maharashtra in terms of high UPI usage, and contributing 2.49% in terms of transaction volume and 1.89% in transaction value.
- Pune- This is the second district in Maharashtra contributing 1.86% in transaction volume and 1.66% in terms of transaction value, mainly due to being a concentrated region for IT tech savvy individuals and high frequency of micro-payments.
- Mumbai- Mumbai being the heavily populated districts in India has a contribution of 1.07% for transaction volume, and 0.83% in terms of transaction value.
Uttar Pradesh
At the second position for the heavily used UPI usage state in the country is Uttar Pradesh with a 5.37% in transaction volume and 5.51% in transaction value.
- Gautam Buddha Nagar- This region encompasses the regions of Noida and greater Noida, and has the highest UPI usage in the state with a contribution of 0.77% and 0.61% in terms of transaction volume and transaction value respectively.
- Lucknow- Lucknow is a densely populated city, and contributes 0.44% in transaction volume and 0.41% in transaction value in terms of UPI usage.
- Ghaziabad- Ghaziabad contributes 0.43% in transaction volume and 0.41% in terms of transaction value.
Also read: Top 5 Fastest-Growing States in India Over the Last 5 Years According to RBI Data
Karnataka
The third state with the highest UPI usage is Karnataka with contribution of 5.11% in total transaction volume and 5.71% in total transaction value.
- Bengaluru (Urban)- This region is leading in UPI usage in the state predominantly due to the preference of contactless payment, and contributes 2.86% and 3.02% in terms of transaction volume and transaction value respectively.
- Mysuru- The place is second in the list due to the heavy tourism led micro-business adoption and contributes around 0.21% and 0.25% in terms of transaction volume and transaction value respectively.
- Bengaluru (Rural)- Bengaluru (Rural) contributes around 0.15% and 0.17% in terms of transaction volume and transaction value respectively.
Telangana
The fourth state in the country with highest UPI usage is Telangana with 3.95% and 4.78% in terms of transaction volume and transaction value respectively.
- Ranga Reddy- This district has one of the highest per capita GDPs in the country and contributes 0.93% and 1.10% in terms of transaction volume and transaction value respectively.
- Medchal-Malkajgiri- This district has a thriving MSME ecosystem. The contribution to the UPI usage from this district in terms of transaction volume is 0.88% and in terms of transaction value is 1.00%.
- Hyderabad- Hyderabad one of the oldest cities in India and in the modern era also one of the metropolitan cities has contributed 0.73% in transaction volume and 0.81% in transaction value.
Tamil Nadu
This is the fifth state in the country with highest UPI usage with 3.84% in transaction volume and 4.58% in transaction value.
- Chennai- Chennai is a tech hub, and has a massive merchant adoption of UPI. This city has contributed around 0.88% in transaction volume and 0.97% in transaction value.
- Chengalpattu- This district with tech-savvy population and Special Economic Zones (SEZS), has contributed 0.36% in transaction volume and 0.36% in transaction value.
- Coimbatore- This tier 2 city is a booming commercial hub, and high digital literacy and has contributed around 0.36% in transaction volume and 0.40% in transaction value.
A Pie Chart showing the state-wise usage contribution
All in all
Maharashtra, Uttar Pradesh, Karnataka, Telangana, and Tamil Nadu continue to dominate the UPI transactions in terms of volumes and values, and the key drivers for this were strong digital literacy among people, widespread merchant UPI adoption, and urbanisation. The district and state-wise insights will facilitate in targeting financial inclusion efforts across India.
Written by Jahnavi