
Best Volatility Indicators: Markets move very quickly, and to gain the advantage of fast-moving markets, volatility trading is a great way to potentially capture the uncertainty or any big events in the market.
Volatility trading with technical analysis helps traders to gain the opportunity of trend breakouts and entry/exit signals to manage the risk in placed positions.
What Are Volatility Indicators?
Volatility indicators are the technical tool used by traders to understand how quickly the price of the security is changing. These indicators help traders to learn the stability of the market and also make informed decisions about long and short positions in high and low-volatile securities
By using volatility indicators, traders can get a better understanding of the market to find low-risk trade opportunities.
Volatility has two categories.
Low volatile:- The price of the security doesn’t change more rapidly but tends to be steady.
High Volatile:- The price of the security changes very rapidly in a short period of time in any direction.
Volatility is considered to be riskier, so here we have 10 volatility indicators to avoid the trap with wrong trades.
10 Best Volatility Indicators
In this article, we are going to dive deeper into the Best volatility Indicators that are used by traders..
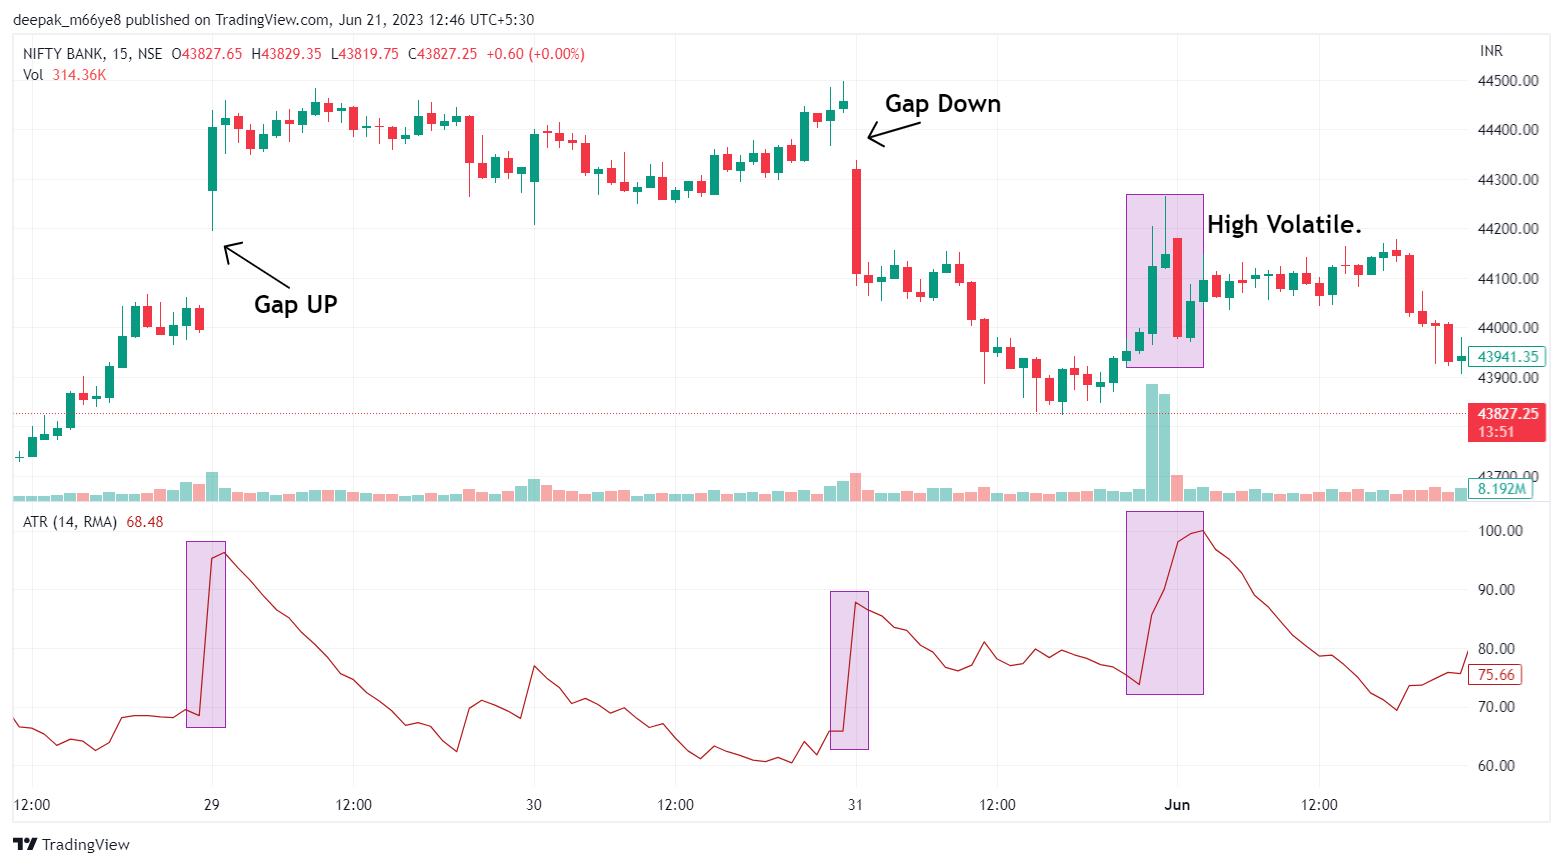
Best Volatility Indicators #1 – Average True Range (ATR)
The average True Range(ATR) is a market volatility indicator that measures the average range of price movement over a specific period of time.ATR is basically derived from the 14-period simple moving average.
Impact of the Indicator
As plotted on the chart ATR fluctuates as per the change in price of the security, with a higher ATR value indicating greater market volatility and a lower ATR value indicating lower market volatility.
ATR is often used by traders to adjust strategies and manage risk accordingly by identifying correct position sizes, breakouts and trend reversals.
(Source: TradingView)
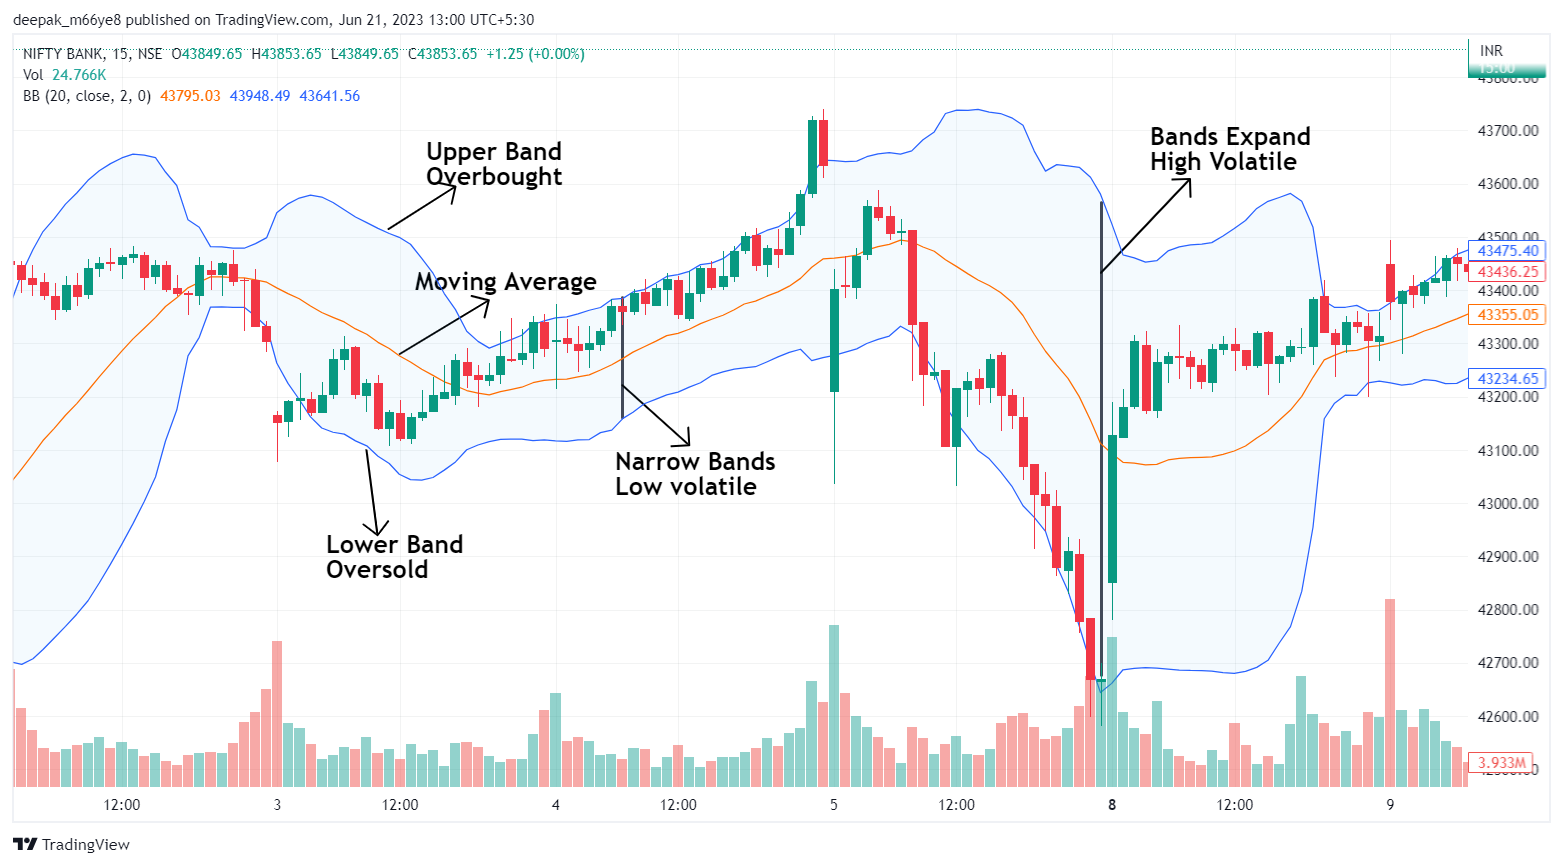
Best Volatility Indicators #2 – Bollinger Bands
Bollinger bands are a technical analysis tool comprised of three lines, a simple moving average, and an upper and lower band.
Impact of the indicator
Bollinger Bands signify low volatility when the bands contract, and high volatility when the bands expand.
The price fluctuates between bands for the trendy and range-bound markets in which the upper band is considered overbought and the lower band is considered an oversold signal.
These bands provide value to breakouts and reversals for better signals to entry/exit of the position.
(Source: TradingView)
Best Volatility Indicators #3 – Volatility Index (VIX)
volatility Index(VIX) measures the volatility of the Index options over a period. It represents volatility that traders can expect for the next 30-day term in the index.
Impact of the Indicator
A lower VIX level implies lower volatility and a stable range in the market, whereas higher VIX levels signal high volatility in the market.
For example, India VIX is based on the NIFTY 50 index.
Here one should understand that VIX measures only the volatility present in the index but not the direction of the index.
VIX also plays an important role for options traders. A higher VIX level signals a more volatile options price and vice versa.

(Source: TradingView)
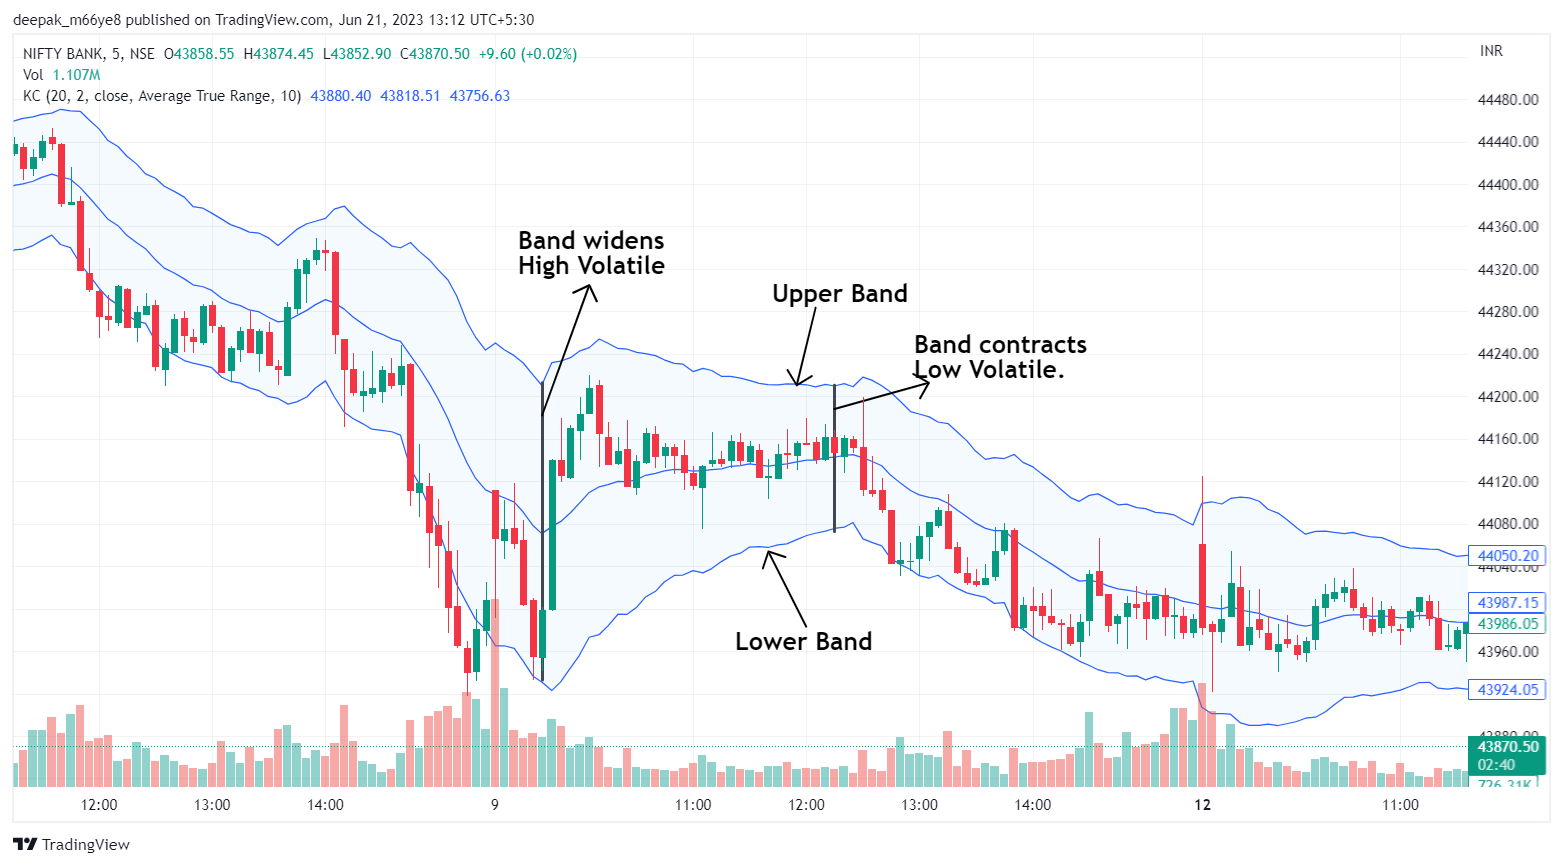
Best Volatility Indicators #4 – Keltner Channels
Keltner Channels are volatility-based bands that are similar to Bollinger bands. It is plotted around an Exponential Moving Average(EMA) and the distance between the channel is based on Average True Range(ATR).
Impact of the Indicator
Keltner Channels help identify trends and breakouts by displaying moving averages placed between upper and lower bands. When the band widens it signals high volatility, and low volatility when bands contract.
The channel provides value on an over-bought and over-sold zone when the price of the securities reaches near bands indicating a trend reversal or continuation.
Kelter channels assist traders to adopt market volatility and manage the strategies for open positions.
(Source: TradingView)
Best Volatility Indicators #5 – Donchian Channels
Donchian Channels developed by Richard Donchain, consists of three lines in which the middle one is the moving average, the upper band is the highest of prices and the lower band is the lowest of prices over a specific period.
Impact of the Indicator
The channel indicates the volatility of the market, when the channel length narrows, it signals low volatility, and when it widens, it signals high volatility.
The channel enables the trader to identify breakouts, trend reversals, support and resistance levels by tracking the price movements. The clarity of this channel combined with other technical tools helps the trader to manage the positions in the volatility market.

(Source: TradingView)
Best Volatility Indicators #6 – Chaikin Volatility Indicator
The indicator measures the difference between high and low prices of the security over a specific period of time, combined with the volume of the security.
Impact of the Indicator
An increase in the Chaikin volatility indicator suggests more volatility, while a decrease in the indicator indicates lower volatility.
The Indicator reflects the price movement helping traders to identify trends, potential reversals, breakouts and consolidation ranges.
Traders can adjust the time frame of the indicator to suit their specific trading strategies.

(Source: TradingView)
Best Volatility Indicators #7 – RVI – Relative Volatility Index
The Relative Volatility Index (RVI) was developed by Donald Dorsey, it is a technical analysis tool that measures the direction and strength of the security over a specific period.RVI fluctuates between zero to 100 with a central level fixed.
Impact of the Indicator
The RVI analyses the standard deviation of price change for a specific period to measure the volatility.
RVI as an oscillator moves in a range, enabling traders to identify overbought and oversold zones which signals the potential trend reversals.
The RVI indicator used with other technical tools, improves entry and exit decisions.

(Source: TradingView)
Best Volatility Indicators #8 – Chande Momentum Oscillator (CMO)
The CMO is the momentum-based indicator, it measures the market volatility by comparing positive and negative price changes of the security. The indicator oscillates between -100 to +100
Impact of the Indicator
The indicator oscillating at higher values indicates uptrend momentum and volatility, while the indicator oscillating at lower values indicates downtrend momentum and volatility.
CMO helps traders identify market trends and entry-exit points during volatile markets.
Adding up other technical indicators with CMO helps traders to enhance market analysis and strengthen their trading strategies.

(Source: TradingView)
Best Volatility Indicators #9 – Historical Volatility (HV)
Historical volatility indicator measures the variation in a securities price over a specific period. It doesn’t measure the direction of the security.
Impact of the Indicator
As Historical volatility is rising or higher than normal, it means the price of security is changing more quickly than usual.
When the Historical volatility is falling, it means that the price of the security is returning to normal by removing the uncertainty in the market.
HV reveals past price fluctuations, helping traders spot volatile market opportunities to place low-risk positions and manage trading strategies.

(Source: TradingView)
Best Volatility Indicators #10 – Implied volatility
Implied Volatility(IV) is one the important indicator to gauge how volatile markets might follow. For option traders, implied volatility is more valuable than historical volatility(HV).
Impact of the Indicator
Implied volatility increases in a bearish market, where the price of the security declines. IV decreases when the market is bullish.
The indicator is often used by options traders, when implied volatility is high the options premiums will be higher and vice versa.

(Source: TradingView)
Intraday Time Frames
All the above-listed volatility indicators can be adjusted to any of the time frames based on the trading strategies. It is advised to follow shorter time frames like 5 min or 15 min to capture the fast movements in the market.
In Closing
Volatility trading is good for traders who can engage in fast-moving markets. The above-mentioned 10 volatility indicators help traders to manage the risks involved in the positions.
A great understanding of the above indicators along with other technical analysis tools helps the market participants to gain a clear view of opportunities in the live market.
Written by Deepak M
By utilizing the stock screener, stock heatmap, portfolio backtesting, and stock compare tool on the Trade Brains portal, investors gain access to comprehensive tools that enable them to identify the best stocks also get updated with stock market news, and make well-informed investment decisions.
