

Best Harmonic Patterns: Chart patterns are an important tool of technical analysis for traders to build strategies with a better understanding of price movements.

Harmonic patterns are the type of chart patterns formed more precisely with price movements to identify the accurate entry, stop loss and targets in security.
Here we shall discuss the meaning of Harmonic patterns and the 5 best harmonic patterns to trade with their formation and entry/exit opportunities.

What are Harmonic Patterns?
Harmonic patterns are the type of chart patterns that represent geometric price patterns by using Fibonacci retracement levels.
Accurate pattern formation helps traders identify trends and price reversals with well-defined entry, stop loss and targets.

The Fibonacci retracement level is a horizontal line of numbers indicating the security’s support and resistance levels.
Harmonic means the creation of wave structure in any interval, the primary key with harmonic pattern formation lies in price movements and Fibonacci retracement levels to predict future price trend reversals in the securities.
Types of Harmonic Patterns
Harmonic patterns are of various types here we shall discuss the 5 best Harmonic Patterns to trade.

- The Butterfly Pattern
- The Gartley Pattern
- The BAT Pattern
- The Crab Pattern
- The ABCD Pattern
Best Harmonic Patterns #1 – The Butterfly Pattern
The Butterfly pattern forms a bullish and bearish butterfly pattern which is slightly different from other patterns.
In a bullish butterfly pattern, point XA is considered in an uptrend, and as the price reverses to point B from point A, line AB retraces to 78.6% of length XA from point A. Moving to point C from Point B, the CB line will be 38.2% to 88.6% retracement of line AB.
As the price reverses from point C, line CD is either a 161.1% to 224% extension of AB or an extension of XA by 127%.
A reversal from point D towards the upside can be registered to go long in a position.
A bearish butterfly pattern is the inverse of a bullish butterfly pattern with all the same Fibonacci levels and a reversal from point D towards the downside can be registered to go a short in the position.

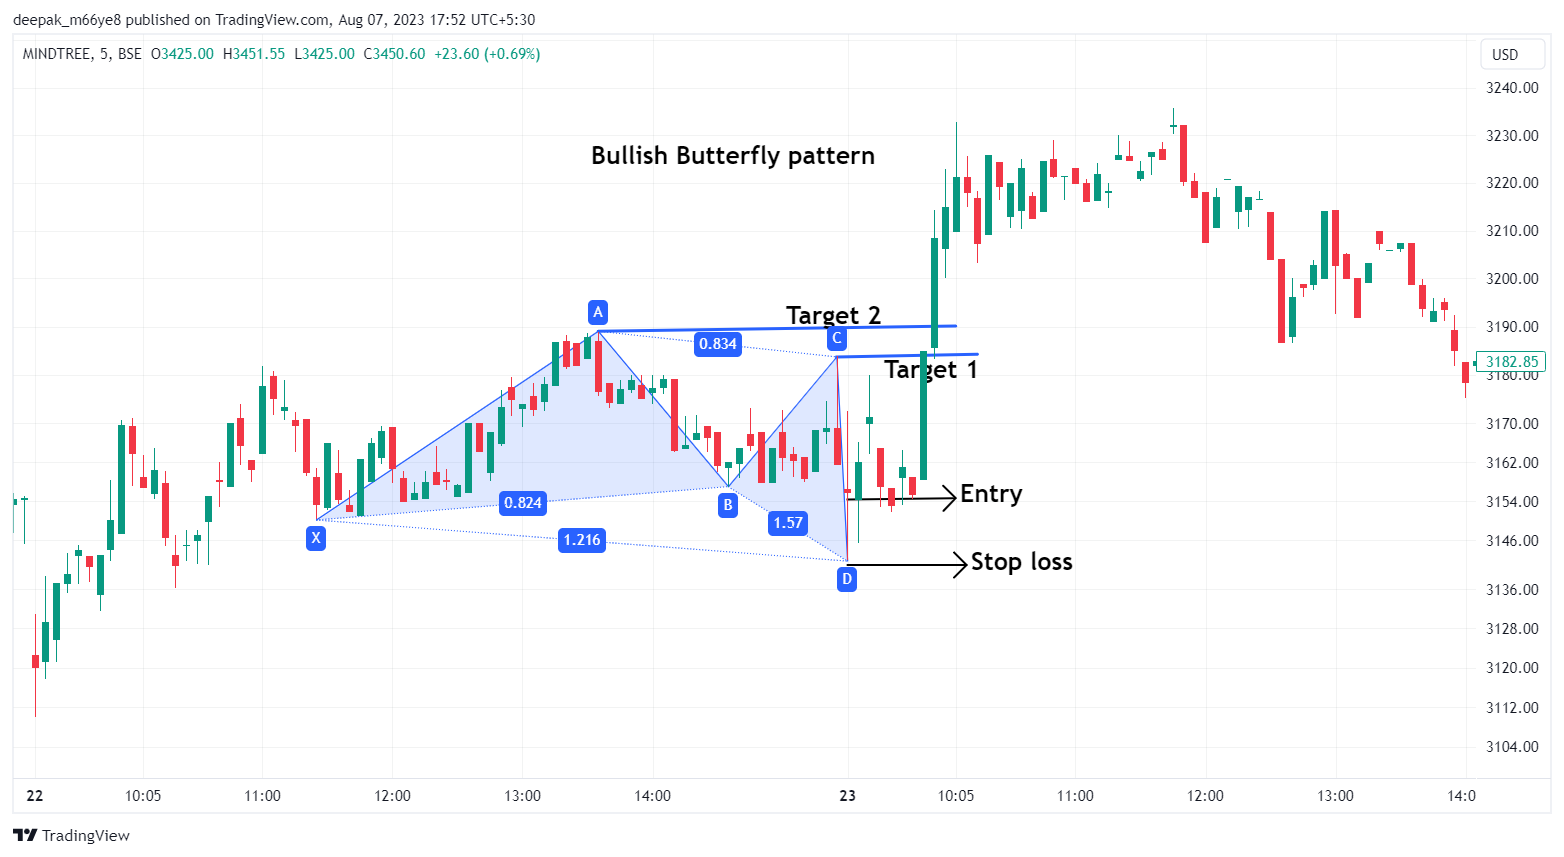
Chart of Mind tree showing Bullish Butterfly pattern with entry, stop loss and target levels based on the retracement values.

Chart of Jubliant food works showing Bearish Butterfly pattern with entry, stop loss and target levels based on the retracement values.
Best Harmonic Patterns #2 – The Gartley Pattern
The Gartley Pattern was developed by H M Gartley having a bullish Gartley pattern and a bearish Gartley pattern.
In a bullish Gartley pattern, point XA is considered in an uptrend, and as the price reverses to point B from point A, line AB retraces to 61.8% of length XA from point A. Moving to point C from Point B, the CB line will be 38.2% to 88.6% retracement of line AB.
As the price reverses from point C, line CD is either a 113% to 161.8% extension of AB or a retracement of XA by 78.6%.
A reversal from point D towards the upside can be registered to go long in security.
The bearish Gartley pattern is the inverse of the bullish Gartley pattern with the same values. A price reversal at point D towards the downside can be registered to go short in security.


Chart of HDFC bank showing Bullish Gartley pattern with entry, stop loss and target levels based on the retracement values.

Chart of Vedanta Ltd showing Bearish Gartley pattern with entry, stop loss and target levels based on the retracement values.
Best Harmonic Patterns #3 – The BAT Pattern
The appearance of a BAT pattern is similar to the Gartley pattern but the Fibonacci retracement ratios differ in both bearish and bullish trends.
In a bullish BAT pattern, point XA is considered in an uptrend, and as the price reverses to point B from point A, line AB retraces to 38.2% to 50% of length XA from point A. Moving to point C from Point B, the CB line will be 38.2% to 88.6% retracement of line AB.
As the price reverses from point C, line CD is either a 161.8% to 261.8% extension of AB or a retracement of XA by 88.6%.
A reversal from point D towards the upside can be registered to go long in security.
The bearish BAT pattern is quite the inverse of the bullish BAT pattern with the same values. A price reversal at point D towards the downside can be registered to go short in security.


Chart of Reliance Ind showing Bullish Bat pattern with entry, stop loss and target levels based on the retracement values.

Chart of ICICI Bank showing Bearish Bat pattern with entry, stop loss and target levels based on the retracement values.
Best Harmonic Patterns #4 – The Crab Pattern
The Crab pattern is considered precise compared to other patterns with its accurate price reversal points in bullish and bearish trends.
In a bullish Crab pattern, point XA is considered in an uptrend, and as the price reverses to point B from point A, line AB retraces to 38.2% to 61.8% of length XA from point A. Moving to point C from Point B, the CB line will be 38.2% to 88.6% retracement of line AB.
As the price reverses from point C, line CD is either a 261.8% to 361.8% extension of AB or an extension of XA by 161.8%.
A reversal from point D towards the upside can be registered to go long in security.
The bearish Crab pattern is quite the inverse of the bullish Crab pattern with the same ratios. A price reversal at point D towards the downside can be registered to go short in security.


Chart of Nifty IT showing Bullish Crab pattern with entry, stop loss and target levels based on the retracement values.

Chart of Reliance Ind showing Bearish Crab pattern with entry, stop loss and target levels based on the retracement values.
Best Harmonic Patterns #5 – The ABCD Pattern
ABCD pattern is the simplest type of harmonic pattern where the movements are captured by 4 points ABCD. The pattern can be of classic ABCD, AB=CD and ABCD extension pattern.
In a bullish ABCD pattern, point AB is considered in a downtrend, and point C is a 61.8% to 78.6% retracement of length AB from point B.
Point D drawn from point C is an extension of AB between 127.2% to 161.8%.
A reversal from point D towards the upside can be registered to go long in security.
The bearish ABCD pattern is quite the inverse of the bullish ABCD pattern with the same values. A price reversal at point D towards the downside can be registered to go short in security.


Chart of Infosys showing Bullish ABCD pattern with entry, stop loss and target levels based on the retracement values.
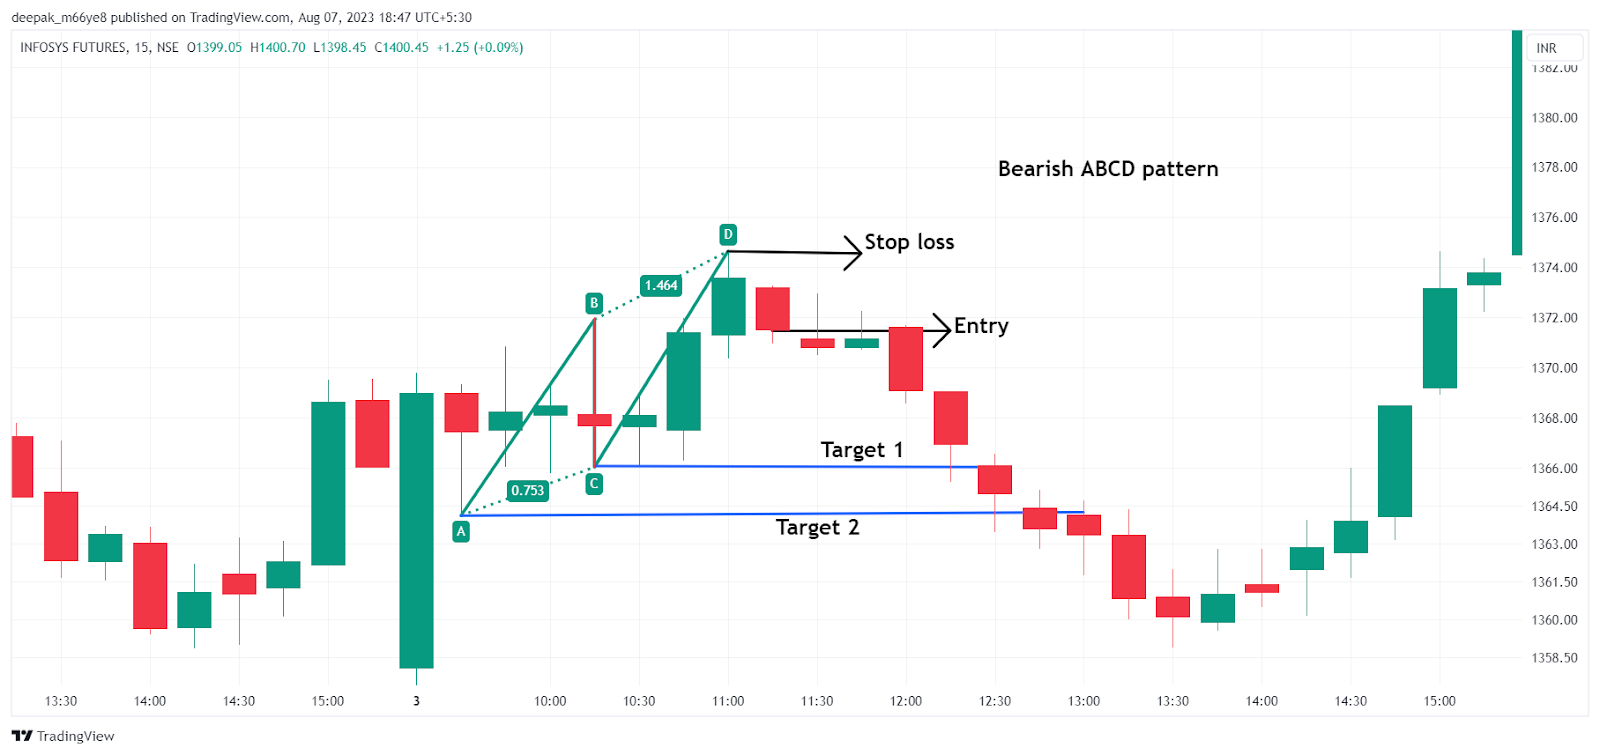
Chart of Infosys showing Bearish ABCD pattern with entry, stop loss and target levels based on the retracement values.
The classic ABCD is as discussed above, with the same data if AB=CD then it is considered an ABCD pattern and if CD length is double AB in the ABCD pattern then it is considered an ABCD extension pattern.
Entry, Stoploss and Target.
- The complete formation of the harmonic pattern gives an entry to a long or short position at potential reversal zone point D.
- The stop loss for the position will be below the long entry or above the short entry based on the risk management rules.
- For intraday setups, the time frame can be 5 min or 15 min based on the trader’s strategies.
How to Plot Harmonic Patterns on Charts?
The harmonic patterns can be plotted on charts easily on the TradingView platform, When you open the chart of any securities choose the patterns tool on the left side of the charts.
In the patterns tool, you can choose an ABCD pattern for ABCD harmonic patterns and an XABCD pattern for all other harmonic patterns.
In Closing
Harmonic patterns are accurate to spot trading opportunities with practice to master the patterns.
Traders should learn and understand the above-mentioned 5 best harmonic patterns to avoid the risk of false trades with wrong pattern identification.
With the correct identification of patterns, one should strictly follow the risk management of the positions to be rewarded with good profits.
Written By Deepak M
By utilizing the stock screener, stock heatmap, portfolio backtesting, and stock compare tool on the Trade Brains portal, investors gain access to comprehensive tools that enable them to identify the best stocks also get updated with stock market news, and make well-informed investment decisions.


