On Thursday, market sentiment was broadly positive, despite a cautious start. The Nifty 50 and Sensex both managed to reverse early losses and end the day in green, indicating underlying strength in investor confidence. The gains were largely driven by optimism surrounding a potential rate cut from the US Federal Reserve, as well as improving trade relations between the US and India. Technical indicators further supported the bullish outlook, with both indices maintaining positions above key moving averages. Investors showed renewed buying interest, especially in oil & gas and media stocks, reflecting sector-specific momentum.
However, the mood wasn’t uniformly upbeat across the board. The IT sector faced selling pressure, weighed down by disappointing performances from major players, suggesting that investors might be repositioning away from rate-sensitive and export-driven sectors amid the changing macroeconomic backdrop. Auto and consumer durables also saw profit booking, signalling some caution in discretionary spending segments.
Globally, markets showed mixed reactions, with strength in Japan and China contrasting declines in Hong Kong. Overall, while the broader sentiment leaned bullish, selective sectoral weakness hinted at a market still weighing global cues and domestic fundamentals.
In this overview, we will analyse the key technical levels and trend directions for Nifty and BSE Sensex to monitor in the upcoming trading sessions. All the charts mentioned below are based on the 5-minute timeframe.
Nifty 50
(In this analysis, we have used 20/50/100/200 EMAs, where 20 EMA (Red), 50 EMA (Orange), 100 EMA (Light Blue), and 200 EMA (Dark Blue)).
To view other technical reports, click here
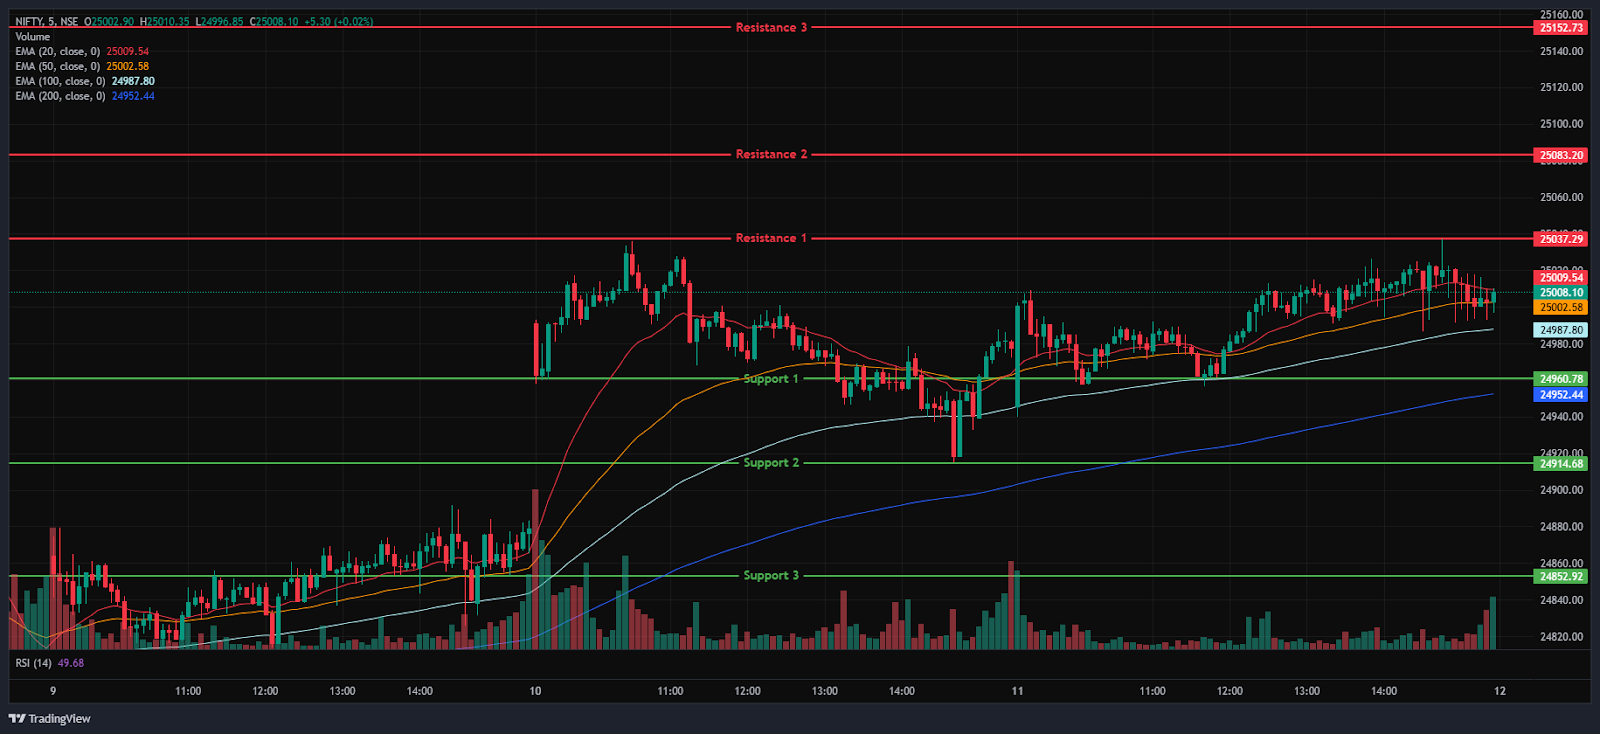
The Nifty 50 Index opened on a negative note at 24,945.50 on Thursday, down by 27.6 points from Wednesday’s closing of 24,973.10. The index began the day on a negative note and fell as low as 24,940.15, but it eventually recovered and held above 25,000. The index fluctuated between 24,950 and 25,000 during the morning session, trading above its opening level at 25,000.80. The index traded above the 20/50/100/200 EMAs during the morning session’s 15-minute time frame. Later, in the afternoon session, the index consolidated around the 25,000 level, trading in green.
Overall, the index ended in a positive state on the Thursday session. During the afternoon session, the Nifty 50 was traded above all four EMAs of 20/50/100/200 in the 15-minute time frame. Nifty’s immediate resistance levels are R1 (25,037), R2 (25,083), and R3 (25,153), while immediate support levels are S1 (24,961), S2 (24,915), and S3 (24,853).
The Nifty index had reached a day’s high at 25,037.30 and saw a day’s low at 24,940.15. Finally, it had closed at 25,005.50, in green above the 25,000 level, gaining 32.40 points, or 0.13%. The Nifty 50 closed above all four EMAs of 20/50/100/200 EMAs in the daily time frame.
Momentum Indicators
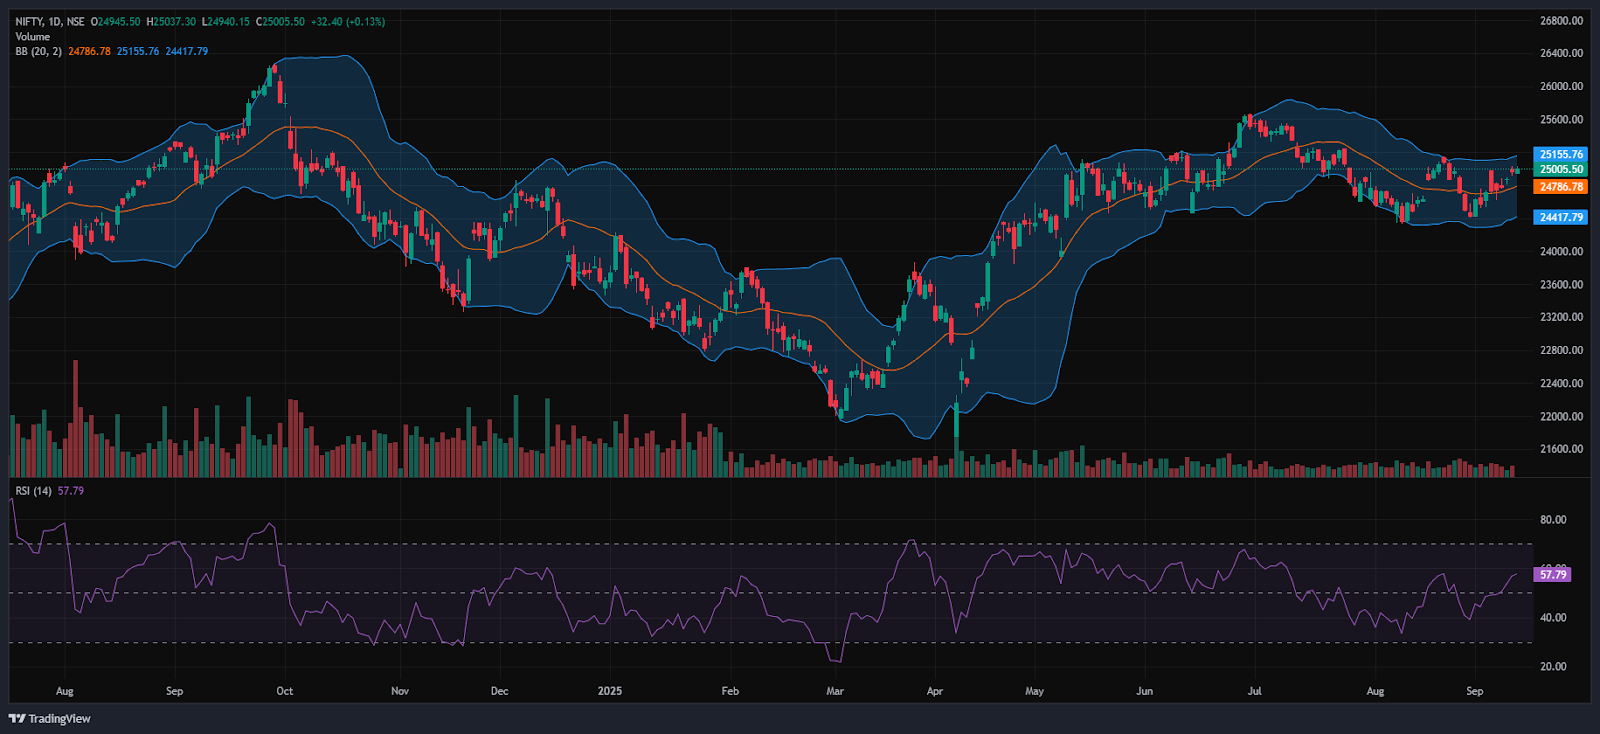
RSI (Daily): The Nifty 50’s RSI stood at 57.79, which is well below the overbought zone of 70, indicating a bullish sentiment.
Bollinger Bands (Daily): The index is still trading in the upper half of its Bollinger Band range above the middle band (Simple Moving Average). Its position in the upper range, along with solid support around the 25,000 level. A sustained move above the middle band signals a bullish sentiment, while a drop back toward the lower band may reinforce bearish sentiment.
Volume Analysis: Thursday’s trading session average volumes stood at 224.56 Mn.
Derivatives Data: Options OI indicates strong Put writing at 25,000, following 24,900, establishing it as a firm support zone. On the upside, a significant Call OI buildup at 25,100 and 25,200 suggests a potential resistance supply. PCR (Put/Call Ratio) stands at 1.1522 (>1), leaning towards bearish sentiment and the long buildup signals a potential upward move, with an overall mixed outlook for the next trading session.
Bank Nifty
(In this analysis, we have used 20/50/100/200 EMAs, where 20 EMA (Red), 50 EMA (Orange), 100 EMA (Light Blue), and 200 EMA (Dark Blue)).
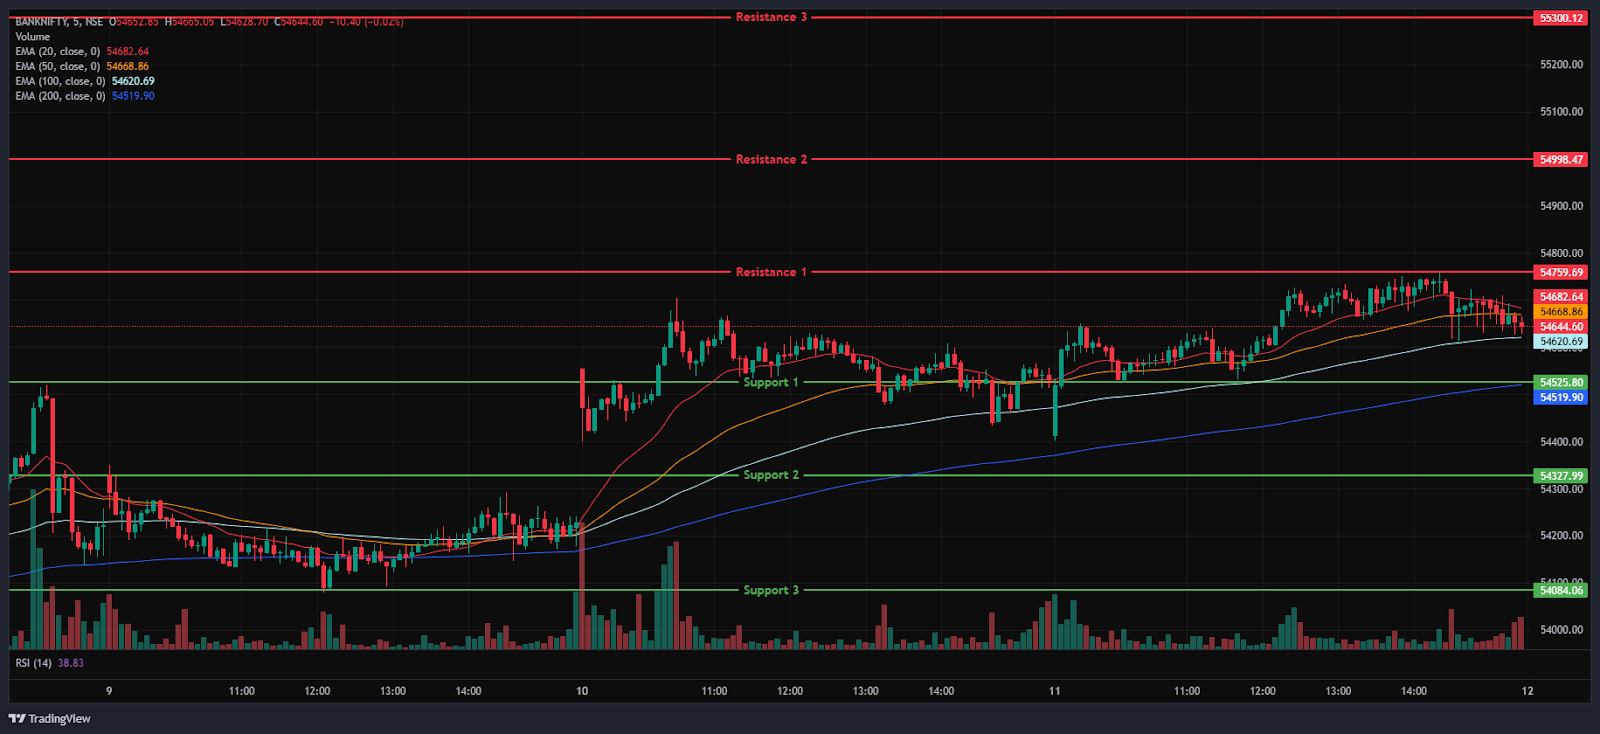
The Bank Nifty Index started the session on a negative note at 54,413.05 on Thursday, down by 122.95 points from Wednesday’s closing of 54,536.00. The index began on a bearish note, plunging to the day’s low at 54,400. But later the index recovered from the day’s low, reaching 54,650 and trading above its opening level at 54,674.45 in the morning session. The index was traded above all four EMAs of 20/100/50/200 in the 15-minute time frame and was trading between the 54,400 and 54,700 levels in the morning session.
The Bank Nifty index consolidated around the 54,650 level during the afternoon session, trading in the green. During the afternoon session, Bank Nifty closed above the EMAs of 50/100/200 but remained below the 20 EMAs in the 15-minute time frame. Bank Nifty immediate resistance levels are R1 (54,760), R2 (54,998), and R3 (55,300), while immediate support levels are S1 (54,526), S2 (54,328), and S3 (54,084).
The Bank Nifty index had peaked at 54,757.45 and made a day’s low at 54,402.40. Finally, it had closed in green at 54,669.60, breaking above the 54,650 level, gaining 133.60 points or 0.24%. The Relative Strength Index (RSI) stood at 47.42 and was near the oversold zone in the daily time frame, and Bank Nifty closed below the EMAs of 50/100 but remained above the 20/200 EMA in the daily time frame.
Sensex
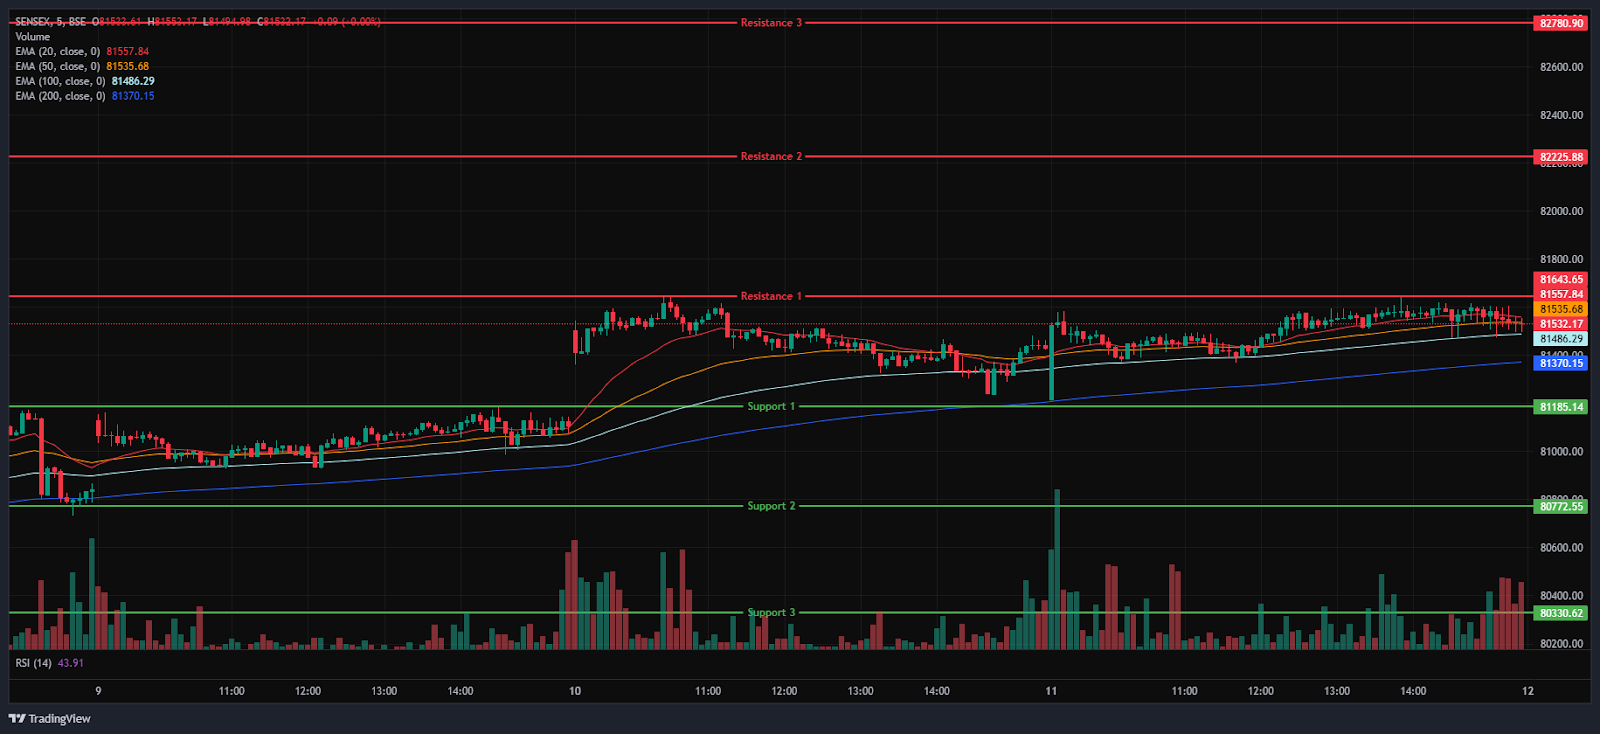
(In this analysis, we have used 20/50/100/200 EMAs, where 20 EMA (Red), 50 EMA (Orange), 100 EMA (Light Blue), and 200 EMA (Dark Blue)).
To view other technical reports, click here
The BSE Sensex Index opened on a negative note at 81,217.30 on Thursday, down by 207.85 points from Wednesday’s closing of 81,425.15. The Index started on a bearish note in the morning session. But later the Index surged above the 81,500 mark and was above its opening level in the morning session at 81,542.62. The Index was traded above all four EMAs of 20/50/100/200 in the 15-minute time frame and was trading between 81,200 and 81,600 in the morning session.
In the afternoon session, the Sensex Index consolidated around the 81,500 level, trading in green. However, the Index managed to stay above the 81,550 level during the afternoon session, maintaining its overall positive trend, and was trading above all four EMAs of 20/50/100/200 in the 15-minute time frame. BSE Sensex immediate resistance levels are R1 (81,558), R2 (82,226), and R3 (82,781), while immediate support levels are S1 (81,185), S2 (80,773), and S3 (80,331).
The BSE Sensex index had peaked at 81,642.22 and made a day’s low at 81,216.91. Finally, it had closed at 81,548.73 in green, gaining 123.58 points or 0.15%. The Relative Strength Index (RSI) stood at 56 (below the overbought zone of 70) in the daily time frame, and the BSE Sensex closed above all four EMAs of 20/50/100/200 in the daily time frame.
India VIX
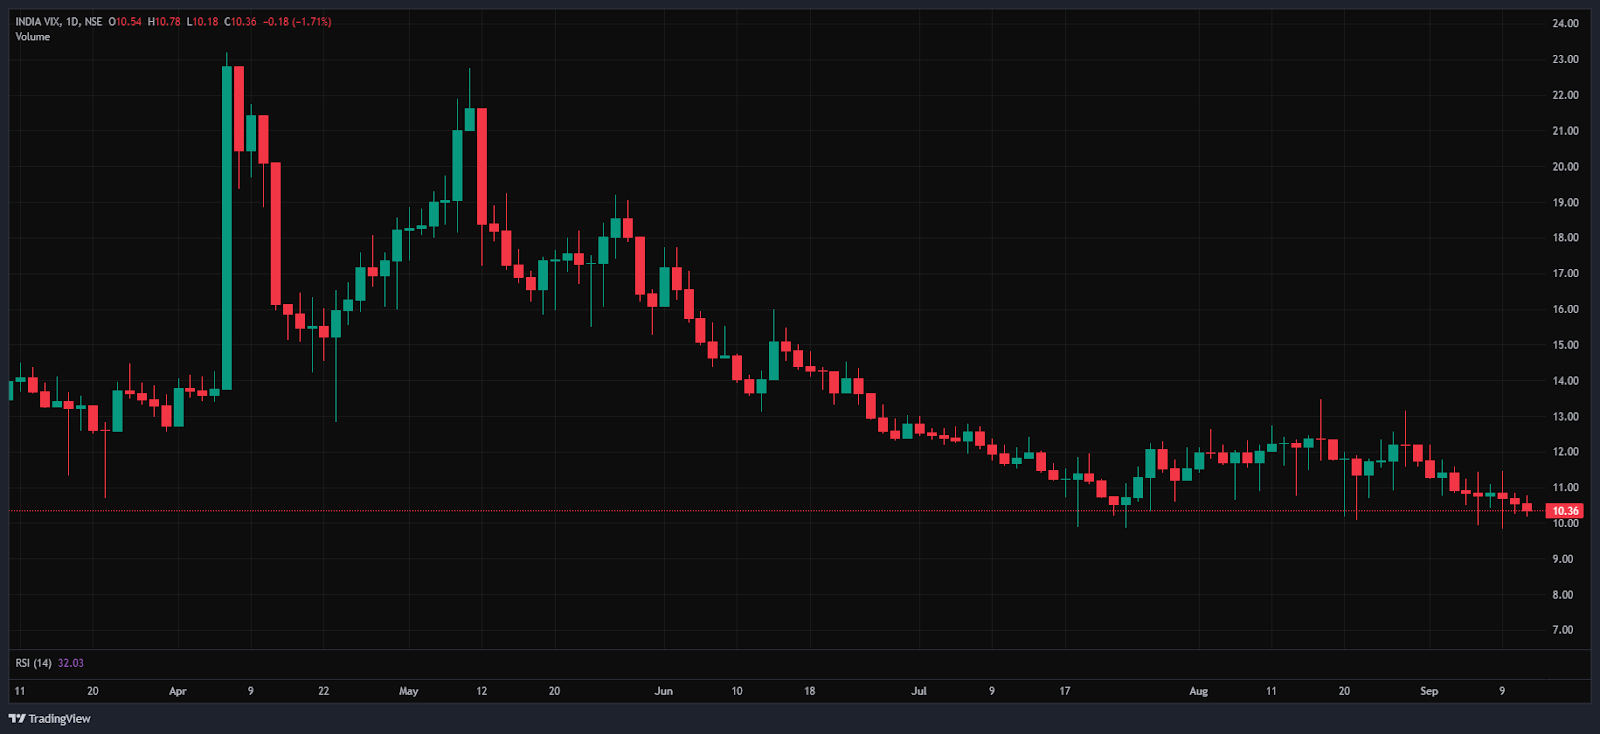
The India VIX decreased by 0.18 points or 1.68%, from 10.54 to 10.36 during Thursday’s session. A decrease in the India VIX typically indicates lower price volatility in the stock market, suggesting a more stable market environment.
Market Recap on the 11th of September 2025
On Thursday, the Nifty 50 opened on a bearish note at 24,945.5, slightly down by -27.6 points from its previous close of 24,973.10. It crossed the 25,000 mark, touching an intraday high of 25,037.3 and ending the session at 25,005.5, registering a gain of 32.4 points, or 0.13%. The index closed above all four key EMAs (20/50/100/200-day) on the daily chart.
The BSE Sensex followed a similar trajectory, opening at 81,217.3, down -207.85 points from its previous close of 81,425.15. It settled at 81,548.73, adding 123.58 points, or 0.15%. The broad indices showed positive reactions mainly due to investors’ hopes of a US Fed rate cut, easing trade concerns between the US and India, which would help markets stay positive.
In terms of momentum indicators, the Nifty 50’s Relative Strength Index (RSI) stood at 57.79, while the Sensex RSI was at 56, both comfortably below the overbought level of 70. The Bank Nifty Index also ended higher, rising 133.6 points, or 0.24%, to close at 54,669.6.
The majority of the sectoral indices ended in green on Thursday, with only a few losers. Among the top sectoral performers, the Nifty Oil & Gas Index led the gains for the second consecutive session, closing at 11,086.55, up 120.4 points or 1.1%. Gujarat State Petronet Ltd increased 3.5%. Other oil & gas stocks, including GAIL India Ltd, Indian Oil Corporation, and Aegis Logistics Ltd, also gained up to 3%.
The Nifty Media Index followed, ending at 1,627.45 with a rise of 16.5 points or 1%. Dish TV Ltd emerged as the top gainer with a 4.3% rise, followed by Zee Entertainment, up 2%, and DB Corp Ltd, which gained 1.9%. The Nifty PSE Index also featured among the top gainers, closing at 9,590.7, up 92.95 points or 1%.
On the losing side, the Nifty IT Index was the worst performer in Thursday’s session. The index closed at 36,003.5, down -180.3 points or -0.5%. Infosys Ltd was the top laggard, falling by -1.5%. Other IT stocks such as Mphasis Ltd, Oracle Financial Services Software Ltd and Wipro Ltd declined by up to -1.5%. The Nifty Auto Index also ended in the red at 26,744.45, down -89.50 points or -0.3%, with notable losers including Bajaj Auto Ltd, Eicher Motors Ltd, Hero MotoCorp Ltd and Bosch Ltd, which dropped up to -1.4%. The Nifty Consumer Durables Index also ended in red, falling by -112.95 points or -0.30%, to close at 39,407.20.
Asian markets showed a mixed trend on Thursday. Hong Kong’s Hang Seng Index ended the day lower at 26,086.32, down -113.94 points, or -0.43%. China’s Shanghai Composite Index closed at 3,875.30, up 63.08 points, or 1.65%. The KOSPI Index for South Korea ended the day in green at 3,344.2, up 29.67 points, or 0.9%. At 44,372.5, Japan’s Nikkei 225 Index also ended the day higher, up 534.83 points, or 1.22%. At 4:11 p.m. IST, the US Dow Jones Futures were up 77 points, or 0.17%, at 45,617.
Trade Setup Summary
The Nifty 50 opened on a negative note at 24,945.50 on Thursday but ended the session in the green above the 25,000 level at 25,005.50. A break below 24,961 could trigger further selling towards 24,915, while breaking the next resistance level of 25,037 could trigger bullishness towards the 25,083 level.
Bank Nifty started the session on a negative note at 54,413.05 but ended the session in the green at 54,669.60, above the 54,650 level. A break below 54,526 could trigger further selling towards 54,328, while breaking the next resistance level of 54,760 could trigger bullishness towards the 54,998 level.
Sensex also opened on a negative note at 81,217.30 but ended the session in the green at 81,548.73, above the 81,500 level. A break below 81,185 could trigger further selling towards 80,773, while breaking the next resistance level of 81,558 could lead towards the 82,226 level.
Given the ongoing volatility and mixed sentiments, it’s advisable to avoid aggressive positions and wait for clear directional moves above resistance or below support. Traders should consider these key support and resistance levels when entering long or short positions following the price break from these critical levels. Additionally, traders can combine moving averages to identify more accurate entry and exit points.
Disclaimer

The views and investment tips expressed by investment experts/broking houses/rating agencies on tradebrains.in are their own, and not that of the website or its management. Investing in equities poses a risk of financial losses. Investors must therefore exercise due caution while investing or trading in stocks. Trade Brains Technologies Private Limited or the author are not liable for any losses caused as a result of the decision based on this article. Please consult your investment advisor before investing.
About: Trade Brains Portal is a stock analysis platform. Its trade name is Dailyraven Technologies Private Limited, and its SEBI-registered research analyst registration number is INH000015729.
Investments in securities are subject to market risks. Read all the related documents carefully before investing.
Registration granted by SEBI and certification from NISM in no way guarantee performance of the intermediary or provide any assurance of returns to investors.
