
On Monday, the market opened lower and remained under pressure throughout the session, with key benchmarks closing in negative territory. Despite the decline, the overall technical setup remained intact as the indices held above crucial moving averages. Sector-wise, energy stocks stood out as top performers, buoyed by a strong rally in select companies following favorable corporate actions and regulatory clarity. Media and metal sectors also posted modest gains, while IT and pharma sectors faced significant selling pressure, weighed down by concerns over rising costs and regulatory challenges.

Globally, Asian markets mostly showed strength, with notable gains in Japan, China, and South Korea, though Hong Kong bucked the trend with losses. US futures traded lower, reflecting cautious sentiment amid broader uncertainty. A major factor dampening investor mood was the recent announcement of a sharp increase in H1-B visa fees by the US government, which sparked concerns among skilled workers and firms reliant on foreign talent, particularly impacting banking and technology sectors. Overall, the market outlook remained cautious, balancing pockets of sectoral strength against lingering headwinds.
In this overview, we will analyze the key technical levels and trend directions for Nifty and BSE Sensex to monitor in the upcoming trading sessions. All the charts mentioned below are based on the 5-minute timeframe.

NIFTY 50
(In this analysis, we have used 20/50/100/200 EMAs, where 20 EMA (Red), 50 EMA (Orange), 100 EMA (Light Blue), 200 EMA (Dark Blue)).
To view other technical reports, click here
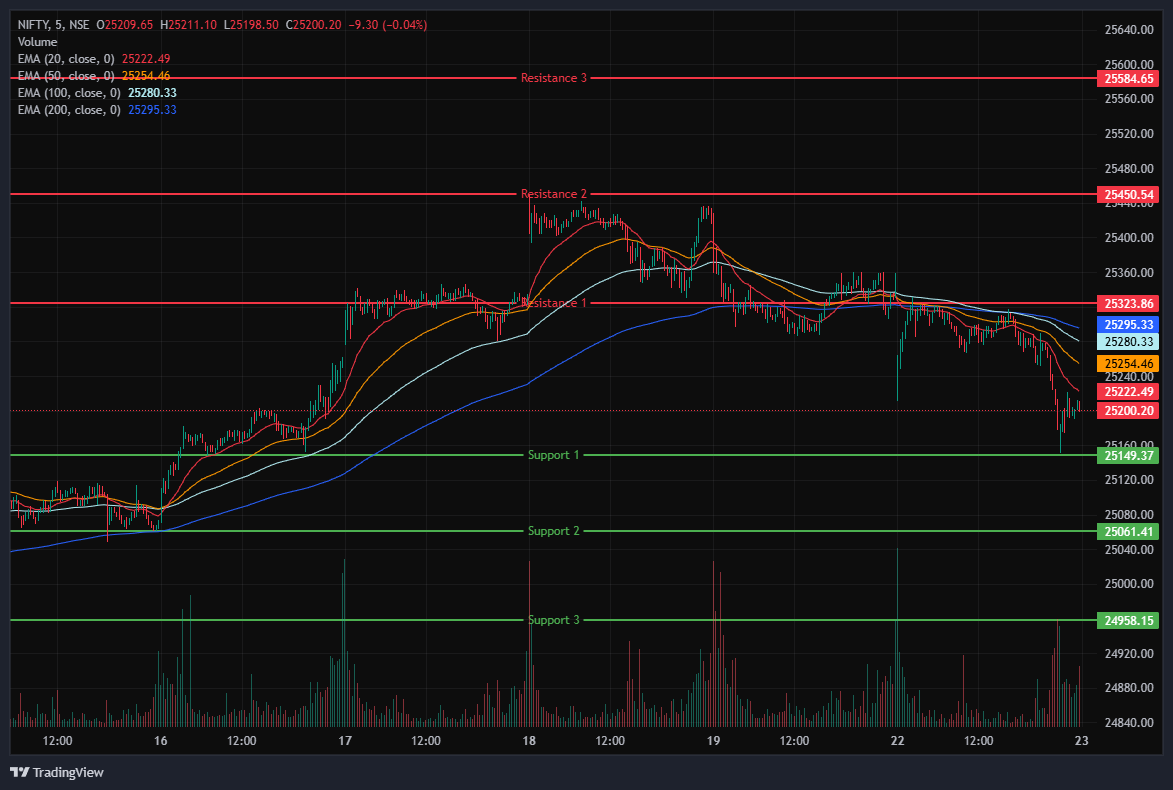
The Nifty 50 Index opened on a negative note at 25,238.1 on Monday, down by 88.95 points from Friday’s closing of 25,327.05. With a bearish start to the day, the index had a volatile morning session, trading between 25,270 and 25,320 range. Additionally, the Index stood above the EMAs of 100/200 but remained below the 20/50 EMA in the 15-minute time frame during the morning session.
The index fell as low as the 25,151.05 mark, reaching its day low in the afternoon session and traded below its opening level, between the range of 25,270 and 25,170. During the afternoon session, the Nifty 50 traded below the three EMAs of 20/50/100 and above the 200 EMA in the 15-minute time frame. Nifty’s immediate resistance levels are R1 (25,324), R2 (25,451), and R3 (25,585), while immediate support levels are S1 (25,149), S2 (25,061), and S3 (24,958).

The Nifty index had reached a day’s high at 25,331.7 and saw a day’s low at 25,151.1. Finally, it had closed at 25,202.4, in red below the 25,250 level, losing 124.7 points, or 0.49%. The Nifty 50 closed above all four EMAs of 20/50/100/200 EMAs in the daily time frame.
Momentum Indicators
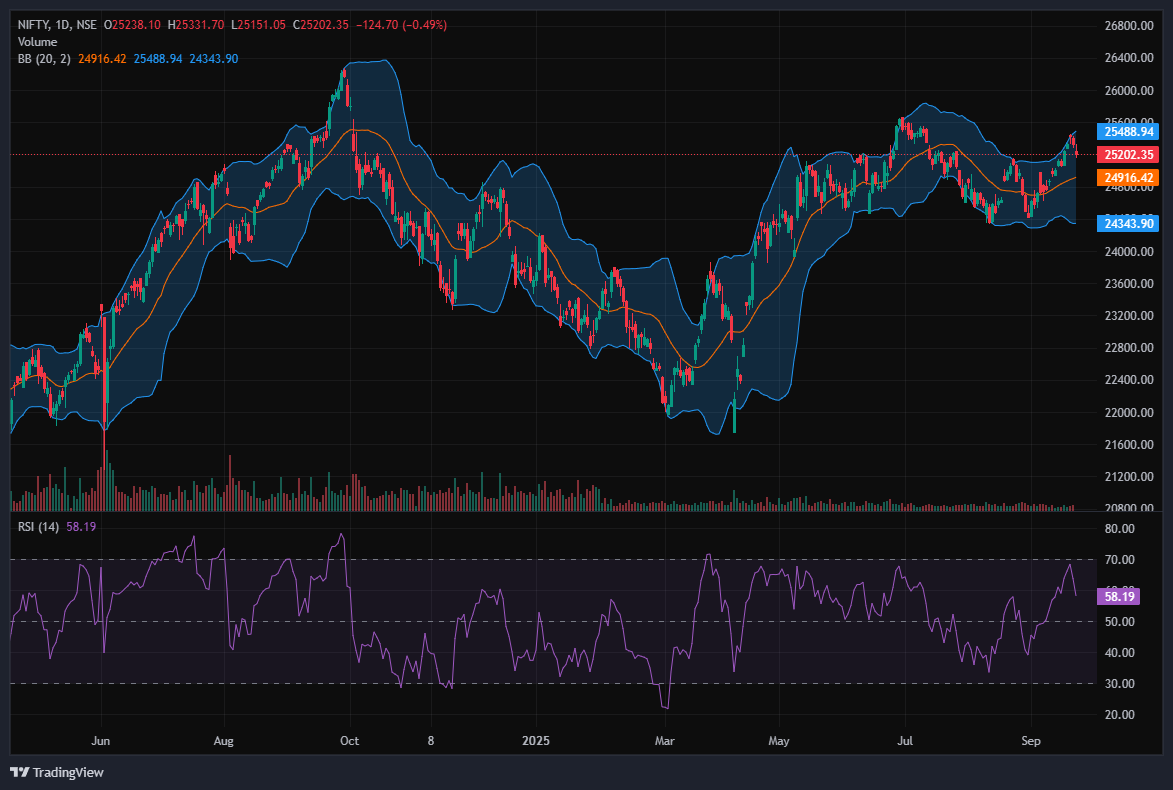
RSI (Daily): The Nifty 50’s RSI stood at 58.18, which is well below the overbought zone of 70, indicating a bullish yet cautious sentiment.
Bollinger Bands (Daily): The index is trading in the upper band of its Bollinger Band range above the middle band (Simple Moving Average). Its position in the upper range, along with solid support around the 25,150 level in Monday’s session. A sustained move above the middle band signals a bullish sentiment, while a drop back toward the lower band may reinforce bearish sentiment.
Volume Analysis: Monday’s trading session had average volumes, which stood at 254.51 Mn.
Derivatives Data: Options OI indicates strong Put writing at 25,200, following 25,000, establishing it as a firm support zone. On the upside, a significant Call OI buildup at 25,300 and 25,500 suggests a potential resistance supply. PCR (Put/Call Ratio) stands at 0.5717 (<1), leaning towards bullish sentiment.

Bank Nifty
(In this analysis, we have used 20/50/100/200 EMAs, where 20 EMA (Red), 50 EMA (Orange), 100 EMA (Light Blue), 200 EMA (Dark Blue)).
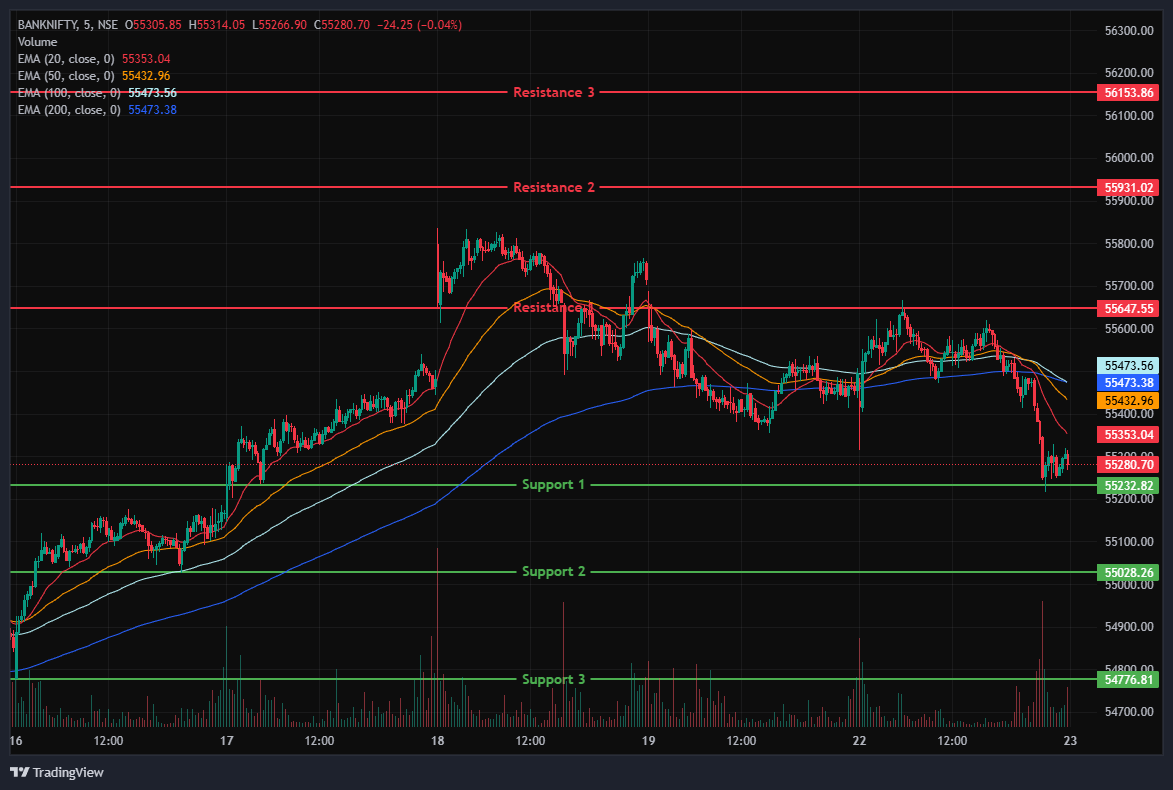
The Bank Nifty Index also started the session on a negative note at 55,429.3 on Monday, down by 29.55 points from Friday’s closing of 55,458.85. The index was trading between the range of 55,600 and 55,500 in the morning session, indicating volatility. In addition, the index was trading above the EMAs of 100/200 but remained below the 20/50 EMAs in the 15-minute time frame.
In the afternoon session, the Index fell further from the day’s high and traded around the range of 55,250 and 55,500, ending in red. During the afternoon session, Bank Nifty closed below all the EMAs of 20/50/100 and above the 200 EMA in the 15-minute time frame. Bank Nifty immediate resistance levels are R1 (55,648), R2 (55,931), and R3 (56,154), while immediate support levels are S1 (55,233), S2 (55,028), and S3 (54,777).
The Bank Nifty index had peaked at 55,666.35 and made a day’s low at 55,215.6. Finally, it had closed in red at 55,284.75, closed below the 55,300 level, losing 174.1 points or 0.31%. The Relative Strength Index (RSI) stood at 54.47 well below the overbought zone of 70 in the daily time frame, and Bank Nifty closed above all four EMAs of 20/50/100/200 in the daily time frame.
Sensex
(In this analysis, we have used 20/50/100/200 EMAs, where 20 EMA (Red), 50 EMA (Orange), 100 EMA (Light Blue), 200 EMA (Dark Blue)).
To view other technical reports, click here
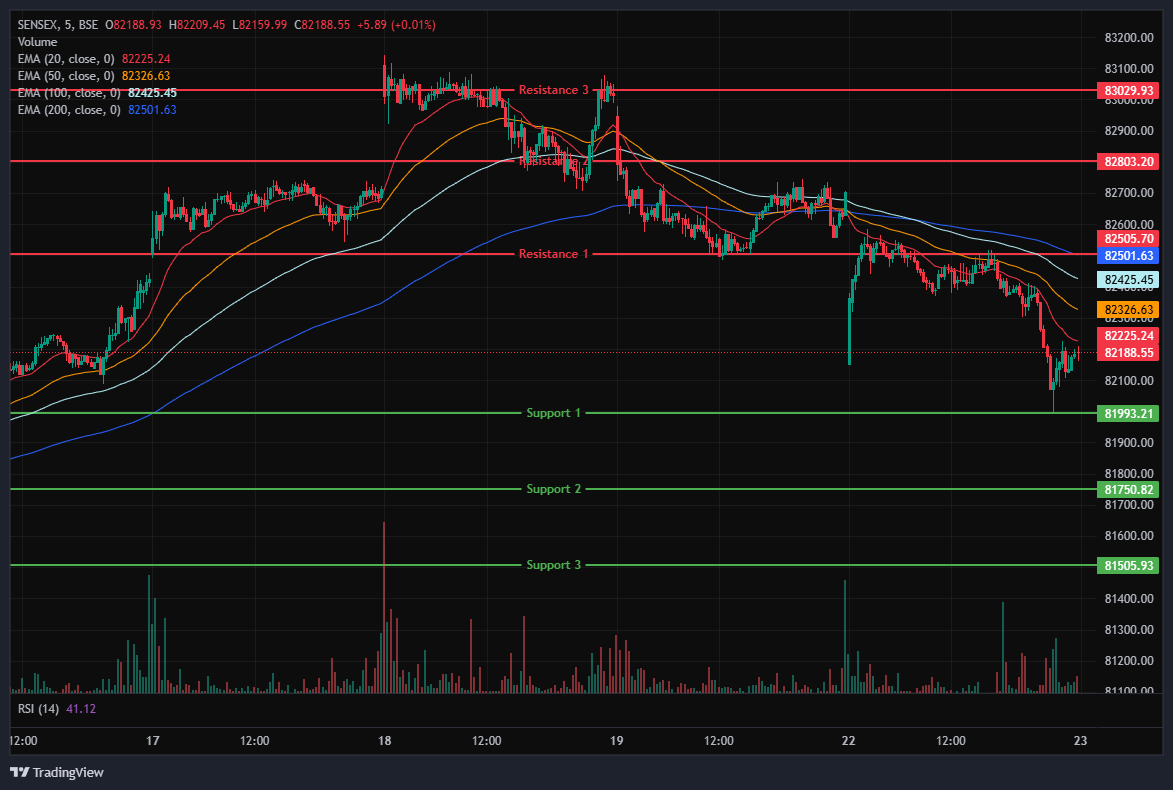
The BSE Sensex Index also opened on a negative note at 82,151.07 on Monday, down by 475.22 points from Friday’s closing of 82,626.23. The index traded in a similar pattern as the Nifty 50, and was trading between 82,400 and 82,500 range throughout the morning session’s 15-minute time frame, above the 200 EMA but below the 20/50/100 EMAs.
In the afternoon session, the Index declined further, marking a day’s low at 81,997.29 and was trading between the 82,100 and 82,400 level, maintaining its overall bearish trend and closing below all four EMAs of 20/50/100/200 in the 15-minute time frame. BSE Sensex immediate resistance levels are R1 (82,506), R2 (82,803), and R3 (83,030), while immediate support levels are S1 (81,993), S2 (81,751), and S3 (81,506).
The BSE Sensex index had peaked at 82,583.16 and made a day’s low at 81,997.3. Finally, it closed at 82,159.97 in red, losing 466.26 points or 0.56%. The Relative Strength Index (RSI) stood at 56.4 (below the overbought zone of 70) in the daily time frame, and the BSE Sensex closed above all four EMAs of 20/50/100/200 in the daily time frame.
India VIX
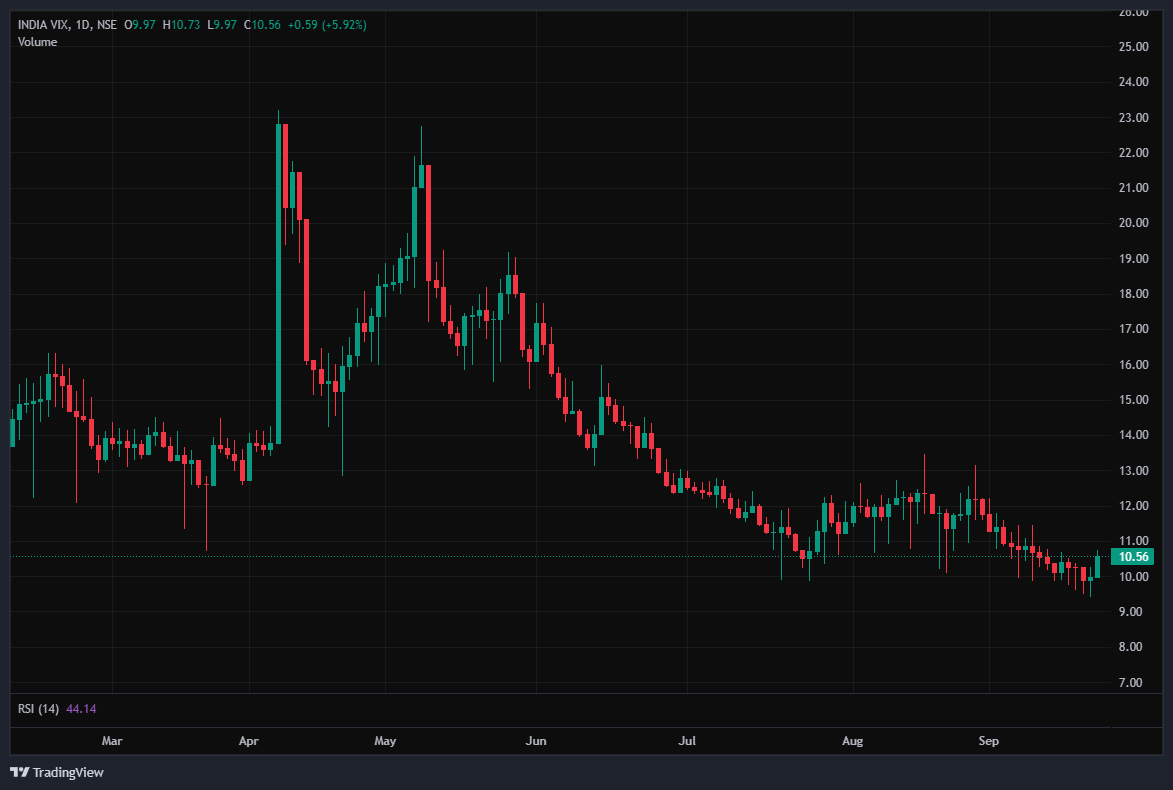
The India VIX increased by 0.59 points or 5.92%, from 9.97 to 10.56 during Monday’s session. An increase in the India VIX typically indicates higher price volatility in the stock market, suggesting a less stable market environment. However, a stable market environment and minimal volatility are anticipated when the India vix is below 15.
Market Recap on 22nd of September 2025
On Monday, the Nifty 50 opened on a bearish note at 25,238.10, falling 88.95 points from its previous close of 25,327.05. It touched an intraday low of 25,151.05 before settling at 25,202.35, down 124.70 points or 0.49%. Technically, the index remained above all four key exponential moving averages (20, 50, 100, and 200-day) on the daily chart. The BSE Sensex followed a similar trend, opening at 82,151.07, lower by 475.16 points from its previous close of 82,626.23. It ended the session at 82,159.97, registering a loss of 466.26 points or 0.56%.
Momentum indicators showed moderate strength, with the RSI for Nifty 50 at 58.19 and for Sensex at 56.37, both staying below the overbought mark of 70. The Bank Nifty Index also closed in negative territory, declining 174.10 points or 0.31% to finish at 55,284.75. The drop followed the US government’s announcement on 20 September 2025 of an increase in the H1-B visa cost to USD 100,000, sparking confusion and concern among skilled workers.
Among sectoral indices, the Nifty Energy Index was the top performer, gaining 246.90 points or 0.69% to close at 35,992.65. Adani Power Ltd rallied 20.00% after a 5-for-1 stock split and partial SEBI clearance from allegations of stock manipulation and accounting fraud. Other Adani group stocks, including Adani Total Gas Ltd, Adani Green Energy Ltd, and Adani Energy Solutions Ltd, also surged by up to 19.85%.
The Nifty Media Index added 7.85 points or 0.48% to close at Rs 1,627.30. Top gainers included Zee Entertainment Enterprises Ltd and Nazara Technologies Ltd, which rose up to 2.97%. The Nifty Metal Index also posted modest gains, ending at Rs 10,029.10, up 39.20 points or 0.39%.
On the downside, the Nifty IT Index was the weakest sector, closing at 35,500.15, down 1,078.10 points or 2.95%. Mphasis Ltd declined 4.72%, while LTIMindtree Ltd and Coforge Ltd fell by up to 4.53%. The Nifty Pharma Index also ended lower at 22,365.75, down 320.85 points or 1.41%. Notable laggards included Glenmark Pharmaceuticals Ltd, Granules India Ltd, Laurus Labs Ltd, and Ipca Laboratories Ltd, which dropped by up to 3.23%. The Nifty Smallcap 50 Index closed at 8,796.75, losing 112.95 points or 1.27%.
Asian markets were largely positive on Monday. Japan’s Nikkei 225 Index advanced 487.19 points or 1.07%, closing at 45,533.00. China’s Shanghai Composite Index gained 8.49 points or 0.22%, finishing at 3,828.58. South Korea’s KOSPI Index ended higher at 3,468.65, up 23.41 points or 0.67%, while Hong Kong’s Hang Seng Index dropped 175.10 points or 0.66% to close at 26,370.00. As of 4:48 p.m. IST, US Dow Jones Futures were trading at 46,171.14, down 141.15 points or 0.31%.
Trade Setup Summary
The Nifty 50 opened on a negative note at 25,238.1 on Monday and ended the session in the red below the 25,250 level at 25,202.35. A break below 25,149 could trigger further selling towards 25,061, while breaking the next resistance level of 25,324 could trigger bullishness towards the 25,451 level.
Bank Nifty also started the session on a negative note at 55,429.3 and ended the session in the red at 55,284.75, below the 55,300 level. A break below 55,233 could trigger further selling towards 55,028, while breaking the next resistance level of 55,648 could trigger bullishness towards the 55,931 level.
Sensex also opened on a negative note at 82,151.07 and ended the session in the red at 82,159.97, below the 82,200 level. A break below 81,993 could trigger further selling towards 81,751, while breaking the next resistance level of 82,506 could lead towards the 82,803 level.Given the ongoing volatility and mixed sentiments, it’s advisable to avoid aggressive positions and wait for clear directional moves above resistance or below support.
Traders should consider these key support and resistance levels when entering long or short positions following the price break from these critical levels. Additionally, traders can combine moving averages to identify more accurate entry and exit points.
Disclaimer

The views and investment tips expressed by investment experts/broking houses/rating agencies on tradebrains.in are their own, and not that of the website or its management. Investing in equities poses a risk of financial losses. Investors must therefore exercise due caution while investing or trading in stocks. Trade Brains Technologies Private Limited or the author are not liable for any losses caused as a result of the decision based on this article. Please consult your investment advisor before investing.
About: Trade Brains Portal is a stock analysis platform. Its trade name is Dailyraven Technologies Private Limited, and its SEBI-registered research analyst registration number is INH000015729.
Investments in securities are subject to market risks. Read all the related documents carefully before investing.
Registration granted by SEBI and certification from NISM in no way guarantee performance of the intermediary or provide any assurance of returns to investors.

