Markets opened on a cautious note and struggled to find direction throughout the session, reflecting a mix of volatility and sector-specific movements. Despite early strength, major indices like the Nifty 50 and Sensex ended in the red, indicating mild profit booking and a lack of strong bullish momentum. Technical indicators suggested that the broader trend remains intact, but with momentum slowing, investors appeared wary ahead of key events and expiry-driven fluctuations. The decline in benchmark indices was largely attributed to pressure from FMCG and realty stocks, which underperformed amid broader market weakness.
On the other hand, especially among PSU banks, metal, and auto stocks, which attracted steady buying interest. The strength in the Bank Nifty and sectoral gainers pointed to continued investor confidence in cyclical and value-driven segments. Global cues remained mixed, with Asian indices showing divergent trends and U.S. futures indicating a flat to mildly positive opening. Overall, market sentiment remained moderately cautious, with traders opting for selective bets rather than broad-based participation.
In this overview, we will analyse the key technical levels and trend directions for Nifty and BSE Sensex to monitor in the upcoming trading sessions. All the charts mentioned below are based on the 5-minute timeframe.
Nifty 50
(In this analysis, we have used 20/50/100/200 EMAs, where 20 EMA (Red), 50 EMA (Orange), 100 EMA (Light Blue), and 200 EMA (Dark Blue)).
To view other technical reports, click here
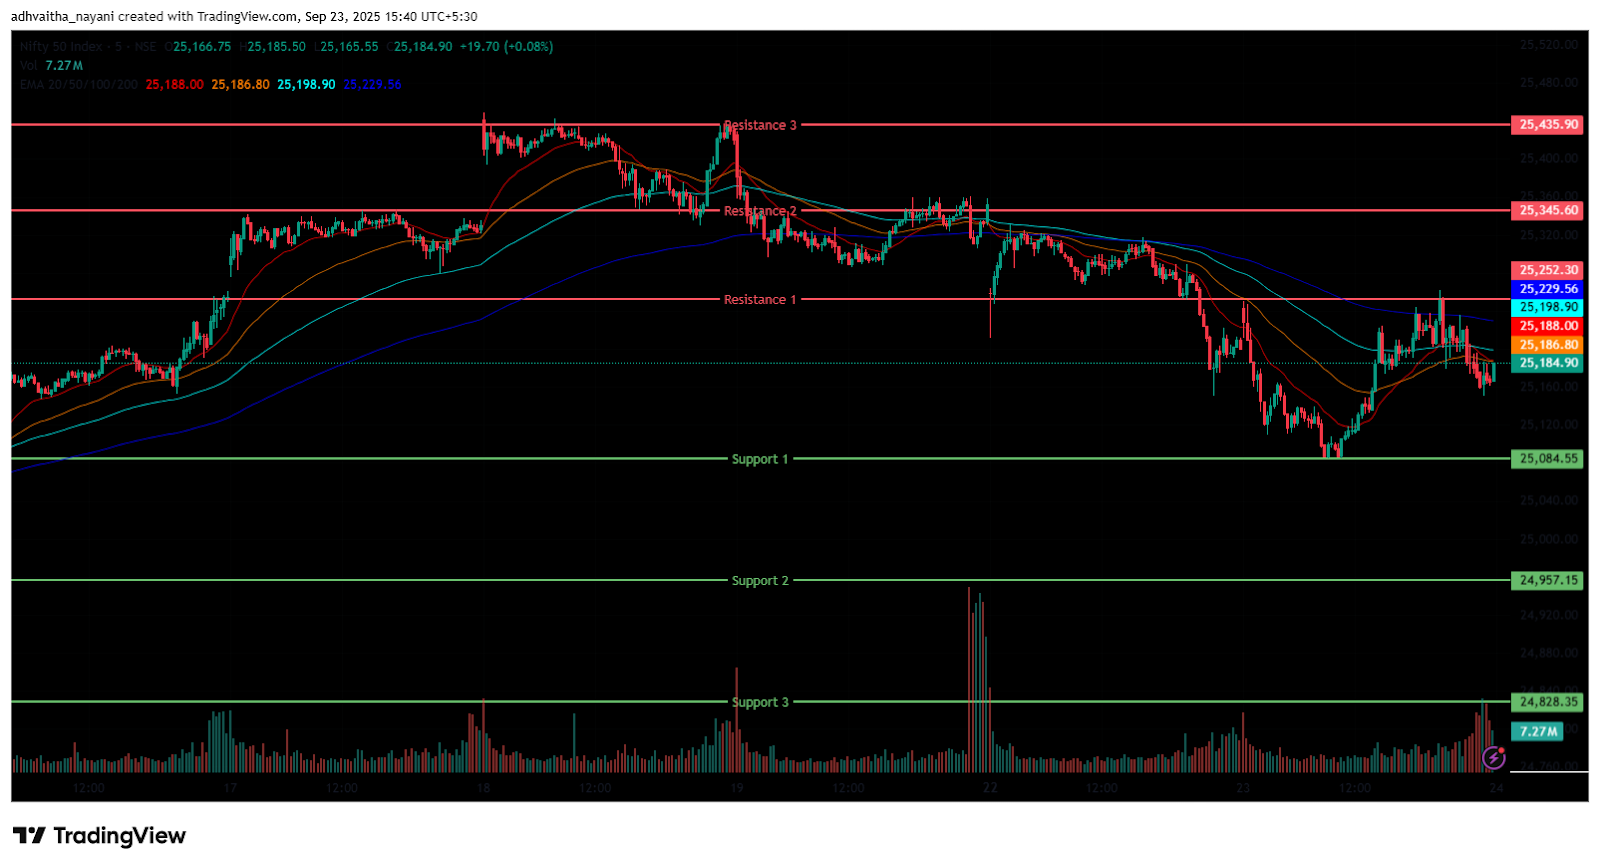
The Nifty 50 Index opened on a positive note at 25,209 on Tuesday, up by 6.65 points from Monday’s closing of 25,202.35. With a bullish start to the day, the index had a volatile morning session, trading between 25,084 to 25,251 range. Additionally, the Index stood below the EMAs of 50/100/200 but remained above the 20 EMA in the 15-minute time frame during the morning session.
The index surged as high as the 25,262 mark, reaching its day high in the afternoon session and traded below its opening level, between the range of 25,151 and 25,262. During the afternoon session, the Nifty 50 traded below all four EMAs of 20/50/100/200 in the 15-minute time frame. Nifty’s immediate resistance levels are R1 (25,252), R2 (25,346), and R3 (25,436), while immediate support levels are S1 (25,085), S2 (24,957), and S3 (24,828).
The Nifty index had reached a day’s high at 25,261.90 and saw a day’s low at 25,084.65. Finally, it had closed at 25,169.50, in red below the 25,200 level, losing 32.85 points, or 0.13%. The Nifty 50 closed above all four EMAs of 20/50/100/200 EMAs in the daily time frame.
Momentum Indicators
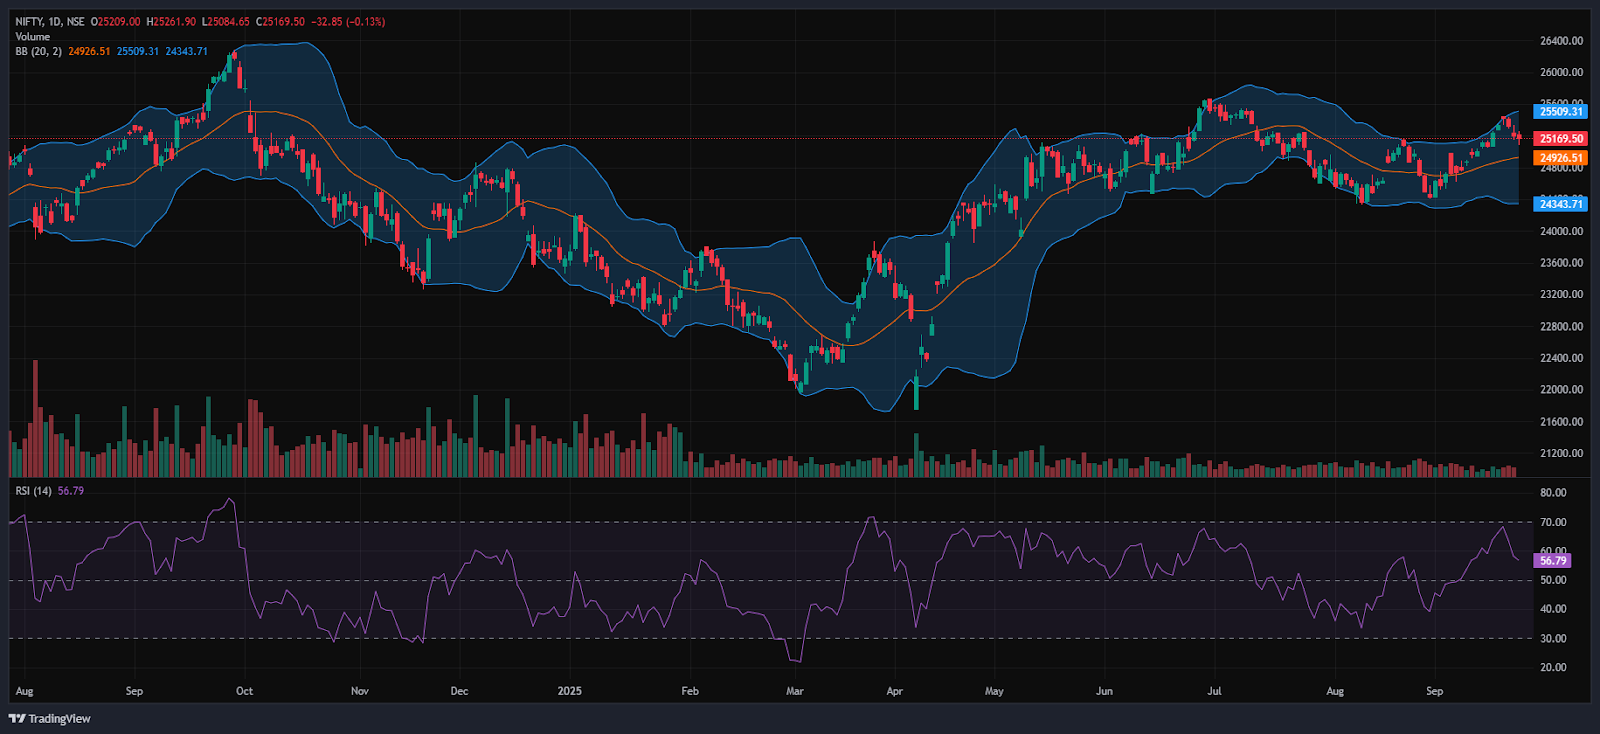
RSI (Daily): The Nifty 50’s RSI stood at 56.79, which is well below the overbought zone of 70, indicating a bullish sentiment.
Bollinger Bands (Daily): The index is trading in the upper band of its Bollinger Band range above the middle band (Simple Moving Average). Its position in the upper range, along with solid resistance around the 25,200 level in Tuesday’s session. A sustained move above the middle band signals a bullish sentiment, while a drop back toward the lower band may reinforce bearish sentiment.
Volume Analysis: Tuesday’s trading session had average volumes, which stood at 299.2 Mn.
Derivatives Data: Options OI indicates strong Put writing at 25,150, following 25,100, establishing it as a firm support zone. On the upside, a significant Call OI buildup at 25,200 and 25,250 suggests a potential resistance supply. PCR (Put/Call Ratio) stands at 0.7652 (<1), leaning towards bullish sentiment and the Short Buildup signals a price to fall, with an overall mixed outlook for the next trading session.
Bank Nifty
(In this analysis, we have used 20/50/100/200 EMAs, where 20 EMA (Red), 50 EMA (Orange), 100 EMA (Light Blue), and 200 EMA (Dark Blue)).
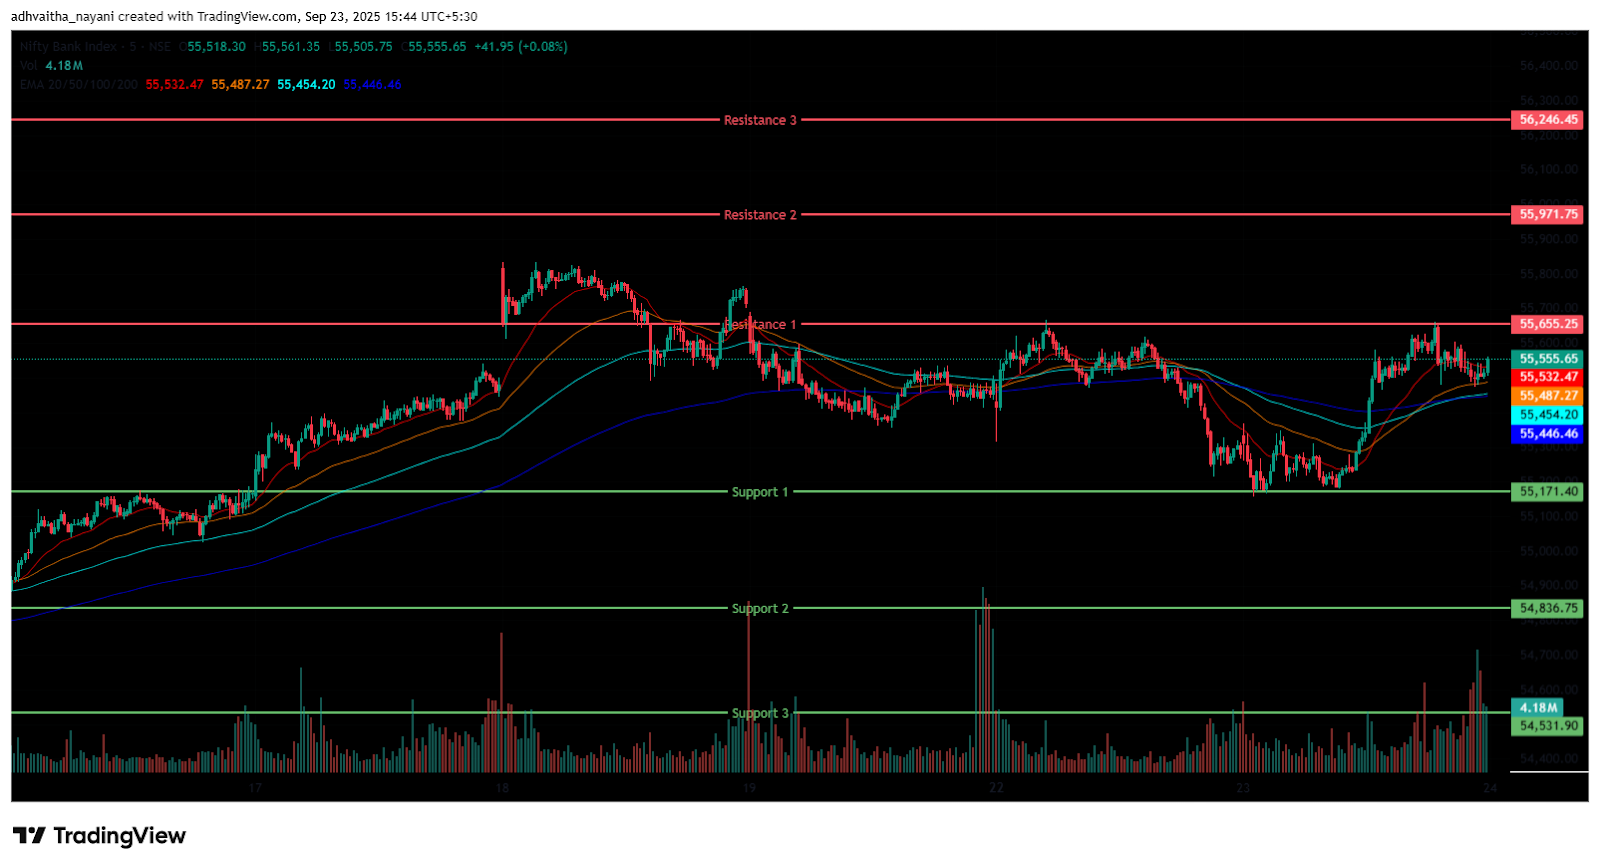
The Bank Nifty Index also started the session on a negative note at 55,248.70 on Tuesday, down by 36.05 points from Monday’s closing of 55,284.75. The index was trading between the range of 55,159 and 55,581 in the morning session, indicating volatility. In addition, the index was trading above all four EMAs of 20/50/100/200 in the 15-minute time frame.
In the afternoon session, the Index recovered from the low and traded around the range of 55,474 and 55,662, ending in green. During the afternoon session, Bank Nifty closed above all the EMAs of 20/50/100/200 in the 15-minute time frame. Bank Nifty immediate resistance levels are R1 (55,655), R2 (55,972), and R3 (56,246), while immediate support levels are S1 (55,171), S2 (54,837), and S3 (54,532).
The Bank Nifty index had peaked at 55,662.00 and made a day’s low at 55,159.00. Finally, it had closed in green at 55,509.75, closing above the 55,500 level, gaining 225 points or 0.41%. The Relative Strength Index (RSI) stood at 57.64 well below the overbought zone of 70 in the daily time frame, and Bank Nifty closed above all four EMAs of 20/50/100/200 in the daily time frame.
Sensex
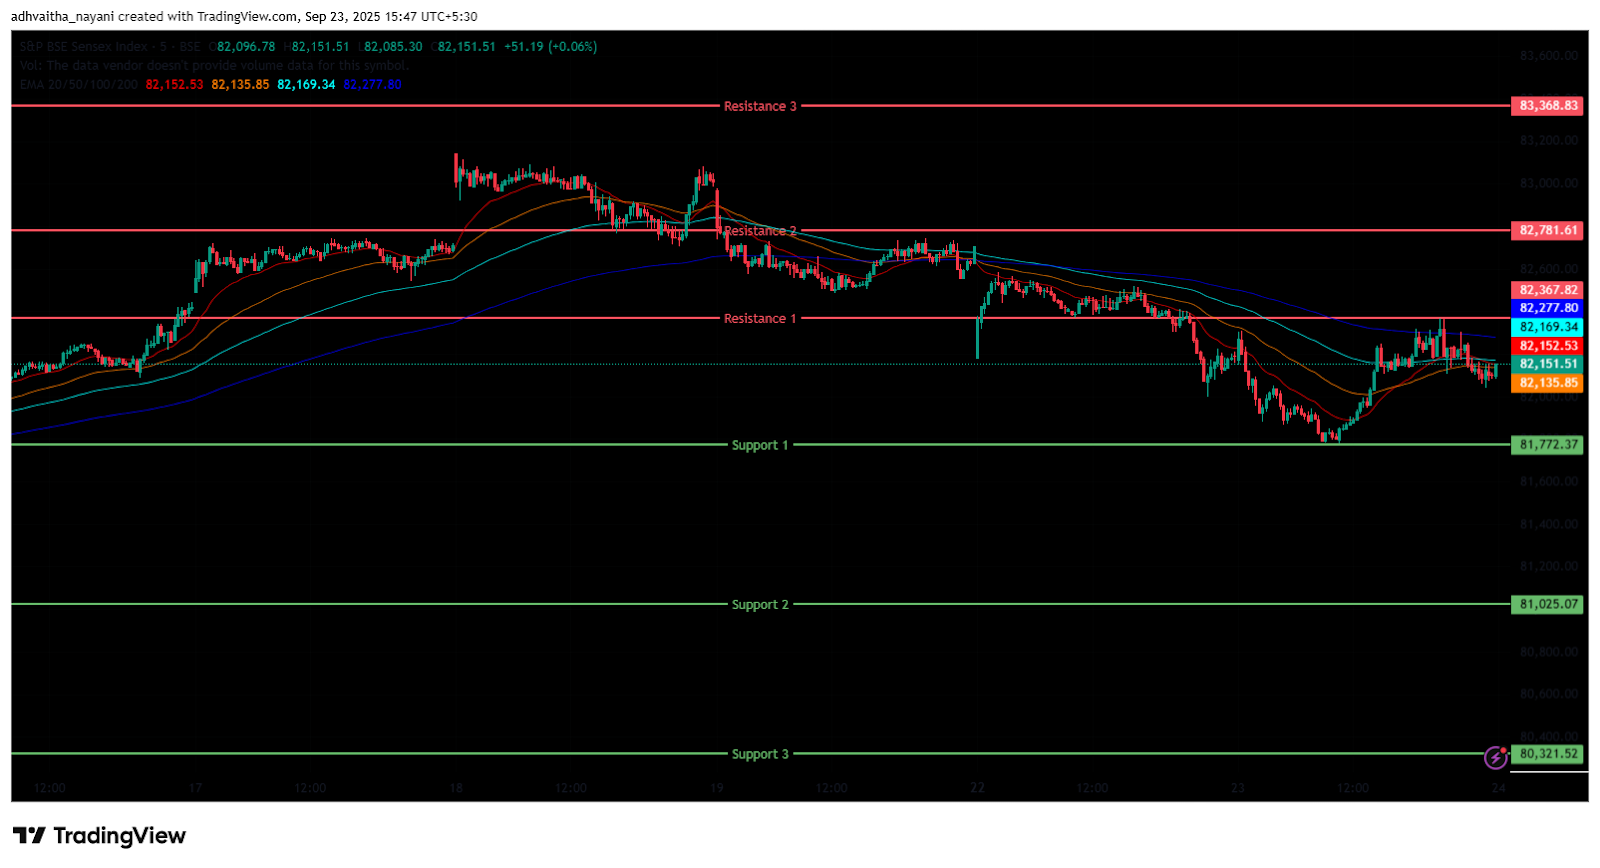
(In this analysis, we have used 20/50/100/200 EMAs, where 20 EMA (Red), 50 EMA (Orange), 100 EMA (Light Blue), and 200 EMA (Dark Blue)).
To view other technical reports, click here
The BSE Sensex Index also opened on a negative note at 82,147.37 on Tuesday, down by 12.6 points from Monday’s closing of 82,159.97. The index traded in a similar pattern as the Nifty 50, and was trading between 81,750 to 82,300 range throughout the morning session’s 15-minute time frame, below the 50/100/200 EMAs but above the 20 EMA.
In the afternoon session, the Index recovered from the day’s low, marking a day’s high at 82,370 and was trading between the 82,000 and 82,400 level, maintaining its overall bearish trend and closing below the EMAs of 50/100/200 but above the 20 EMA in the 15-minute time frame. BSE Sensex immediate resistance levels are R1 (82,368), R2 (82,782), and R3 (83,369), while immediate support levels are S1 (81,772), S2 (81,025), and S3 (80,321).
The BSE Sensex index had peaked at 82,370.38 and made a day’s low at 81,776.53. Finally, it closed at 82,102.10 in red, losing 57.87 points or 0.07%. The Relative Strength Index (RSI) stood at 55.66 (below the overbought zone of 70) in the daily time frame, and the BSE Sensex closed above all four EMAs of 20/50/100/200 in the daily time frame.
India VIX
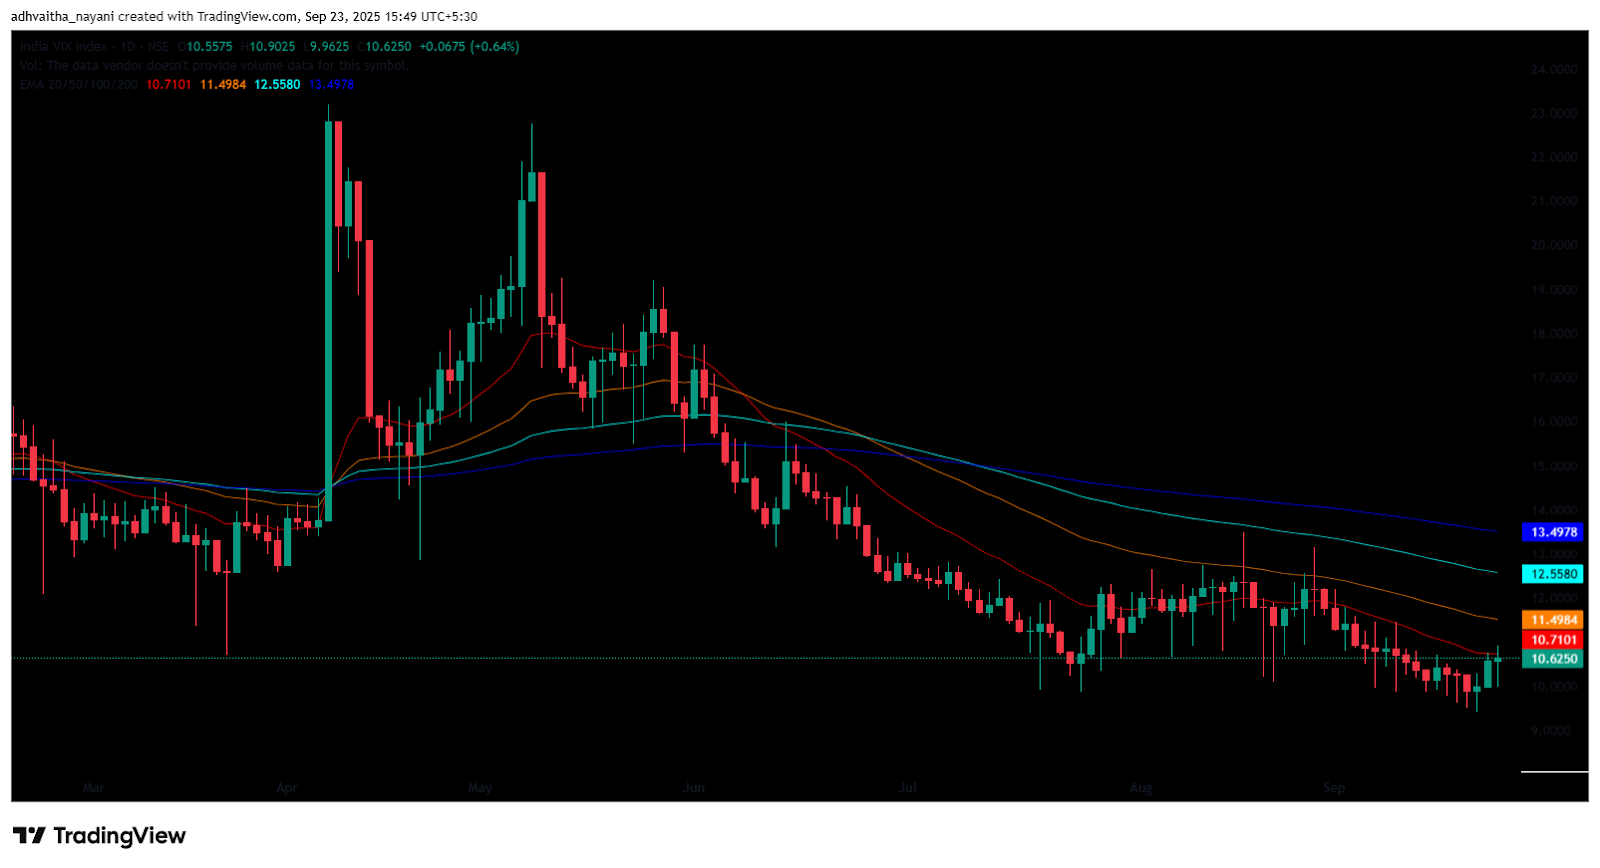
The India VIX increased by 0.068 points or 0.64%, from 10.56 to 10.62 during Tuesday’s session. An increase in the India VIX typically indicates higher price volatility in the stock market, suggesting a less stable market environment. However, a stable market environment and minimal volatility are anticipated when the India vix is below 15.
Market Recap on the 23rd of September 2025
The Nifty 50 opened Tuesday’s session on a flat note at 25,209, registering a modest uptick of 6.65 points from its previous close of 25,202.35. During intraday trade, the index slipped to a low of 25,084.65 before ending the day at 25,169.5, marking a decline of 32.85 points or 0.13%. Despite the dip, the Nifty remained comfortably above its 20, 50, 100, and 200-day exponential moving averages. Echoing this cautious sentiment, the BSE Sensex opened slightly lower at 82,147.37, down by 12.26 points, and settled at 82,102.1, a loss of 57.87 points or 0.07%.
Technical indicators suggested steady momentum, with the Nifty’s RSI at 56.79 and the Sensex’s at 55.66, both well below the overbought threshold of 70. In contrast, the Bank Nifty ended in the green, gaining 225 points or 0.41% to close at 55,509.75, buoyed by robust buying interest in PSU banks. Meanwhile, broader indices extended their downward trend for the third consecutive session amid elevated volatility on the weekly expiry day.
Among sectoral performers, the Nifty PSU Bank Index emerged as the top gainer, climbing 80.15 points or 1.1% to finish at 7,451.1. Canara Bank surged 2.6%, while other PSU banking stocks like State Bank of India, Union Bank of India, and Bank of Baroda posted gains of up to 1.8%.
The Nifty Metal Index also delivered a strong performance, rising by 99.95 points or 1% to close at 10,129. Hindustan Copper Ltd led the gains with a 3.7% rise, followed by Jindal Steel Ltd, JSW Steel Ltd, and Adani Enterprises, each advancing up to 3%. The Nifty Auto Index posted modest gains as well, adding 167.65 points or 0.6% to settle at 27,322.
On the downside, the Nifty FMCG Index was the worst-performing sector of the day, plunging 725.2 points or 1.3% to end at 55,281.55. Major draggers included Godrej Consumer Products Ltd, which fell 3.3%, while Radico Khaitan Ltd and Britannia Industries Ltd dropped over 2.3% each. The Nifty Realty Index also slipped, ending 8.2 points or 0.9% lower at 913.35, with DLF Ltd, Anant Raj Ltd, and Sobha Ltd losing as much as 1.9%. The Nifty IT Index remained under pressure too, shedding 251 points or 0.7% to close at 35,249.
Asian markets closed on a mixed note on Tuesday. Japan’s Nikkei 225 surged 447.85 points or 0.99% to finish at 45,493.66. China’s Shanghai Composite Index eased 6.74 points or 0.18% to close at 3,821.83. South Korea’s KOSPI added 17.54 points or 0.51%, ending at 3,456.19. Conversely, Hong Kong’s Hang Seng Index declined by 185.02 points or 0.7%, settling at 26,159.12. As of 4:20 p.m. IST, U.S. Dow Jones Futures were trading slightly higher by 12 points or 0.026%, at 46,736.
Trade Setup Summary
The Nifty 50 opened on a positive note at 25,209.00 on Tuesday but ended the session in the red below the 25,200 level at 25,169.50. A break below 25,085 could trigger further selling towards 24,957 while breaking the next resistance level of 25,252 could trigger bullishness towards the 25,346 level.
Bank Nifty started the session on a negative note at 55,248.70 but ended the session in the green at 55,509.75, above the 55,500 level. A break below 55,171 could trigger further selling towards 54,837, while breaking the next resistance level of 55,655 could trigger bullishness towards the 55,972 level.
Sensex also opened on a negative note at 82,147.37 and ended the session in the red at 82,102.10, below the 82,200 level. A break below 81,772 could trigger further selling towards 81,025, while breaking the next resistance level of 82,368 could lead towards the 82,782 level.
Given the ongoing volatility and mixed sentiments, it’s advisable to avoid aggressive positions and wait for clear directional moves above resistance or below support. Traders should consider these key support and resistance levels when entering long or short positions following the price break from these critical levels. Additionally, traders can combine moving averages to identify more accurate entry and exit points.
Disclaimer

The views and investment tips expressed by investment experts/broking houses/rating agencies on tradebrains.in are their own, and not that of the website or its management. Investing in equities poses a risk of financial losses. Investors must therefore exercise due caution while investing or trading in stocks. Trade Brains Technologies Private Limited or the author are not liable for any losses caused as a result of the decision based on this article. Please consult your investment advisor before investing.
About: Trade Brains Portal is a stock analysis platform. Its trade name is Dailyraven Technologies Private Limited, and its SEBI-registered research analyst registration number is INH000015729.
Investments in securities are subject to market risks. Read all the related documents carefully before investing.
Registration granted by SEBI and certification from NISM in no way guarantee performance of the intermediary or provide any assurance of returns to investors.
