
The MACD (Moving Average Convergence Divergence) is a technical analysis tool that shows the relationship between two moving averages of a stock’s price, typically the 12-day and 26-day EMAs. It consists of the MACD line, the Signal line, and a histogram, helping identify trends and momentum.
This part of the indicator shows how strong the price movement is and can give an early warning to prepare for a change. The higher or deeper the lines, the stronger the price movement.
When the lines are above the zero horizontal, the market can be said to be bullish, and when they are below, we are in bearish mode. A MACD crossover occurs when the MACD line crosses above (bullish) or below (bearish) the Signal line, signaling potential buy or sell opportunities based on trend changes.
List of Stocks with MACD Crossover to look out for
Waaree Energies Ltd
Waaree Energies Ltd is India’s largest manufacturer of solar photovoltaic modules company operates multiple manufacturing plants in India and internationally, including the U.S. They provide end-to-end solar solutions such as EPC and operations & maintenance services. It has been growing rapidly with strong revenues and a large order book in the renewable energy sector.
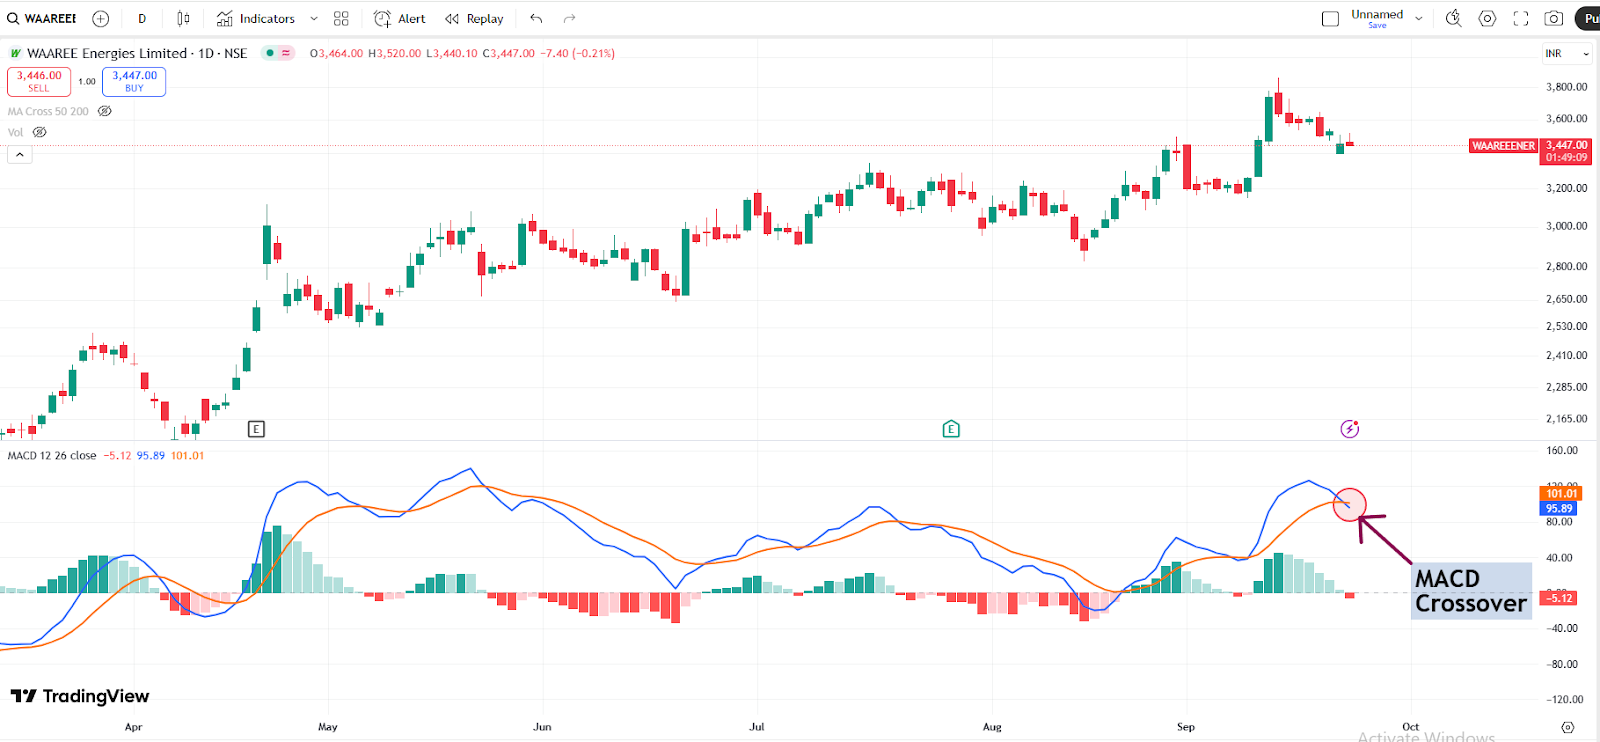
A bearish MACD crossover was seen in the Waaree Energies as the MACD line crossed below the signal line, signaling potential downward momentum. This technical pattern is considered a sell signal and may indicate the start of a new downtrend, prompting traders to be cautious or consider exiting long positions.
SKF India Ltd
SKF India Ltd is a subsidiary of the global SKF Group, specializing in bearings, seals, lubrication, and condition monitoring products. It serves the automotive, industrial, and aerospace sectors across India. SKF India focuses on innovative engineering solutions to improve performance and energy efficiency, supporting India’s industrial growth with high-quality products.
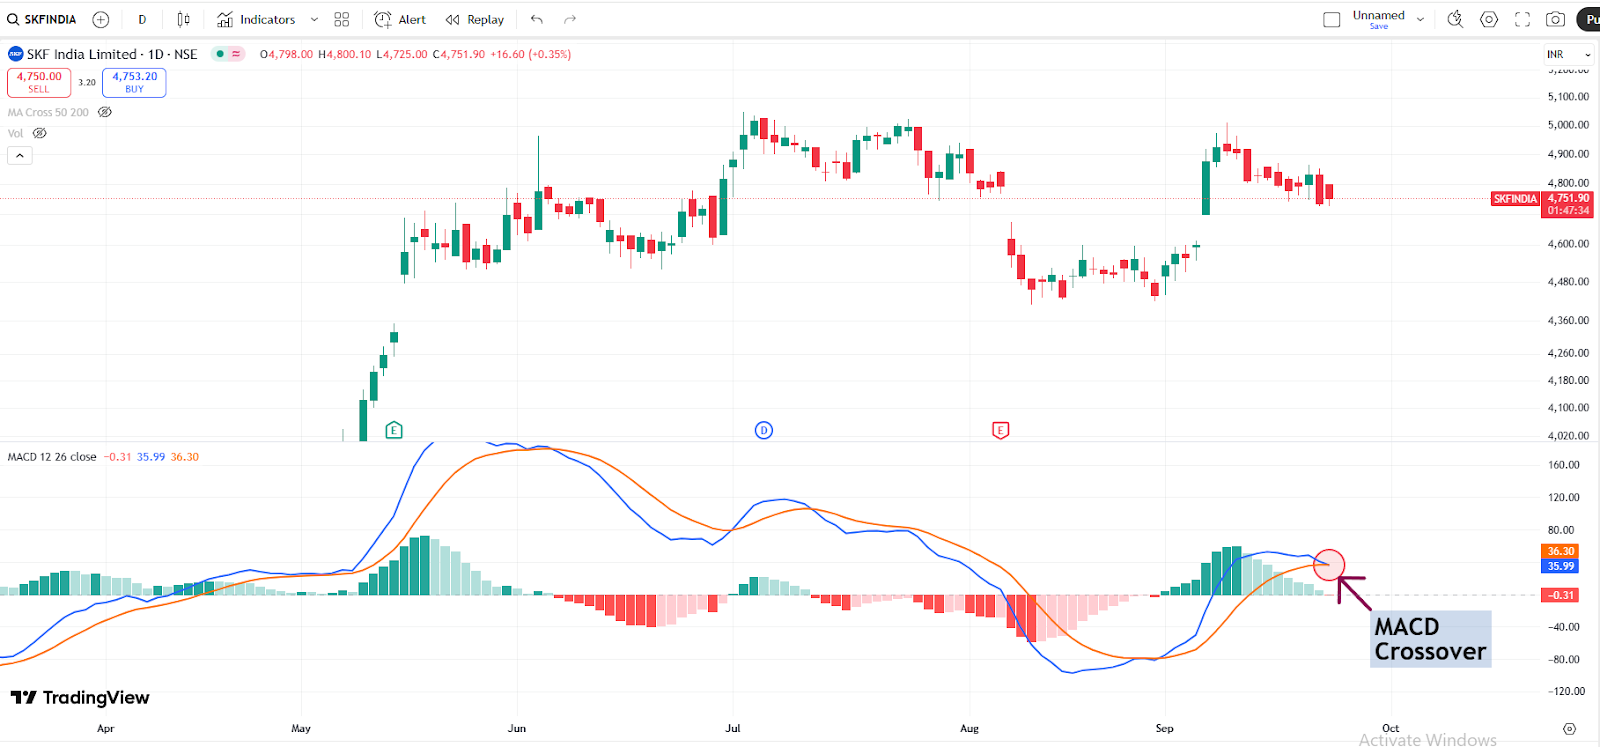
A bearish MACD crossover was seen in the SKF India as the MACD line crossed below the signal line, signaling potential downward momentum. This technical pattern is considered a sell signal and may indicate the start of a new downtrend, prompting traders to be cautious or consider exiting long positions.
Zydus Lifesciences Ltd
Zydus Lifesciences Ltd, formerly Cadila Healthcare, is a major Indian pharmaceutical company headquartered in Ahmedabad. It develops generics, biosimilars, vaccines, and wellness products with manufacturing units in India, the USA, and Brazil. The company recently expanded into oncology drugs and biologics manufacturing, strengthening its global presence.
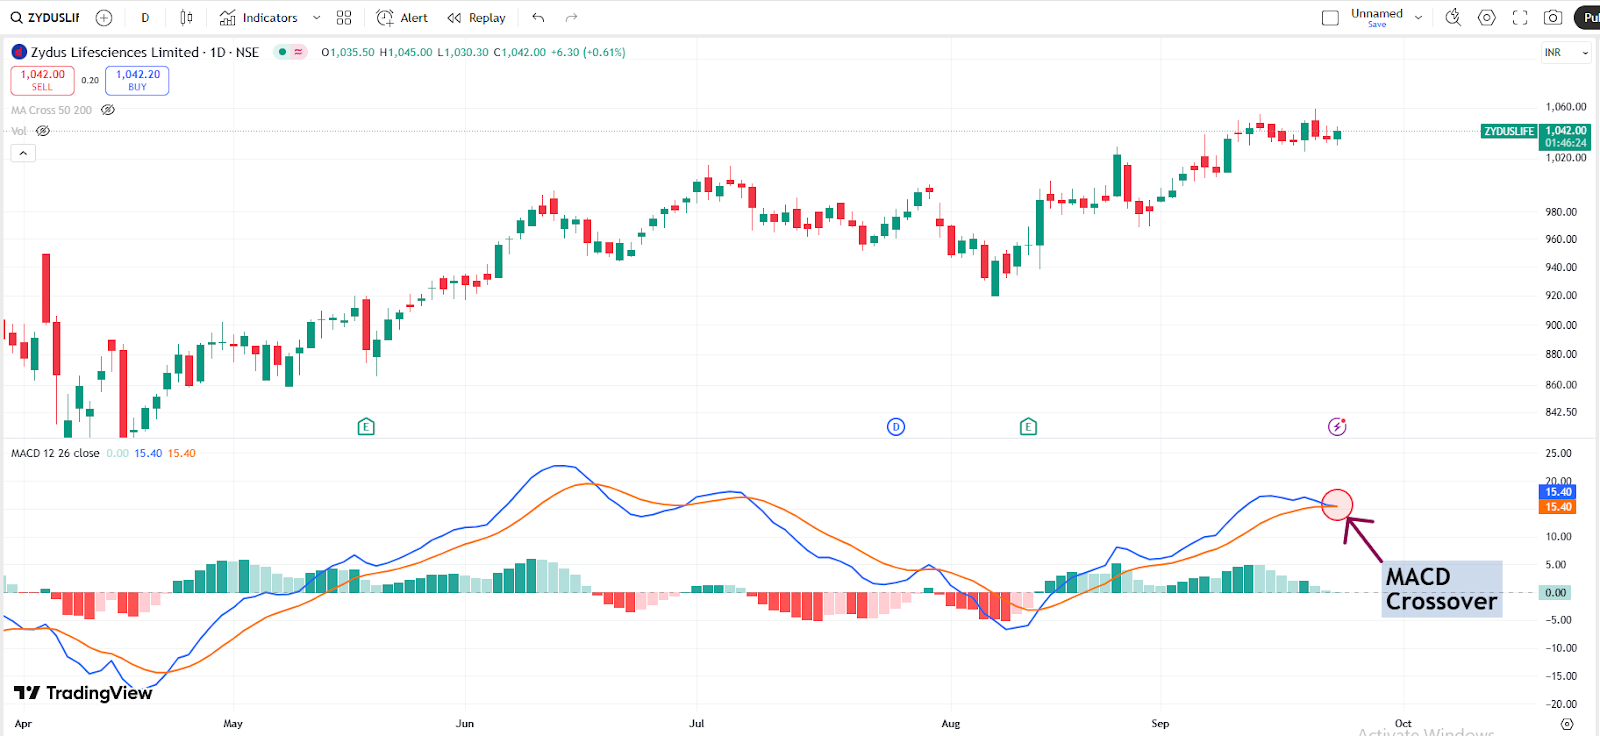
A bearish MACD crossover was seen in Zydus Lifesciences as the MACD line crossed below the signal line, signaling potential downward momentum. This technical pattern is considered a sell signal and may indicate the start of a new downtrend, prompting traders to be cautious or consider exiting long positions.
CG Power & Industrial Solutions Ltd
CG Power & Industrial Solutions Ltd, formerly Crompton Greaves, is an Indian multinational that manufactures electrical equipment like transformers, motors, and railway signaling systems. It is now part of the Murugappa Group, and the company focuses on innovative solutions for power generation, transmission, and infrastructure development in India.
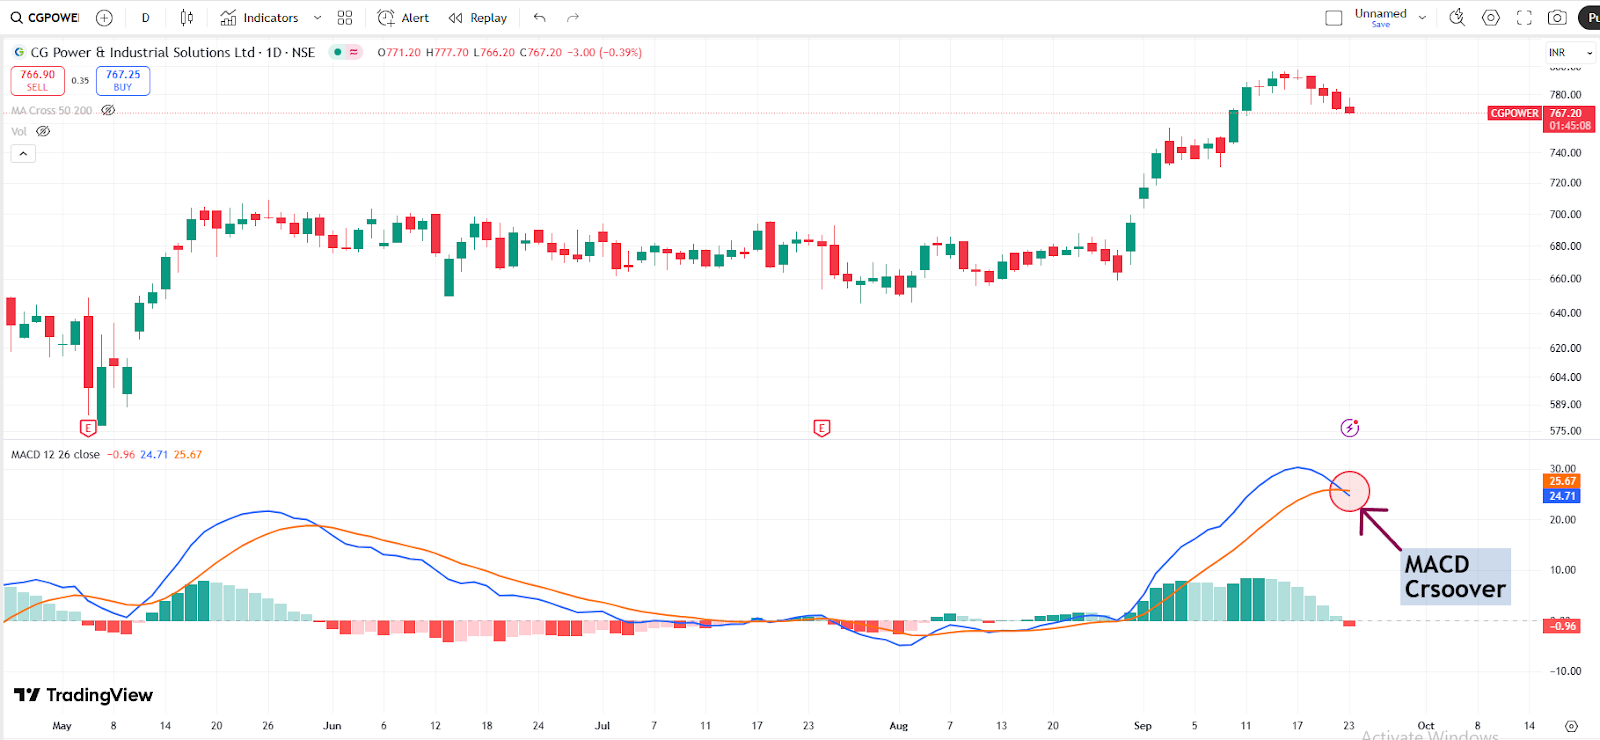
A bearish MACD crossover was seen in CG Power & Industrial Solutions as the MACD line crossed below the signal line, signaling potential downward momentum. This technical pattern is considered a sell signal and may indicate the start of a new downtrend, prompting traders to be cautious or consider exiting long positions.
Premier Energies Ltd
Premier Energies Ltd is an Indian manufacturer of solar cells and modules, catering to the growing renewable energy market. The company is backward integrated, enabling control over quality and costs, and holds a strong position in India’s solar industry. Premier Energies continues to expand capacity and explore new markets for its solar products.
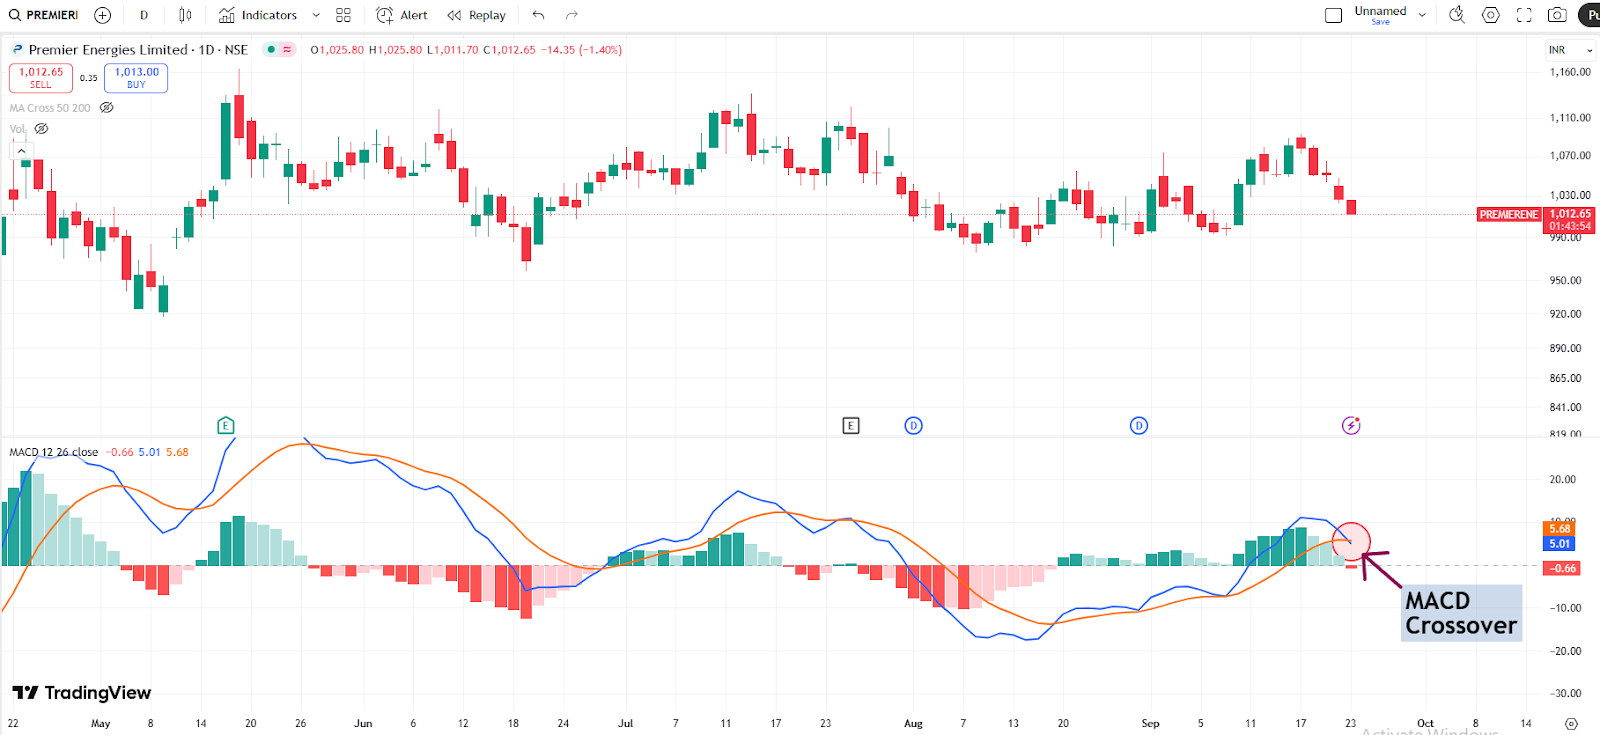
A bearish MACD crossover was seen in Premier Energies as the MACD line crossed below the signal line, signaling potential downward momentum. This technical pattern is considered a sell signal and may indicate the start of a new downtrend, prompting traders to be cautious or consider exiting long positions.
Written by Sridhar J
Disclaimer

The views and investment tips expressed by investment experts/broking houses/rating agencies on tradebrains.in are their own, and not that of the website or its management. Investing in equities poses a risk of financial losses. Investors must therefore exercise due caution while investing or trading in stocks. Trade Brains Technologies Private Limited or the author are not liable for any losses caused as a result of the decision based on this article. Please consult your investment advisor before investing.
