Indian equity markets began the week on a cautious note, opening higher but failing to hold early gains due to persistent selling pressure and weak investor sentiment. Both the Nifty 50 and BSE Sensex saw intraday volatility, eventually closing marginally lower, despite a positive start. Technically, the indices showed weakness, slipping below key short-term moving averages, though they remained above their long-term trend lines. Market breadth continued to deteriorate, marking the seventh consecutive session of decline, as foreign institutional outflows and subdued momentum indicators signalled growing caution among traders.
Amidst the overall market weakness, select sectors showed resilience. Public sector banks led the gains, followed by strength in oil & gas and real estate stocks, driven by renewed interest in defensives and cyclical plays. On the flip side, media, private banks, and small-cap stocks saw notable declines, weighed down by profit-booking and weak broader sentiment. Global cues were mixed, with most Asian markets ending higher, while weakness in Japanese equities and a dip in US futures pointed to lingering global uncertainty.
In this overview, we will analyse the key technical levels and trend directions for Nifty and BSE Sensex to monitor in the upcoming trading sessions. All the charts mentioned below are based on the 5-minute timeframe.
Nifty 50
(In this analysis, we have used 20/50/100/200 EMAs, where 20 EMA (Red), 50 EMA (Orange), 100 EMA (Light Blue), and 200 EMA (Dark Blue)).
To view other technical reports, click here
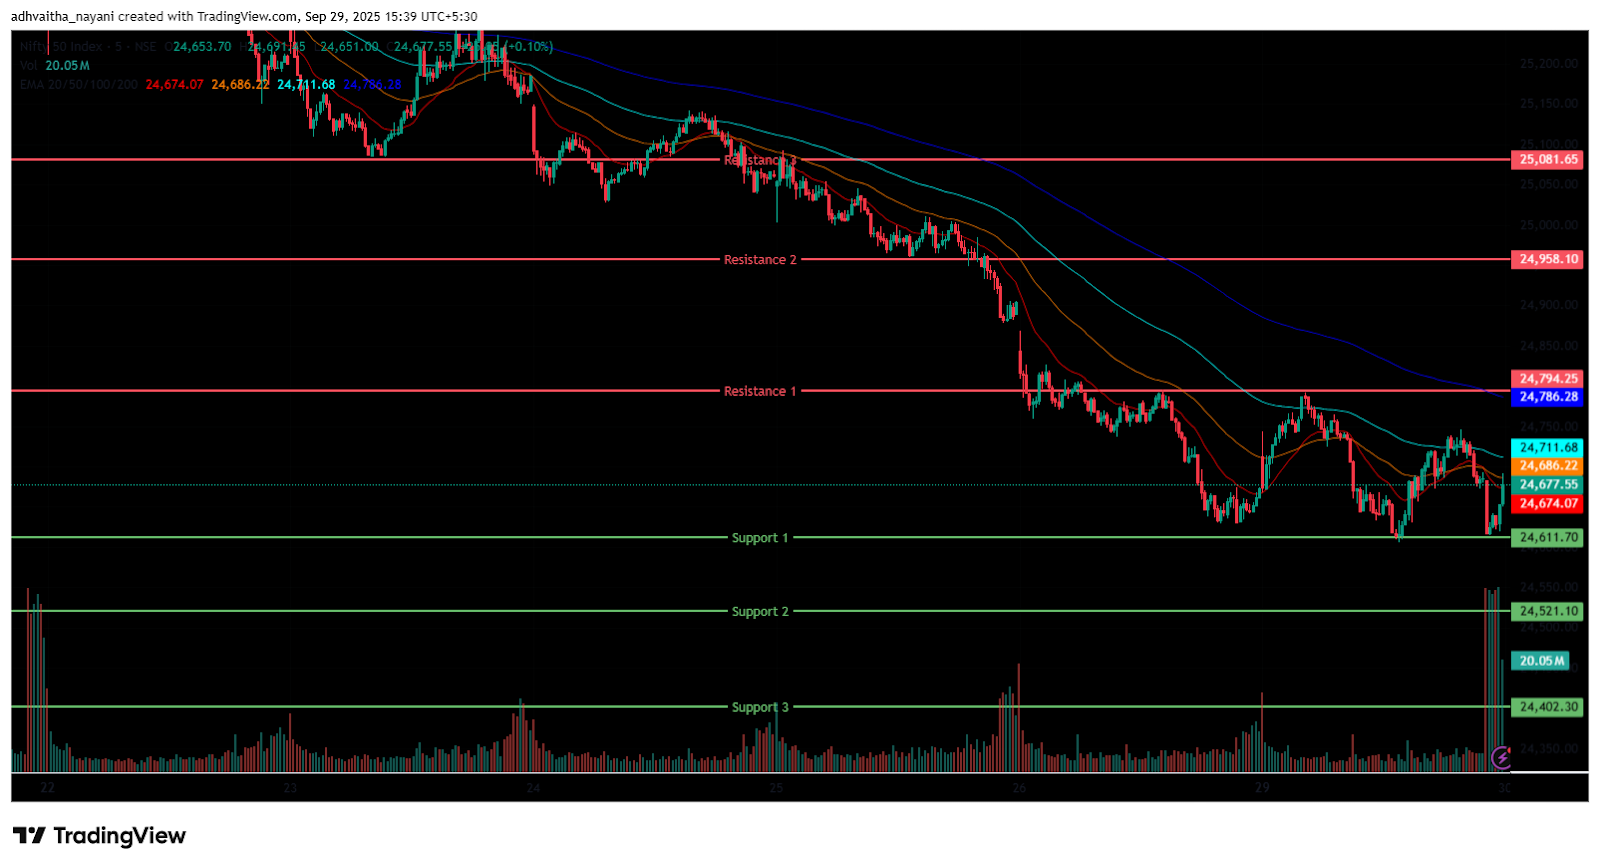
The Nifty 50 Index opened on a positive note at 24,728.55 on Monday, up by 73.85 points from Friday’s closing of 24,654.70. With a bullish start to the day, the index had a volatile morning session, trading in the 24,600 to 24,800 range. Additionally, the Index stood below all four EMAs of 20/50/100/200 in the 15-minute time frame during the morning session.
Further, the index fell as low as the 24,606 mark, the day’s low in the afternoon session, and was traded below its opening level, between the range of 24,600 and 24,750. During the afternoon session, the Nifty 50 traded below all four EMAs of 20/50/100/200 in the 15-minute time frame. Nifty’s immediate resistance levels are R1 (24,794), R2 (24,958), and R3 (25,082), while immediate support levels are S1 (24,611), S2 (24,521), and S3 (24,402).
The Nifty index had reached a day’s high at 24,791.30 and saw a day’s low at 24,606.20. Finally, it had closed at 24,634.90, in red below the 24,650 level, losing 19.8 points, or 0.08%. The Nifty 50 closed above the EMA of 200 but below the 20/50/100 EMAs in the daily time frame.
Momentum Indicators
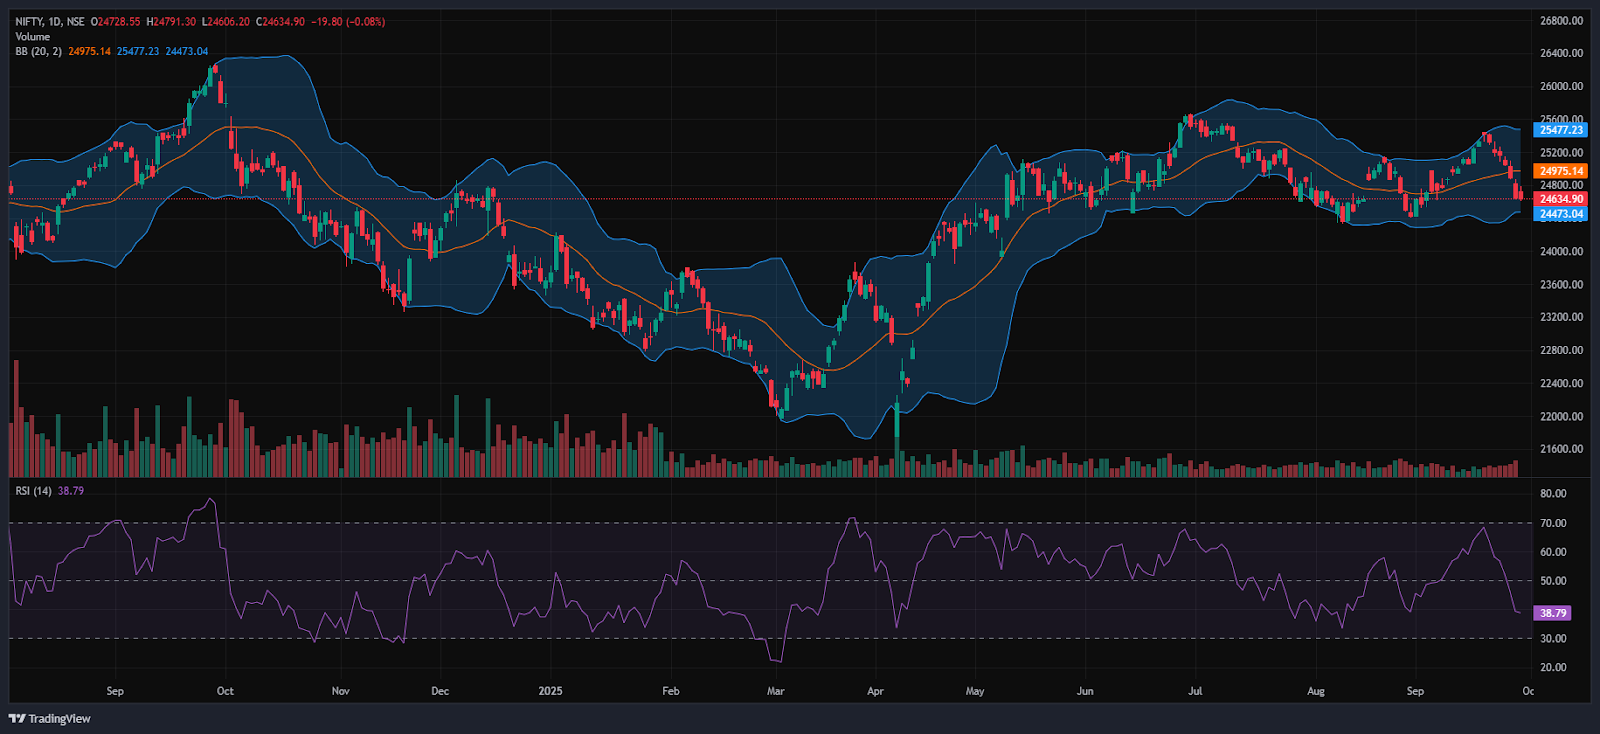
RSI (Daily): The Nifty 50’s RSI stood at 38.79, which is well below the overbought zone of 70 but near to the oversold zone, indicating a bearish sentiment.
Bollinger Bands (Daily): The index is trading in the lower band of its Bollinger Band range below the middle band (Simple Moving Average). Its position in the lower range indicates a bearish sentiment, along with strong resistance around the 24,700 level in Monday’s session. A sustained move above the middle band signals a bullish sentiment, while a drop back toward the lower band may reinforce bearish sentiment.
Volume Analysis: Monday’s trading session had above-average volumes, which stood at 394.39 Mn.
Derivatives Data: Options OI indicates strong Put writing at 24,600, following 24,500, establishing it as a firm support zone. On the upside, a significant Call OI buildup at 24,700 and 24,800 suggests a potential resistance supply. PCR (Put/Call Ratio) stands at 0.66 (<1), leaning towards bullish sentiment and the Short covering signals a temporary short-term bullish move, with an overall neutral to positive outlook for the next trading session.
Bank Nifty
(In this analysis, we have used 20/50/100/200 EMAs, where 20 EMA (Red), 50 EMA (Orange), 100 EMA (Light Blue), and 200 EMA (Dark Blue)).
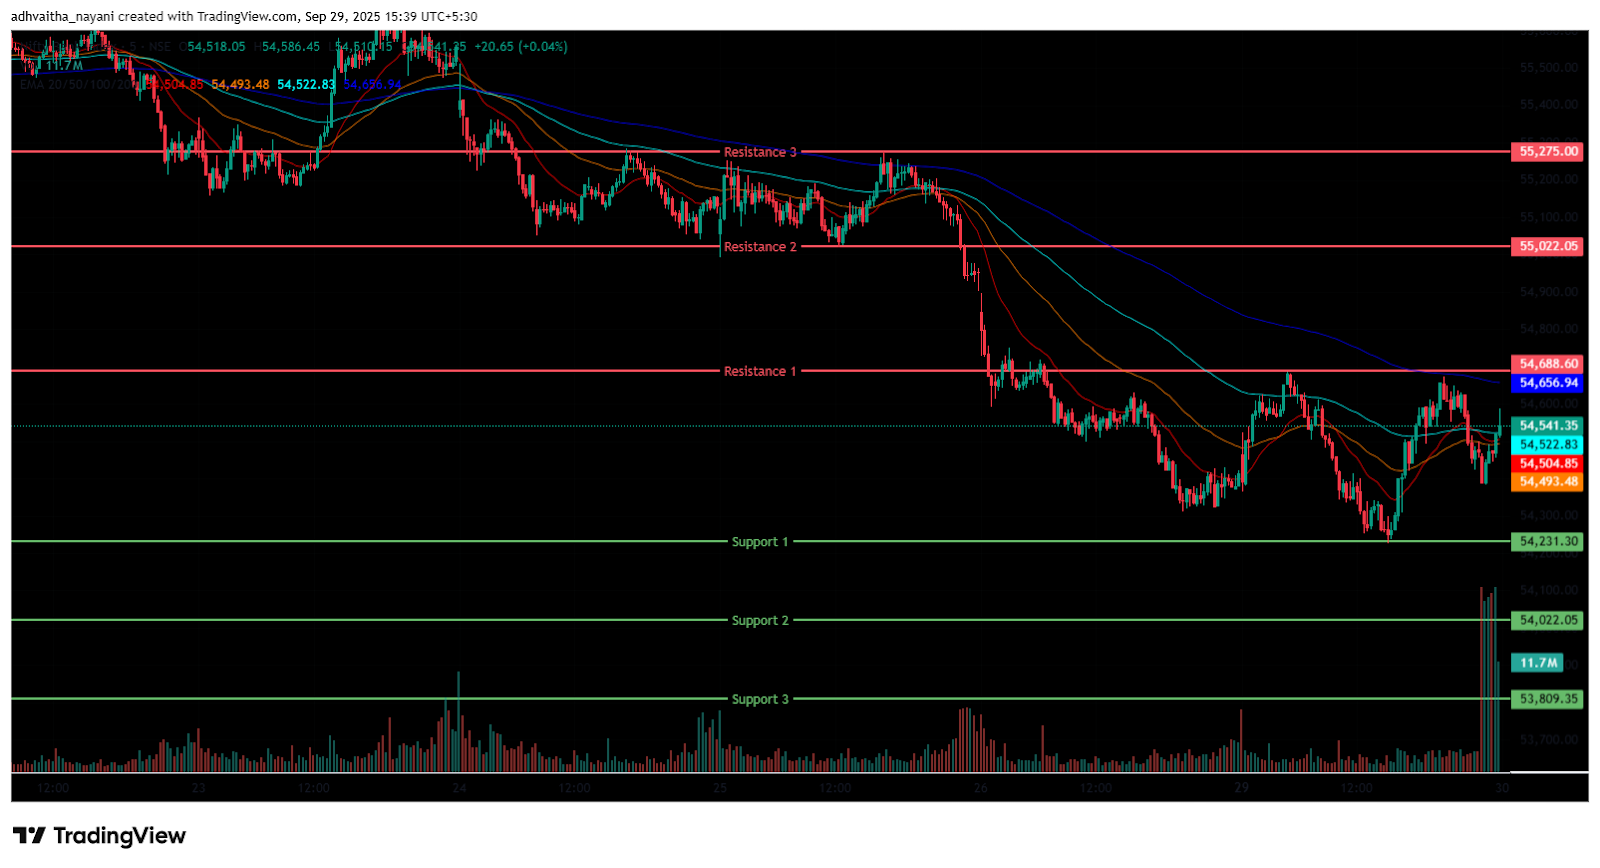
The Bank Nifty Index also started the session on a positive note at 54,460.40 on Monday, up by 71.05 points from Friday’s closing of 54,976.20. The index was trading between the range of 54,200 and 54,700 in the morning session, indicating volatility. In addition, the index was trading below all four EMAs of 20/50/100/200 in the 15-minute time frame.
In the afternoon session, the Index further fell as low as the 54,227 level, marking its day’s low and was traded around the range of 54,200 and 54,700, ending in green. During the afternoon session, Bank Nifty closed below the EMAs of 50/100/200 but above the 20-period EMA in the 15-minute time frame. Bank Nifty immediate resistance levels are R1 (54,689), R2 (55,022), and R3 (55,275), while immediate support levels are S1 (54,231), S2 (54,022), and S3 (53,809).
The Bank Nifty index had peaked at 54,686.05 and made a day’s low at 54,226.60. Finally, it had closed in green at 54,461.00, closing above the 54,400 level, gaining 71.65 points or 0.13%. The Relative Strength Index (RSI) stood at 42.15 well below the overbought zone of 70 but near to the oversold zone in the daily time frame, and Bank Nifty closed above the EMA of 200 but below the 20/50/100 EMAs in the daily time frame.
Sensex
(In this analysis, we have used 20/50/100/200 EMAs, where 20 EMA (Red), 50 EMA (Orange), 100 EMA (Light Blue), and 200 EMA (Dark Blue)).
To view other technical reports, click here
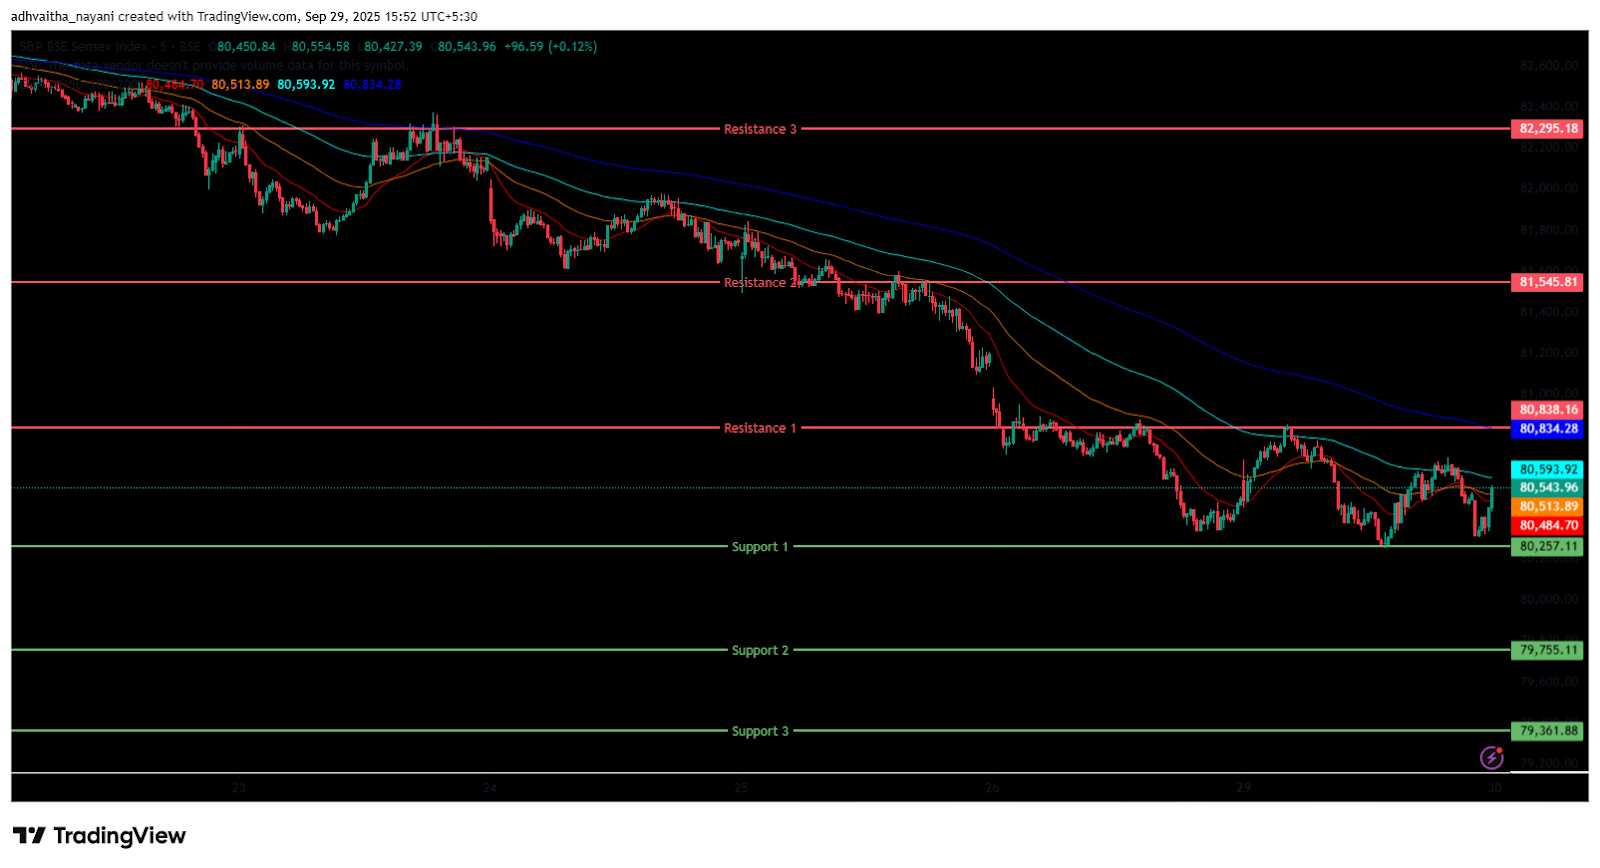
The BSE Sensex Index also opened on a positive note at 80,588.77 on Monday, up by 162.31 points from Friday’s closing of 80,426.46. The index started its session on a bullish note and was trading in the 80,250 to 80,850 range throughout the morning session’s 15-minute time frame, below all four EMAs of the 20/50/100/200.
In the afternoon session, the Index was further dragged down, marking its day low at the 80,249 level and trading between the 80,200 and 80,700 levels, maintaining its overall bearish trend and closing below the EMAs of 50/100/200 but above the 20 period EMA in the 15-minute time frame. BSE Sensex immediate resistance levels are R1 (80,838), R2 (81,546), and R3 (82,295), while immediate support levels are S1 (80,257), S2 (79,755), and S3 (79,362).
The BSE Sensex index had peaked at 80,851.38 and made a day’s low at 80,248.84. Finally, it had closed at 80,364.94 in red, losing 61.52 points or 0.076%. The Relative Strength Index (RSI) stood at 38.36 (below the overbought zone of 70 but near to the oversold zone in the daily time frame), and the BSE Sensex closed below all four EMAs of 20/50/100/200 in the daily time frame.
India VIX
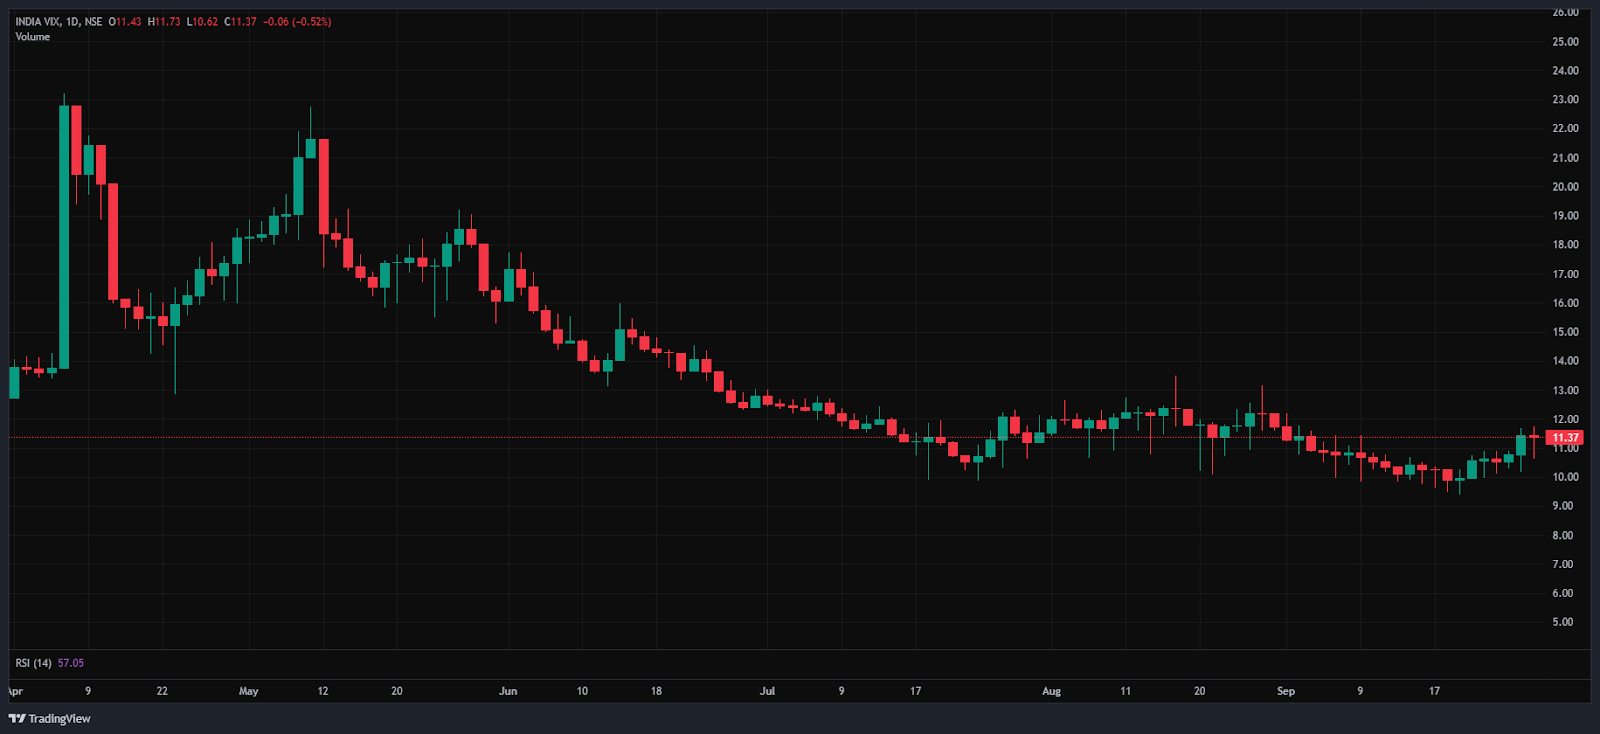
The India VIX decreased by 0.060 points or 0.53%, from 11.42 to 11.36 during Monday’s session. A decrease in the India VIX typically indicates lower price volatility in the stock market, suggesting a more stable market environment. However, a stable market environment and minimal volatility are anticipated when the India vix is below 15.
Market Recap on the 29th of September 2025
On Monday, the Nifty 50 opened on a positive note above the 24,700 level at 24,728.55, up 73.85 points from its previous close of 24,654.70. It touched an intraday low of 24,606.2 before closing marginally lower at 24,634.9, down 19.80 points or 0.08%. Technically, the index stayed above the 200-day EMA but slipped below the 20-, 50-, and 100-day EMAs on the daily chart. The BSE Sensex mirrored this trend, opening higher at 80,588.77 (up 162.31 points) but ending the session at 80,364.94, down 61.52 points or 0.08%.
Momentum indicators reflected weak sentiment, with the RSI at 38.79 for Nifty 50 and 38.36 for Sensex, both nearing oversold territory. In contrast, the Bank Nifty Index ended in the green, gaining 71.65 points or 0.13%, to close at 54,461. Broader markets declined for the seventh straight session, impacted by sustained FII selling and elevated volatility.
Sector-wise, the Nifty PSU Bank Index outperformed, rising 1.78% to close at 7,390.75, with major PSU banks like Indian Bank, Bank of Baroda, Bank of India, Canara Bank, and Bank of Maharashtra gaining up to 2.6%. The Nifty Oil & Gas Index followed, up 1.35% at 11,282.3, led by HPCL, which surged 4.62%, along with gains in Petronet LNG, BPCL, and IOC. The Nifty Realty Index also posted modest gains of 0.88%, closing at 874.75.
On the downside, the Nifty Media Index was the worst performer, slipping 0.9% to 1,562, with Nazara Technologies dropping 5% and other names like Hathway, Saregama and PVR Inox falling up to 3.5%. The Nifty Smallcap 50 declined 0.3% to 8,410.15, dragged by names like Firstsource Solutions, Aditya Birla Real Estate, and Kaynes Technology, which fell up to 7.2%. The Nifty Private Bank Index also slipped 0.3% to settle at 26,411.3.
In global markets, Asian indices closed mixed. Hong Kong’s Hang Seng led gains, rising 1.89% to 26,622.88, followed by South Korea’s KOSPI up 1.33%, and the Shanghai Composite, up 0.9%. However, Japan’s Nikkei 225 declined 0.69% to 45,043.75. As of 4:20 p.m. IST, US Dow Jones Futures were down 200 points, or 0.43%, trading at 46,756.
Trade Setup Summary
The Nifty 50 opened on a positive note at 24,728.55 on Monday but ended the session in the red below the 24,650 level at 24,634.90. A break below 24,611 could trigger further selling towards 24,521 while breaking the next resistance level of 24,794 could trigger bullishness towards the 24,958 level.
Bank Nifty started the session on a positive note at 54,460.40 and ended the session in the green at 54,461.00, above the 54,400 level. A break below 54,231 could trigger further selling towards 54,022, while breaking the next resistance level of 54,689 could trigger bullishness towards the 55,022 level.
Sensex also opened on a positive note at 80,588.77 but ended the session in the red at 80,364.94, below the 80,400 level. A break below 80,257 could trigger further selling towards 79,755, while breaking the next resistance level of 80,838 could lead towards the 81,546 level.
Given the ongoing volatility and mixed sentiments, it’s advisable to avoid aggressive positions and wait for clear directional moves above resistance or below support. Traders should consider these key support and resistance levels when entering long or short positions following the price break from these critical levels. Additionally, traders can combine moving averages to identify more accurate entry and exit points.
Disclaimer

The views and investment tips expressed by investment experts/broking houses/rating agencies on tradebrains.in are their own, and not that of the website or its management. Investing in equities poses a risk of financial losses. Investors must therefore exercise due caution while investing or trading in stocks. Trade Brains Technologies Private Limited or the author are not liable for any losses caused as a result of the decision based on this article. Please consult your investment advisor before investing.
About: Trade Brains Portal is a stock analysis platform. Its trade name is Dailyraven Technologies Private Limited, and its SEBI-registered research analyst registration number is INH000015729.
Investments in securities are subject to market risks. Read all the related documents carefully before investing.
Registration granted by SEBI and certification from NISM in no way guarantee performance of the intermediary or provide any assurance of returns to investors.
