
Synopsis:
Three prominent stocks are currently exhibiting bearish signals on the MACD indicator, suggesting potential short-term downward momentum despite their broader market presence.
The MACD bearish pattern indicates weakening price trends, highlighting caution for traders and investors. These stocks may face near-term selling pressure, warranting close monitoring for trend reversals or further declines.
State Bank of India
State Bank of India (SBI) is India’s largest public sector bank, offering a wide range of banking and financial services including retail, corporate, and investment banking. It plays a key role in driving financial inclusion and supporting economic growth across the country.
With market capitalization of Rs. 7,92,033 cr, the shares of State Bank of India are closed at Rs. 858.25 per share, from its previous close of Rs. 864.70 per share.
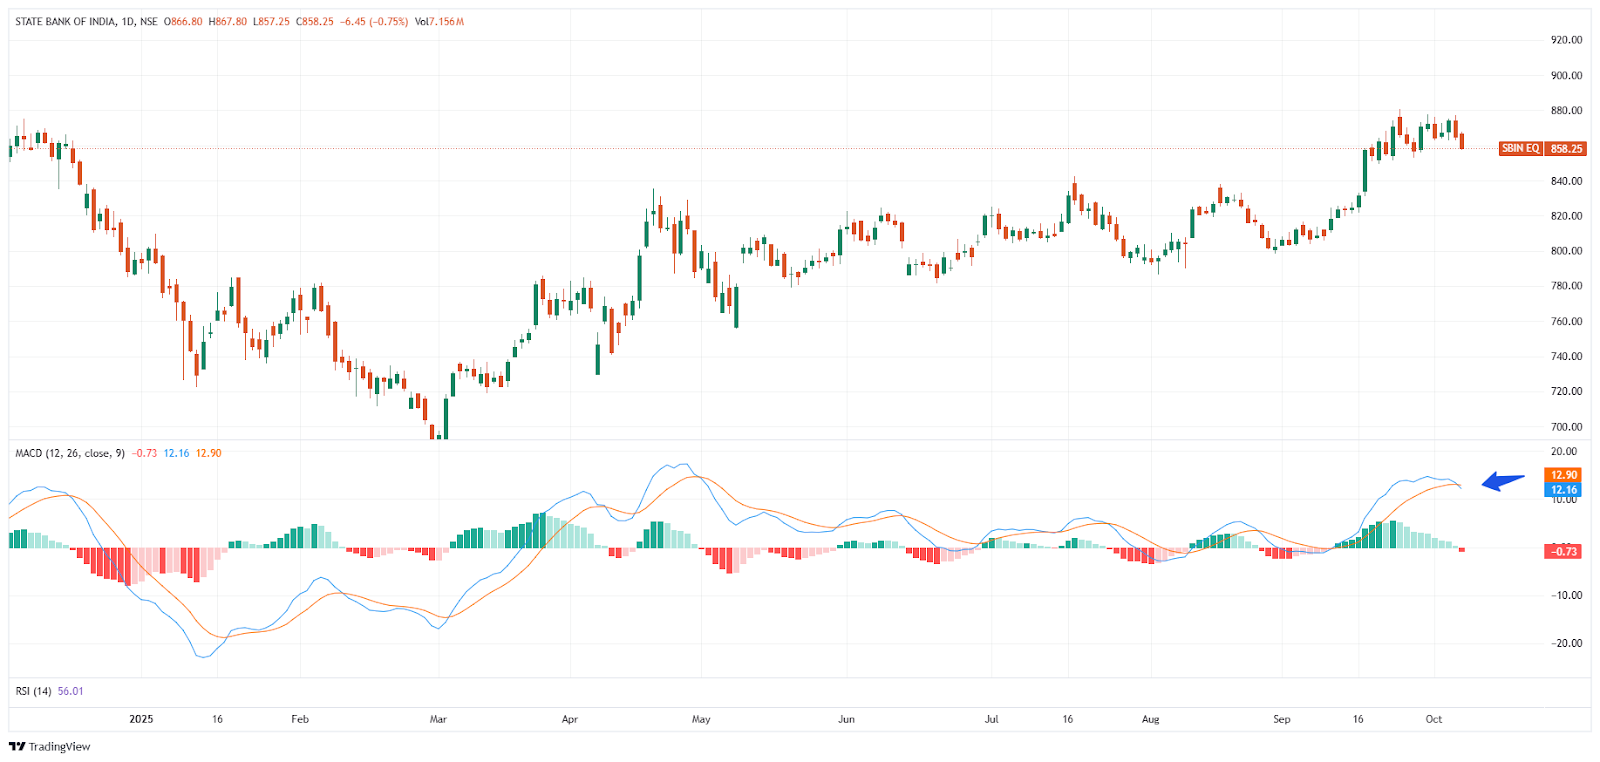
This pattern typically indicates that the stock may face selling pressure or a near-term correction, prompting traders to exercise caution.
Adani Enterprises Ltd
Adani Enterprises Ltd is the flagship company of the Adani Group, engaged in diverse sectors including infrastructure, energy, logistics, and resources. It focuses on large-scale projects and strategic investments, driving the group’s growth across India and globally.
With market capitalization of Rs. 2,91,356 cr, the shares of Adani Enterprises Ltd are closed at Rs. 2,524.10 per share, from its previous close of Rs. 2,542.20 per share.
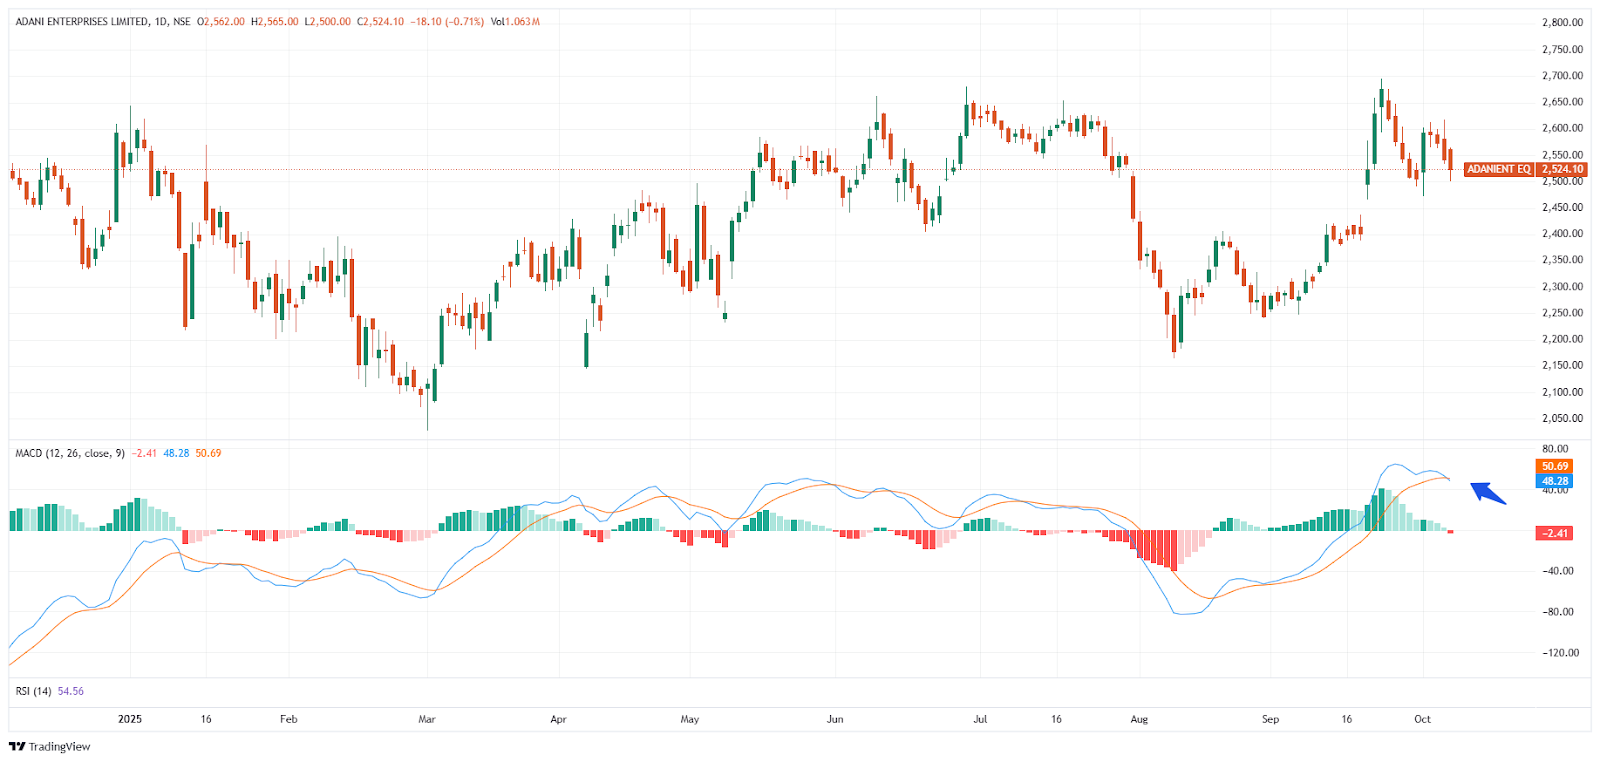
This pattern typically indicates that the stock may face selling pressure or a near-term correction, prompting traders to exercise caution.
Supriya Lifescience Ltd
Supriya Lifescience Ltd is an Indian pharmaceutical company specializing in the development and manufacture of active pharmaceutical ingredients (APIs) and intermediates. It serves domestic and international markets, focusing on quality, compliance, and growth in the life sciences sector.
With market capitalization of Rs. 5,743 cr, the shares of Supriya Lifescience Ltd are closed at Rs. 715.55 per share, from its previous close of Rs. 717.50 per share.
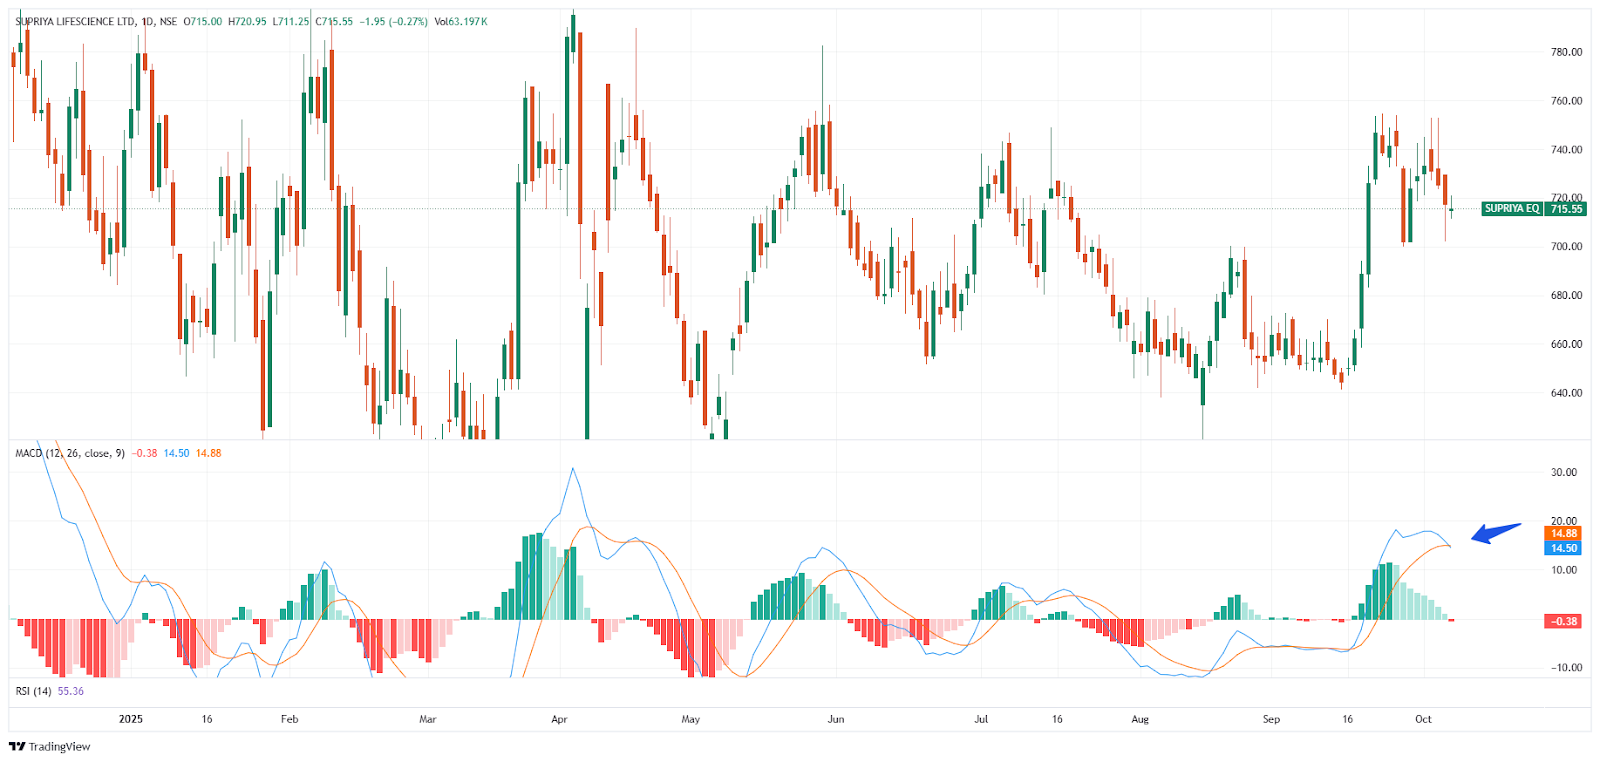
This pattern typically indicates that the stock may face selling pressure or a near-term correction, prompting traders to exercise caution.
Written by Manideep Appana
Disclaimer

The views and investment tips expressed by investment experts/broking houses/rating agencies on tradebrains.in are their own, and not that of the website or its management. Investing in equities poses a risk of financial losses. Investors must therefore exercise due caution while investing or trading in stocks. Trade Brains Technologies Private Limited or the author are not liable for any losses caused as a result of the decision based on this article. Please consult your investment advisor before investing.
