Markets ended Thursday on a broadly positive note, with key indices in India gaining momentum throughout the day. The Nifty 50 closed near the 25,200 mark, comfortably maintaining its position above all major moving averages, signalling sustained bullish momentum. The BSE Sensex mirrored this trend, closing near the 82,200 level, while the Bank Nifty also advanced, supported by steady buying across sectors. Momentum indicators reflected moderate strength, indicating room for further upside without being overextended.
Sectoral indices saw broad-based gains, led by metals, IT, healthcare, and pharma, driven by favourable global cues and encouraging domestic developments. The Nifty Metal Index surged, buoyed by rising global copper prices, while the IT sector rallied ahead of major corporate earnings. Meanwhile, healthcare and pharmaceutical stocks gained on positive news regarding potential tariff relief on generic medicines.
Asian markets largely followed suit, with strong performances in Japan, Taiwan, and Shanghai, despite minor dips in Singapore and Hong Kong. Investors remained cautious ahead of US Fed policy signals and ongoing concerns over the prolonged US government shutdown, which tempered global sentiment late in the day.
In this overview, we will analyse the key technical levels and trend directions for Nifty and BSE Sensex to monitor in the upcoming trading sessions. All the charts mentioned below are based on the 5-minute timeframe.
Nifty 50
(In this analysis, we have used 20/50/100/200 EMAs, where 20 EMA (Red), 50 EMA (Orange), 100 EMA (Light Blue), and 200 EMA (Dark Blue)).
To view other technical reports, click here
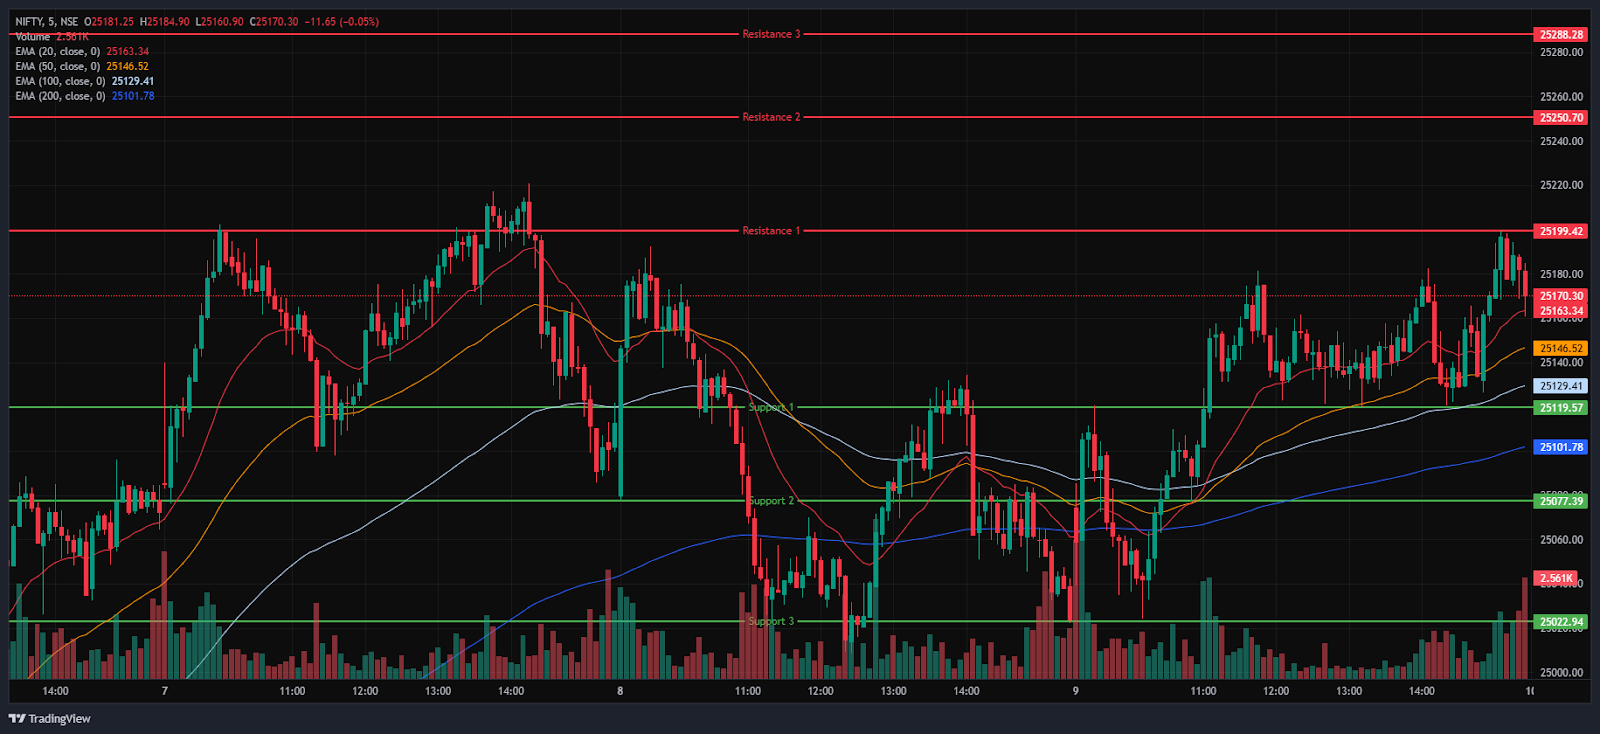
The Nifty 50 Index opened on a positive note at 25,074.30 on Thursday, up by 28.15 points from Wednesday’s closing of 25,046.15. With a bullish start to the day, the index had a volatile morning session, trading in the 25,000 to 25,200 range. Additionally, the Index stood above all four EMAs of 20/50/100/200 in the 15-minute time frame during the morning session.
Further, the index surged as high as the 25,199, marking its day high, in the afternoon session and was traded in the range of 25,100 and 25,200. During the afternoon session, the Nifty 50 closed above all four EMAs of 20/50/100/200 in the 15-minute time frame. Nifty’s immediate resistance levels are R1 (25,199), R2 (25,251), and R3 (25,288), while immediate support levels are S1 (25,120), S2 (25,077), and S3 (25,023).
The Nifty index had reached a day’s high at 25,199.25 and saw a day’s low at 25,024.30. Finally, it had closed at 25,181.80, in green above the 25,150 level, gaining 135.65 points, or 0.54%. The Nifty 50 closed above all four EMAs of 20/50/100/200 in the daily time frame.
Momentum Indicators
RSI (Daily): The Nifty 50’s RSI stood at 58.03, which is well below the overbought zone of 70, indicating a bullish sentiment and room to grow higher.
Bollinger Bands (Daily): The index is trading in the upper band of the Bollinger Band range above the middle band (Simple Moving Average). Its position in the upper range indicates a bullish sentiment, and on Thursday, the Index formed a Strong Bullish Candle; it can be seen as a Bullish outlook for the next trading session. A sustained move above the middle band signals a bullish sentiment, while a drop back toward the lower band may reinforce bearish sentiment.
Volume Analysis: Thursday’s trading session had average volumes, which stood at 286.25 Mn.
Derivatives Data: Options OI indicates strong Put writing at 25,100, following 25,000, establishing it as a firm support zone. On the upside, a significant Call OI buildup at 25,200 and 25,300 suggests a potential resistance supply. PCR (Put/Call Ratio) stands at 1.0096 (<1), leaning towards neutral to bullish sentiment and the Short Covering signals a short-term bullish signal, with an overall Bullish outlook for the next trading session.
Bank Nifty
(In this analysis, we have used 20/50/100/200 EMAs, where 20 EMA (Red), 50 EMA (Orange), 100 EMA (Light Blue), and 200 EMA (Dark Blue)).
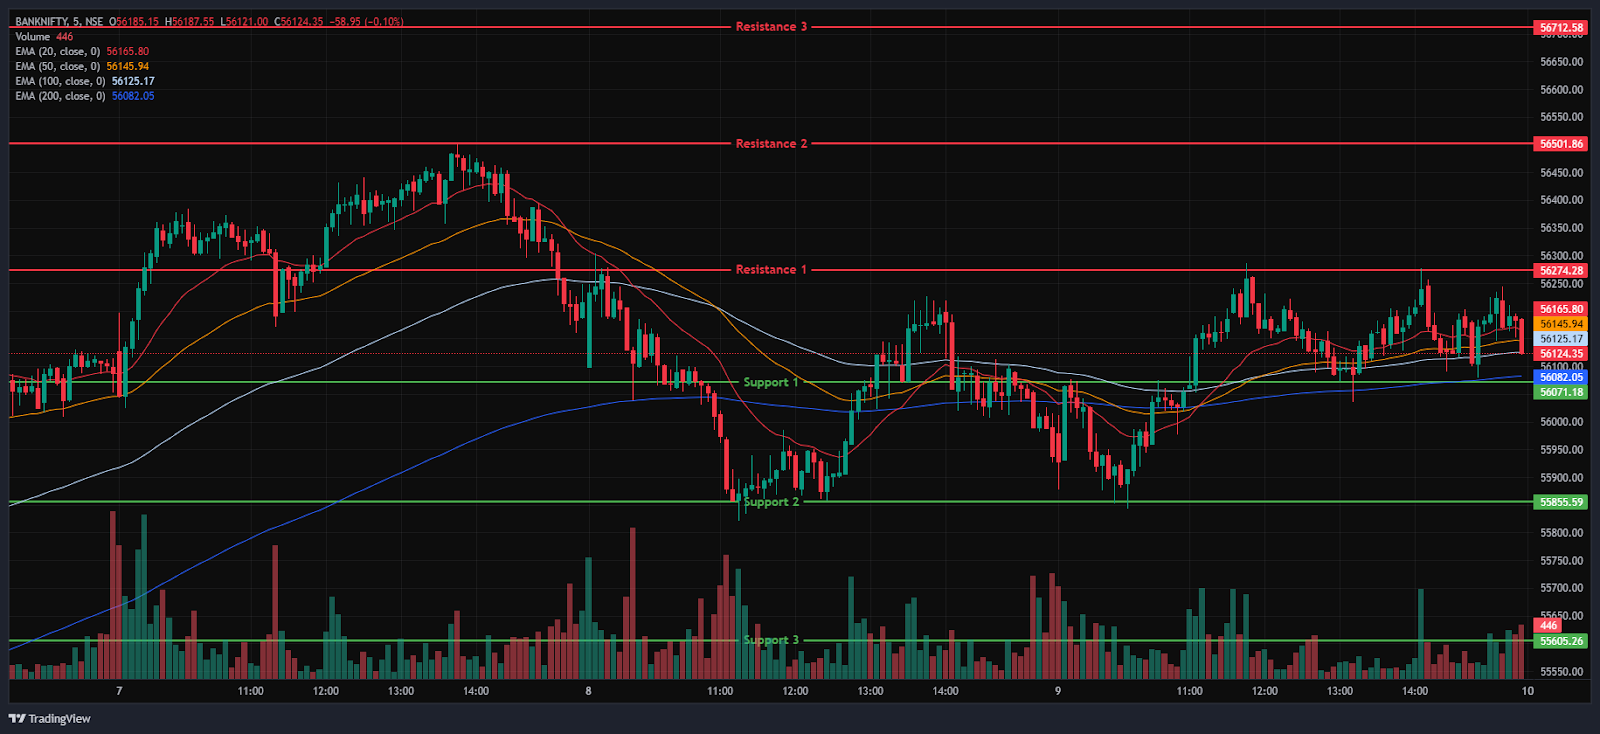
The Bank Nifty Index also started the session on a negative note at 55,979.00 on Thursday, down by 39.25 points from Wednesday’s closing of 56,018.25. The index was trading between the range of 55,800 and 56,300 in the morning session, indicating high volatility. In addition, the index was trading above all four EMAs of 20/50/100/200 in the 15-minute time frame.
In the afternoon session, the Index consolidated around the range of 56,000 and 56,300, ending in green above its opening level. During the afternoon session, Bank Nifty closed above the EMAs of 50/100/200 but below the 20-period EMAs in the 15-minute time frame. Bank Nifty immediate resistance levels are R1 (56,274), R2 (56,502), and R3 (56,713), while immediate support levels are S1 (56,071), S2 (55,856), and S3 (55,605).
The Bank Nifty index had peaked at 56,286.25 and made a day’s low at 55,843.90. Finally, it had closed in green at 56,192.05, closing above the 56,100 level, gaining 173.8 points or 0.31%. The Relative Strength Index (RSI) stood at 62.78 well below the overbought zone of 70 in the daily time frame, and Bank Nifty closed above all four EMAs of 20/50/100/200 in the daily time frame.
Sensex
(In this analysis, we have used 20/50/100/200 EMAs, where 20 EMA (Red), 50 EMA (Orange), 100 EMA (Light Blue), and 200 EMA (Dark Blue)).
To view other technical reports, click here
The BSE Sensex Index also opened on a positive note at 81,900.00 on Thursday, up by 126.34 points from Wednesday’s closing of 81,773.66. The index started its session on a bullish note and was trading in the 81,600 to 82,200 range throughout the morning session and was above all four EMAs of 20/50/100/200 in the 15-minute time frame.
In the afternoon session, the Index further surged as high as the 82,248 level, marking its day high and was traded around 81,900 and 82,250, maintaining its overall bullish trend and the Index closed above all four EMAs of 20/50/100/200 in the 15-minute time frame. BSE Sensex immediate resistance levels are R1 (82,246), R2 (82,488), and R3 (82,730), while immediate support levels are S1 (81,948), S2 (81,636), and S3 (81,364).
The BSE Sensex index had peaked at 82,247.73 and made a day’s low at 81,667.68. Finally, it had closed at 82,172.10 in green, gaining 398.45 points or 0.49%. The Relative Strength Index (RSI) stood at 57.91 (below the overbought zone of 70) in the daily time frame, and the BSE Sensex closed above all four EMAs of 20/50/100/200 in the daily time frame.
India VIX
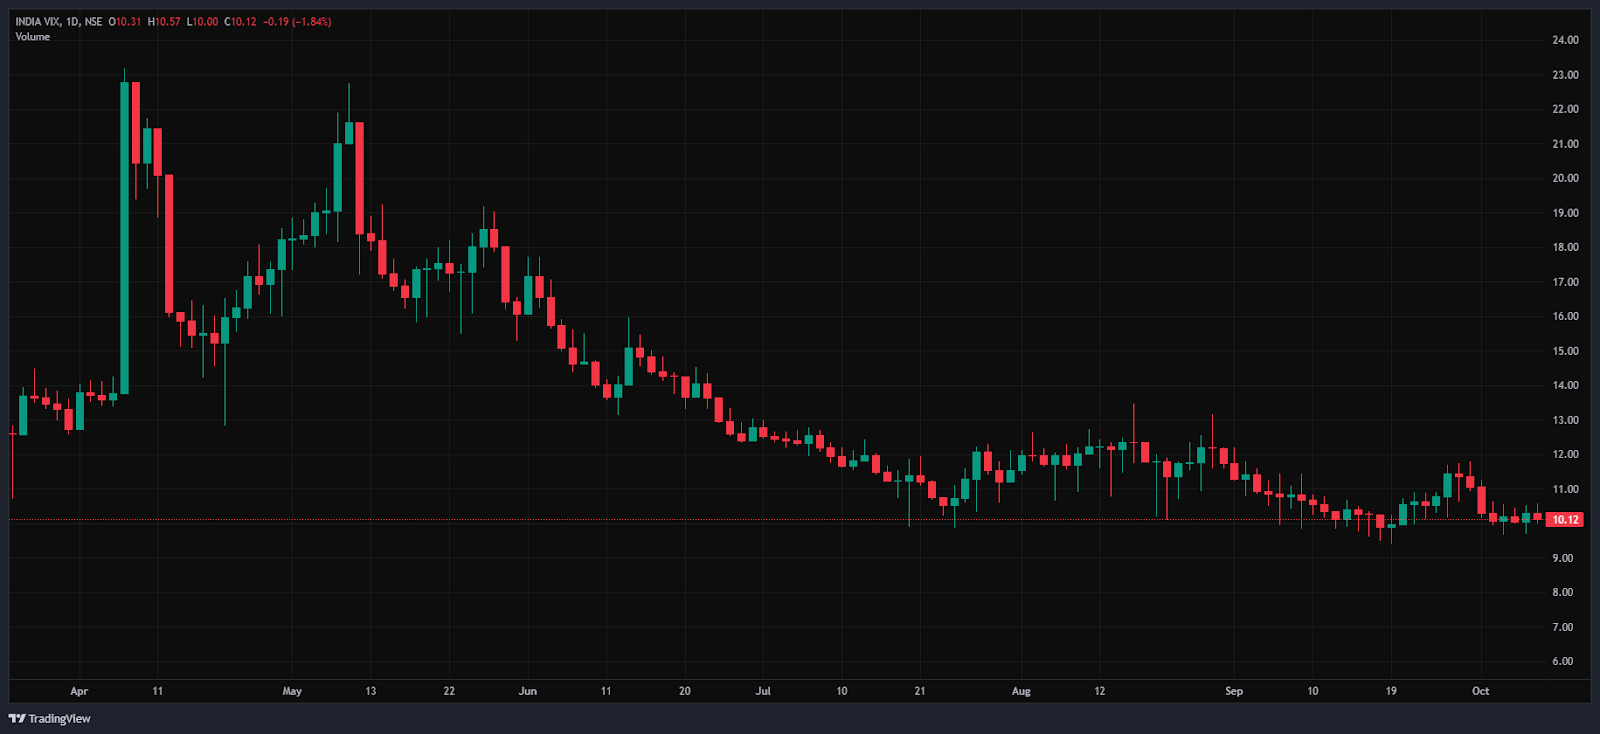
The India VIX decreased by 0.19 points or 1.87%, from 10.31 to 10.12 during Thursday’s session. A decrease in the India VIX typically indicates lower price volatility in the stock market, suggesting a more stable market environment. However, a stable market environment and minimal volatility are anticipated when the India vix is below 15.
Market Recap on the 9th of October 2025
On Thursday, the Nifty 50 opened on a positive note at 25,074.3, up 28.15 points from its previous close of 25,046.15. The index hit an intraday high of 25,199.25 before closing just below the 25,200 mark at 25,181.8, registering a gain of 135.65 points, or 0.54%. Technically, the index maintained a strong stance by staying above all key moving averages, the 20, 50, 100, and 200-day EMAs, on the daily chart. Similarly, the BSE Sensex opened at 81,900, up 126.34 points from its prior close of 81,773.66.
It followed a pattern akin to the Nifty 50 and settled below the 82,200 level at 82,172.1, up by 398.44 points, or 0.49%. Momentum indicators pointed to moderate strength, with the RSI at 58.03 for Nifty 50 and 57.91 for Sensex, both comfortably below the overbought threshold of 70. The Bank Nifty Index also ended in positive territory, gaining 173.8 points or 0.31%, to close at 56,192.05.
All sectoral indices closed in green, with no major decliners. Leading the gains was the Nifty Metal Index, which surged 219.65 points (2.17%) to finish at 10,356.20. This rally was largely fuelled by rising global copper prices, with Hindustan Copper gaining 6.4%.
Other metal stocks such as Hindustan Zinc Ltd, Lloyds Metals & Engineers Ltd, Steel Authority of India Ltd, and NMDC Ltd also posted strong gains of up to 4.43%. The Nifty IT Index also showed strength, climbing 396.30 points (1.12%) to settle at 35,628.50, buoyed by optimism ahead of TCS’s earnings announcement.
Top tech performers included HCL Technologies Ltd, LTIMindtree Ltd, Persistent Systems Ltd, and Oracle Financial Services Ltd, which rose by up to 2.29%. Healthcare and pharmaceutical sectors also saw positive momentum. The Nifty Healthcare Index gained 154.2 points (1.07%) to close at 14,593.5, while the Nifty Pharma Index advanced 228.85 points (1.05%) to end at 21,936.2. These sectors reacted favourably following reports that the Trump administration may refrain from imposing tariffs on generic medicines, providing a relief boost to investors.
In Asia, markets largely reflected positive sentiment on Thursday. Taiwan’s Weighted Index rose 238.24 points (0.88%) to close at 27,301.92, while Japan’s Nikkei 225 surged 845.45 points (1.77%) to finish at 48,580.44. The Shanghai Composite also gained 51.20 points (1.32%).
Conversely, Singapore’s Straits Times Index declined slightly by 15.8 points (-0.35%) to 4,440.5, and Hong Kong’s Hang Seng Index slipped 76.87 points (-0.29%) to close at 26,752.59. As of 4:54 p.m. IST, US Dow Jones Futures traded flat at 46,866, with investors cautious ahead of further Federal Reserve rate cut signals and ongoing concerns around the US government shutdown, which has now entered its eighth day.
Trade Setup Summary
The Nifty 50 opened on a positive note at 25,074.30 on Thursday and ended the session in the green above the 25,150 level at 25,181.80. A break below 25,120 could trigger further selling towards 24,077 while breaking the next resistance level of 25,199 could trigger bullishness towards the 25,251 level.
Bank Nifty started the session on a negative note at 55,979.00 but ended the session in the green at 56,192.05, above the 56,150 level. A break below 56,071 could trigger further selling towards 55,856, while breaking the next resistance level of 56,274 could trigger bullishness towards the 56,502 level.
Sensex also opened on a positive note at 81,900.00 and ended the session in the green at 82,172.10, above the 82,150 level. A break below 81,948 could trigger further selling towards 81,636, while breaking the next resistance level of 82,246 could lead towards the 82,488 level.
Given the ongoing volatility and mixed sentiments, it’s advisable to avoid aggressive positions and wait for clear directional moves above resistance or below support. Traders should consider these key support and resistance levels when entering long or short positions following the price break from these critical levels. Additionally, traders can combine moving averages to identify more accurate entry and exit points.
Disclaimer

The views and investment tips expressed by investment experts/broking houses/rating agencies on tradebrains.in are their own, and not that of the website or its management. Investing in equities poses a risk of financial losses. Investors must therefore exercise due caution while investing or trading in stocks. Trade Brains Technologies Private Limited or the author are not liable for any losses caused as a result of the decision based on this article. Please consult your investment advisor before investing.
About: Trade Brains Portal is a stock analysis platform. Its trade name is Dailyraven Technologies Private Limited, and its SEBI-registered research analyst registration number is INH000015729.
Investments in securities are subject to market risks. Read all the related documents carefully before investing.
Registration granted by SEBI and certification from NISM in no way guarantee performance of the intermediary or provide any assurance of returns to investors.
