Indian equity markets ended the week on a positive note, with benchmark indices such as the Nifty 50 and BSE Sensex registering steady gains despite opening on a slightly weaker footing. Both indices recovered during the session, supported by strength across most sectors and maintained positions above key technical indicators on the daily charts. Market sentiment remained stable, with momentum indicators reflecting moderate strength, indicating a balanced outlook among investors. Banking, realty, and pharma sectors were among the top performers, while metal stocks lagged behind.
Global cues presented a mixed picture, with most major Asian markets trading lower, whereas South Korea bucked the trend by closing in the green. US futures were marginally positive by the Indian market close. On the domestic front, the Indian market’s performance during the week was buoyed by positive developments, including progress on trade agreements. The announcement of a new Comprehensive Economic and Trade Agreement (CETA) between India and the UK further boosted sentiment, as it is expected to enhance bilateral trade and open new growth opportunities in the long term.
In this overview, we will analyse the key technical levels and trend directions for Nifty and BSE Sensex to monitor in the upcoming trading sessions. All the charts mentioned below are based on the 5-minute timeframe.
Nifty 50
(In this analysis, we have used 20/50/100/200 EMAs, where 20 EMA (Red), 50 EMA (Orange), 100 EMA (Light Blue), and 200 EMA (Dark Blue)).
To view other technical reports, click here
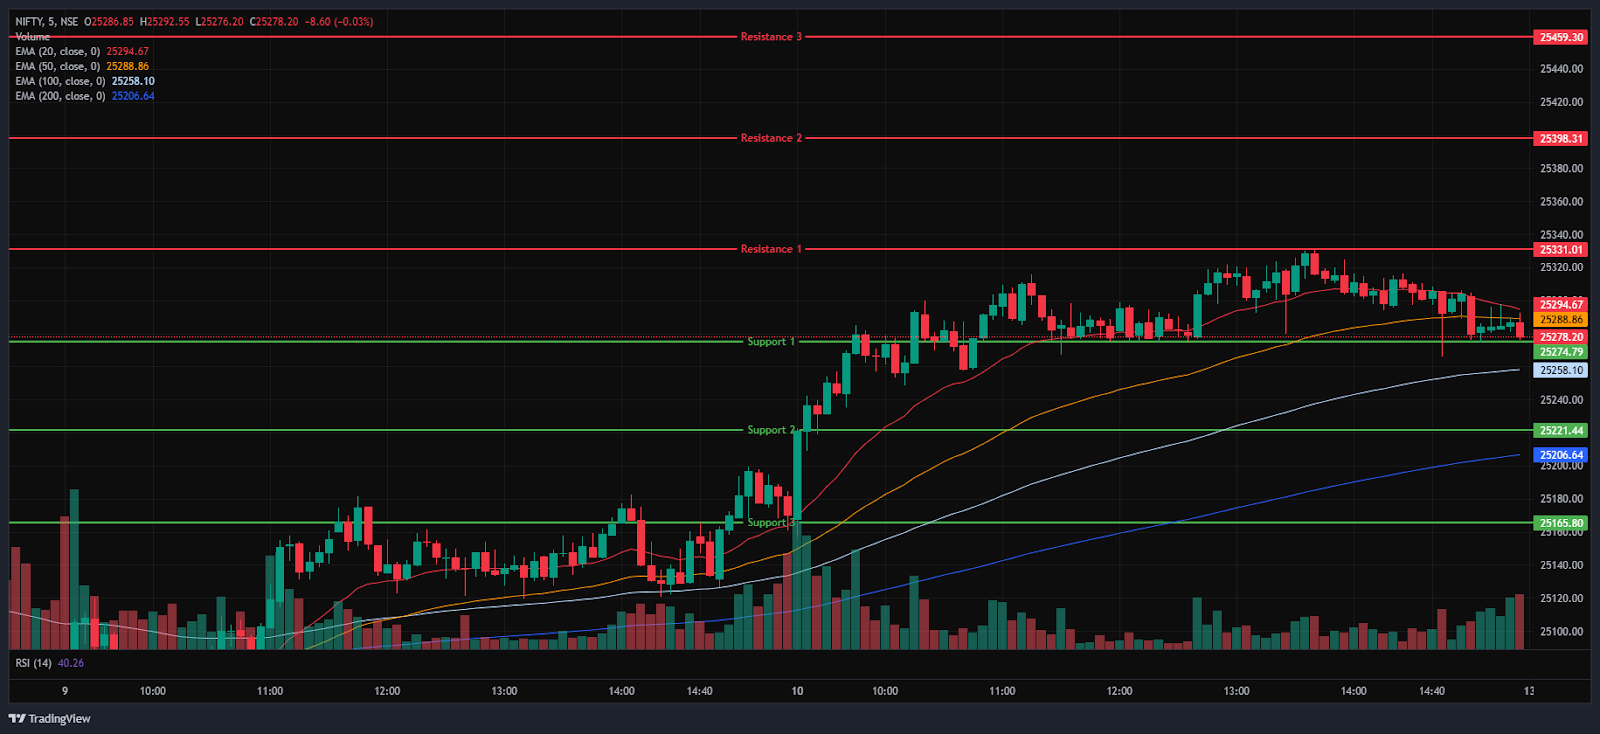
The Nifty 50 Index opened on a negative note at 25,167.65 on Friday, down by 14.15 points from Thursday’s closing of 25,181.80. With a bearish start to the day, the index had a volatile morning session, trading in the 25,150 to 25,350 range. Additionally, the Index stood above all four EMAs of 20/50/100/200 in the 15-minute time frame during the morning session.
Further, the index surged as high as the 25,331 marking its day high, in the afternoon session and was traded in the range of 25,250 and 25,350. During the afternoon session, the Nifty 50 closed above the EMAs of 50/100/200 but below the 20-period EMA in the 15-minute time frame. Nifty’s immediate resistance levels are R1 (25,331), R2 (25,398), and R3 (25,459), while immediate support levels are S1 (25,275), S2 (25,221), and S3 (25,166).
The Nifty index had reached a day’s high at 25,330.75 and saw a day’s low at 25,156.85. Finally, it had closed at 25,285.35, in green above the 25,250 level, gaining 103.55 points, or 0.41%. The Nifty 50 closed above all four EMAs of 20/50/100/200 in the daily time frame.
Momentum Indicators
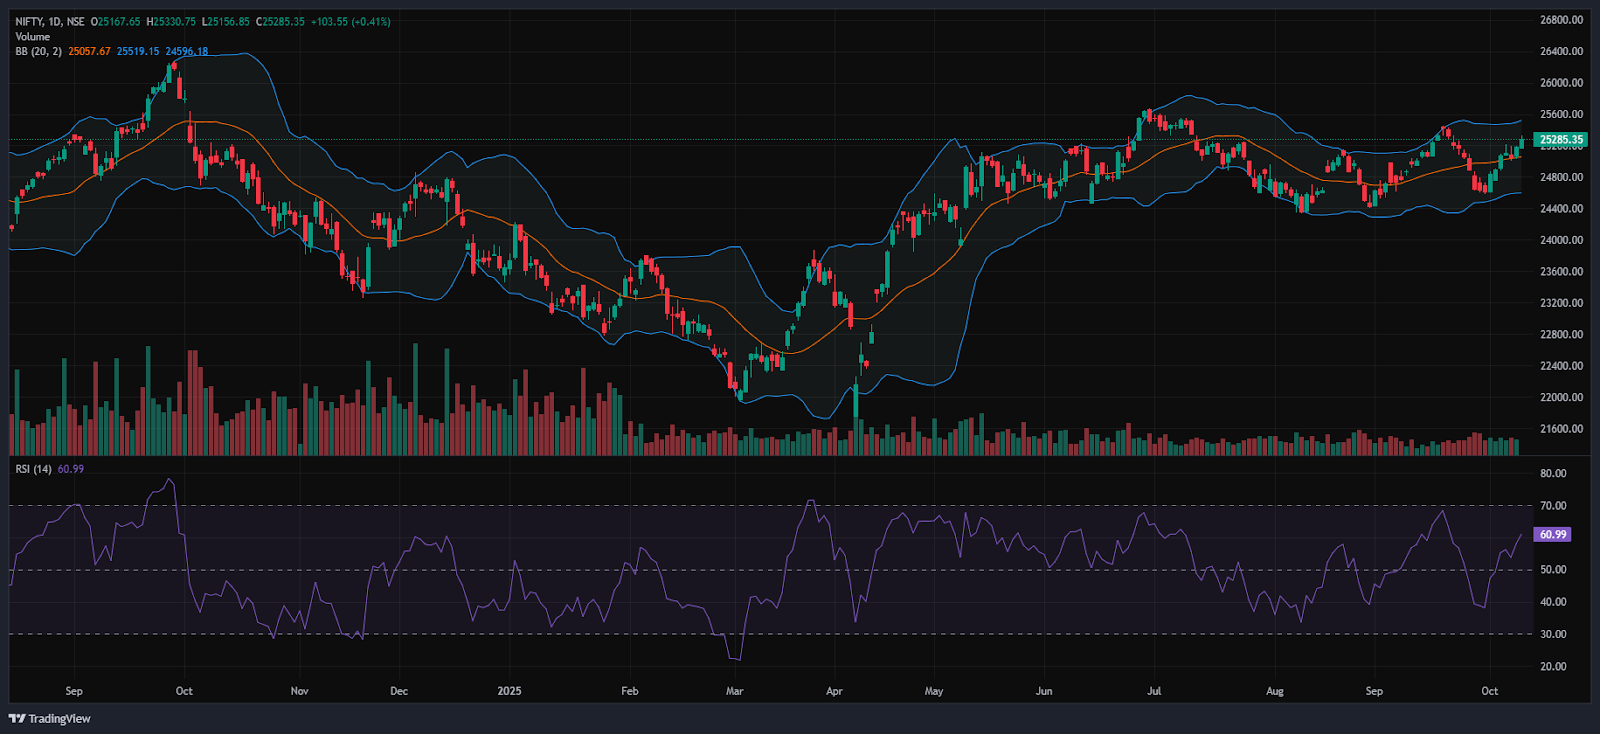
RSI (Daily): The Nifty 50’s RSI stood at 60.99, which is well below the overbought zone of 70, indicating a bullish sentiment and still has room to grow higher.
Bollinger Bands (Daily): The index is trading in the upper band of the Bollinger Band range above the middle band (Simple Moving Average). Its position in the upper range indicates a bullish sentiment and on Friday the Index formed a Strong long body green Candle with an increase in buying volumes; it indicates a Bullish outlook for the next trading session. A sustained move above the middle band signals a bullish sentiment, while a drop back toward the lower band may reinforce bearish sentiment.
Volume Analysis: Friday’s trading session had average volumes, which stood at 232.94 Mn.
Derivatives Data: Options OI indicates strong Put writing at 25,200, following 25,100, establishing it as a firm support zone. On the upside, a significant Call OI buildup at 25,400 and 25,500 suggests a potential resistance supply. PCR (Put/Call Ratio) stands at 1.4068 (>1), leaning towards bearish sentiment and the Short Covering signals a short-term bullish signal, with an overall mixed outlook for the next trading session.
Bank Nifty
(In this analysis, we have used 20/50/100/200 EMAs, where 20 EMA (Red), 50 EMA (Orange), 100 EMA (Light Blue), and 200 EMA (Dark Blue)).
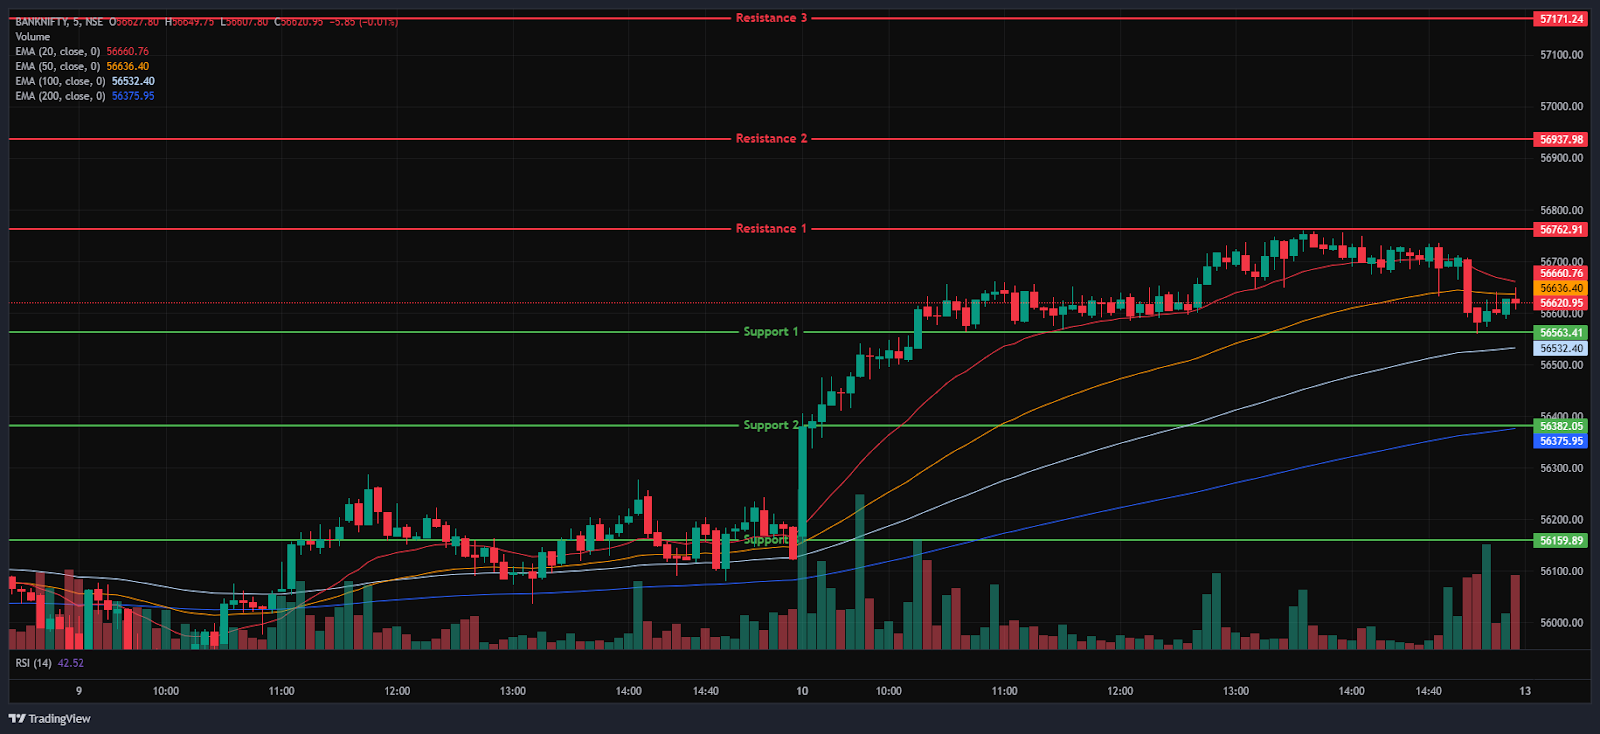
The Bank Nifty Index also started the session on a negative note at 56,168.60 on Friday, down by 23.45 points from Thursday’s closing of 56,192.05. The index was trading between the range of 56,150 and 56,700 in the morning session, indicating high volatility. In addition, the index was trading above all four EMAs of 20/50/100/200 in the 15-minute time frame.
In the afternoon session, the Index consolidated around the range of 56,550 and 56,800, and made its day high at 56,760 and ended in green above its opening level. During the afternoon session, Bank Nifty closed above all four EMAs of 20/50/100/200 in the 15-minute time frame. Bank Nifty immediate resistance levels are R1 (56,763), R2 (56,938), and R3 (57,171), while immediate support levels are S1 (56,563), S2 (56,382), and S3 (56,160).
The Bank Nifty index had peaked at 56,760.25 and made a day’s low at 56,152.45. Finally, it had closed in green at 56,609.75, closing above the 56,600 level, gaining 417.7 points or 0.74%. The Relative Strength Index (RSI) stood at 66.76 well below the overbought zone of 70 in the daily time frame, and Bank Nifty closed above all four EMAs of 20/50/100/200 in the daily time frame.
Sensex
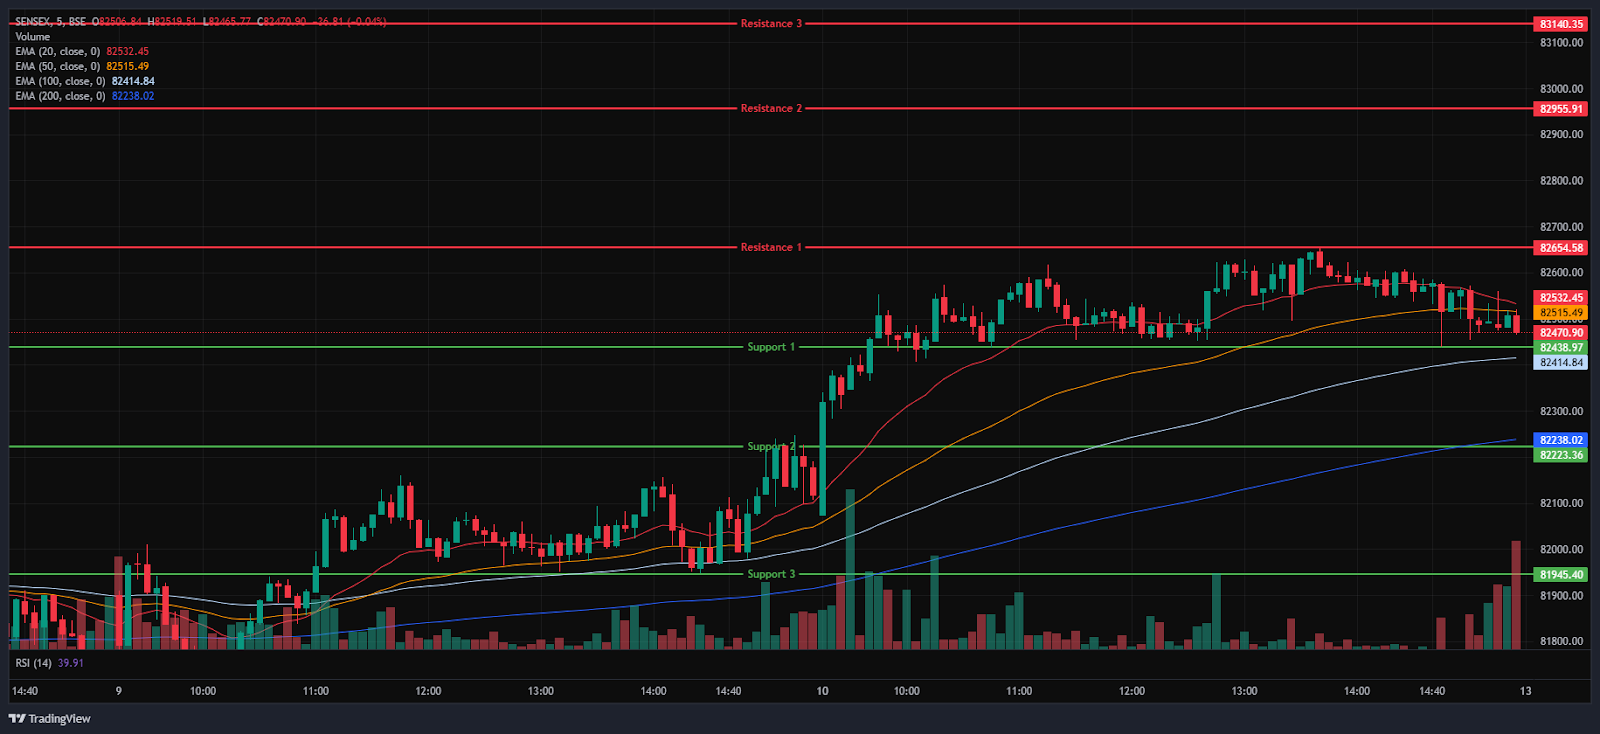
(In this analysis, we have used 20/50/100/200 EMAs, where 20 EMA (Red), 50 EMA (Orange), 100 EMA (Light Blue), and 200 EMA (Dark Blue)).
To view other technical reports, click here
The BSE Sensex Index also opened on a negative note at 82,075.45 on Friday, down by 96.65 points from Thursday’s closing of 82,172.10. The index started its session on a bearish note and was trading in the 82,000 and 82,650 range throughout the morning session and was above all four EMAs of 20/50/100/200 in the 15-minute time frame.
In the afternoon session, the Index further surged as high as the 82,654 level, marking its day high and was traded around 82,400 and 82,700, maintaining its overall bullish trend and the Index closed above the EMAs of 50/100/200 but below the 20-period EMA in the 15-minute time frame. BSE Sensex immediate resistance levels are R1 (82,655), R2 (82,956), and R3 (83,140), while immediate support levels are S1 (82,439), S2 (82,223), and S3 (81,945).
The BSE Sensex index had peaked at 82,654.11 and made a day’s low at 82,072.93. Finally, it had closed at 82,500.82 in green, gaining 328.72 points or 0.40%. The Relative Strength Index (RSI) stood at 60.81 (below the overbought zone of 70) in the daily time frame, and the BSE Sensex closed above all four EMAs of 20/50/100/200 in the daily time frame.
India VIX
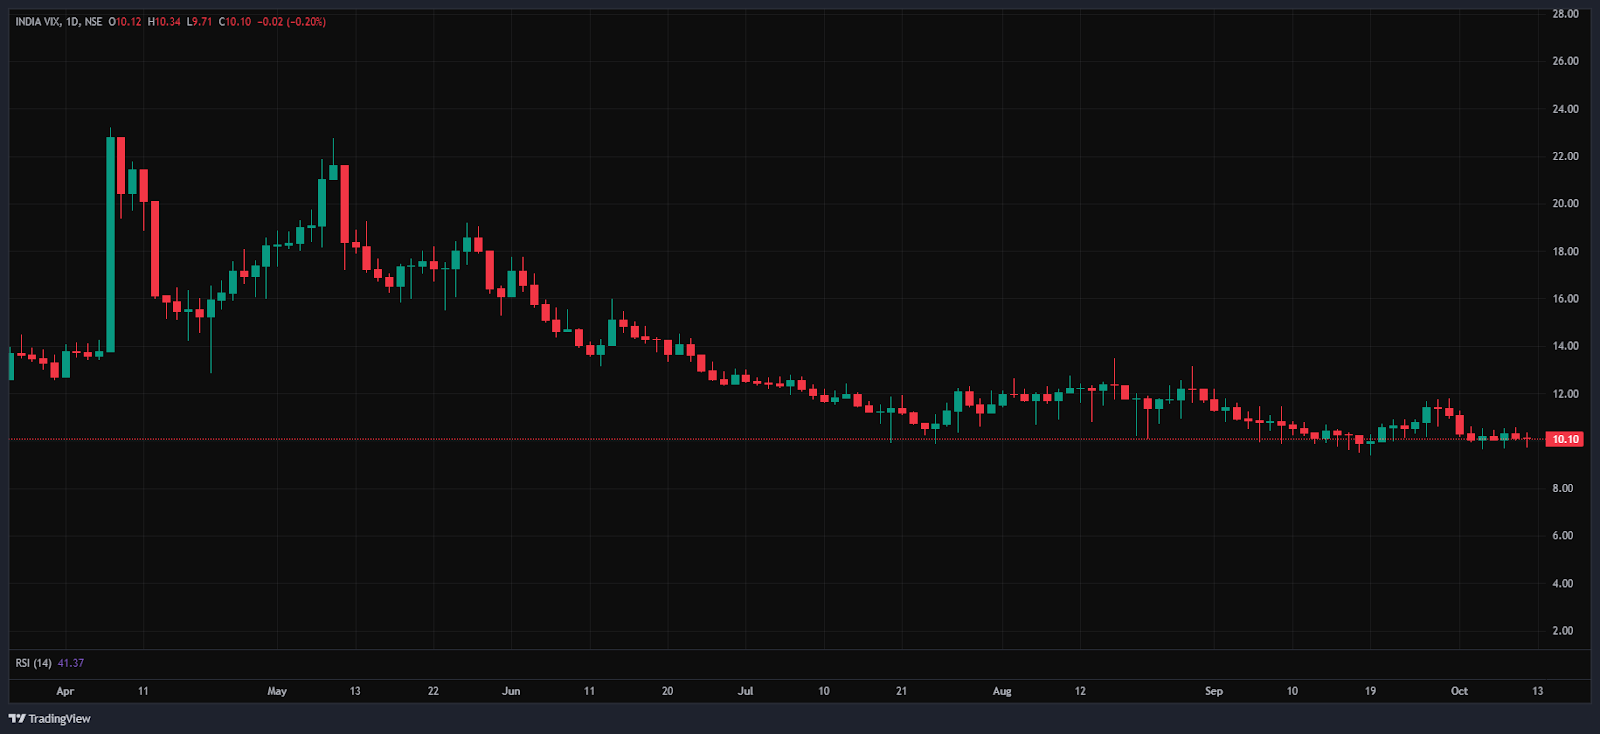
The India VIX decreased by 0.017 points or 0.17%, from 10.12 to 10.10 during Friday’s session. A decrease in the India VIX typically indicates lower price volatility in the stock market, suggesting a more stable market environment. However, a stable market environment and minimal volatility are anticipated when the India VIX is below 15.
Market Recap on the 10th of October 2025
On Friday, the Nifty 50 opened on a mildly negative note at 25,167.65, down by -14.15 points from its previous close of 25,181.80. However, it rebounded during the session, hitting an intraday high of 25,330.75 before closing at 25,285.35, gaining 103.55 points or 0.41%. Technically, the index remained above all key exponential moving averages (20/50/100/200-day EMAs) on the daily chart. The BSE Sensex followed a similar trajectory, opening lower at 82,075.45, a decline of -96.65 points from its previous close of 82,172.10.
It mirrored the Nifty 50’s movement and closed at 82,500.82, rising by 328.72 points or 0.40%. Momentum indicators showed moderate strength, with the RSI for the Nifty 50 at 50.74 and for the Sensex at 50.11, both comfortably below the overbought threshold of 70. The Nifty Bank Index also ended in the green, climbing 417.70 points or 0.74%, to close at 56,609.75.
Most sectoral indices closed in positive territory on Friday. The Nifty Realty Index led the gains, finishing at 896.65, up by 14.75 points or 1.67%. Godrej Properties Ltd rose by 2.97%, while other real estate stocks such as Brigade Enterprises Ltd, Prestige Estates, and SignatureGlobal India posted gains of up to 2.56%.
The Nifty Bank Index also performed strongly, advancing by 126.50 points or 1.67%, to settle at 7,695.80. Stocks like UCO Bank, Indian Overseas Bank, and Punjab & Sind Bank Ltd gained as much as 3.41%. The Nifty Pharma Index also saw a solid uptick, rising 282.05 points or 1.29%, to close at 22,218.25.
Conversely, the Nifty Metal Index was among the major laggards in Friday’s session. It ended the day at 10,261.55, down -94.65 points or -0.91%. Hindustan Copper Ltd was the top decliner, dropping -5.38%, followed by SAIL (-3.14%) and Hindustan Zinc Ltd (-2.72%).
In contrast to the Indian markets, most Asian indices ended the day lower. Hong Kong’s Hang Seng Index dropped by -463.59 points or -1.76%, to close at 26,289.00. China’s Shanghai Composite Index fell by -36.94 points or -0.95%, closing at 3,897.03.
Japan’s Nikkei 225 Index declined by -422.44 points or -0.88%, to finish at 48,158.00. On the other hand, South Korea’s KOSPI Index bucked the trend, rising 61.39 points or 1.70%, to settle at 3,610.60. As of 4:43 p.m. IST, US Dow Jones Futures were trading higher at 46,410.72, up by 50.31 points or 0.11%.
For the week, the Nifty Index rose by 1.57% or 391.10 points, hitting a near one-month high and crossing the 25,300 mark. On Thursday, India and the UK announced details of the Comprehensive Economic and Trade Agreement (CETA) between the two nations. The agreement aims to boost market access and reduce tariffs and is projected to double bilateral trade between the countries by 2030.
Trade Setup Summary
The Nifty 50 opened on a negative note at 25,167.65 on Friday but ended the session in the green above the 25,250 level at 25,285.35. A break below 25,275 could trigger further selling towards 25,221 while breaking the next resistance level of 25,331 could trigger bullishness towards the 25,398 level.
Bank Nifty started the session on a negative note at 56,168.60 but ended the session in the green at 56,609.75, above the 56,600 level. A break below 56,563 could trigger further selling towards 56,382, while breaking the next resistance level of 56,763 could trigger bullishness towards the 56,938 level.
Sensex also opened on a negative note at 82,075.45 but ended the session in the green at 82,500.82, above the 82,500 level. A break below 82,439 could trigger further selling towards 82,223, while breaking the next resistance level of 82,655 could lead towards the 82,956 level.
Given the ongoing volatility and mixed sentiments, it’s advisable to avoid aggressive positions and wait for clear directional moves above resistance or below support. Traders should consider these key support and resistance levels when entering long or short positions following the price break from these critical levels. Additionally, traders can combine moving averages to identify more accurate entry and exit points.
Disclaimer

The views and investment tips expressed by investment experts/broking houses/rating agencies on tradebrains.in are their own, and not that of the website or its management. Investing in equities poses a risk of financial losses. Investors must therefore exercise due caution while investing or trading in stocks. Trade Brains Technologies Private Limited or the author are not liable for any losses caused as a result of the decision based on this article. Please consult your investment advisor before investing.
About: Trade Brains Portal is a stock analysis platform. Its trade name is Dailyraven Technologies Private Limited, and its SEBI-registered research analyst registration number is INH000015729.
Investments in securities are subject to market risks. Read all the related documents carefully before investing.
Registration granted by SEBI and certification from NISM in no way guarantee performance of the intermediary or provide any assurance of returns to investors.
