
On Wednesday, Indian equity markets opened on a positive note and sustained their upward momentum throughout the session, closing with solid gains. Benchmark indices reflected bullish sentiment, supported by broad-based buying across sectors and favourable global cues. Technical indicators remained strong, with both the Nifty 50 and BSE Sensex staying above key moving averages, suggesting ongoing support for the current trend. Market momentum was moderate, indicating strength without entering overbought territory.

Sectorally, most indices ended in the green, with realty, PSU banks, and capital markets leading the rally. Optimism around a potential U.S. Federal Reserve rate cut later this month boosted investor sentiment. However, the media sector was the lone laggard, witnessing mild declines. Global markets also mirrored this positive tone, with key Asian indices closing higher and U.S. futures trading in the green by evening, reinforcing the upbeat mood in the domestic market.
In this overview, we will analyse the key technical levels and trend directions for Nifty and BSE Sensex to monitor in the upcoming trading sessions. All the charts mentioned below are based on the 5-minute timeframe.

Nifty 50
(In this analysis, we have used 20/50/100/200 EMAs, where 20 EMA (Red), 50 EMA (Orange), 100 EMA (Light Blue), and 200 EMA (Dark Blue)).
To view other technical reports, click here
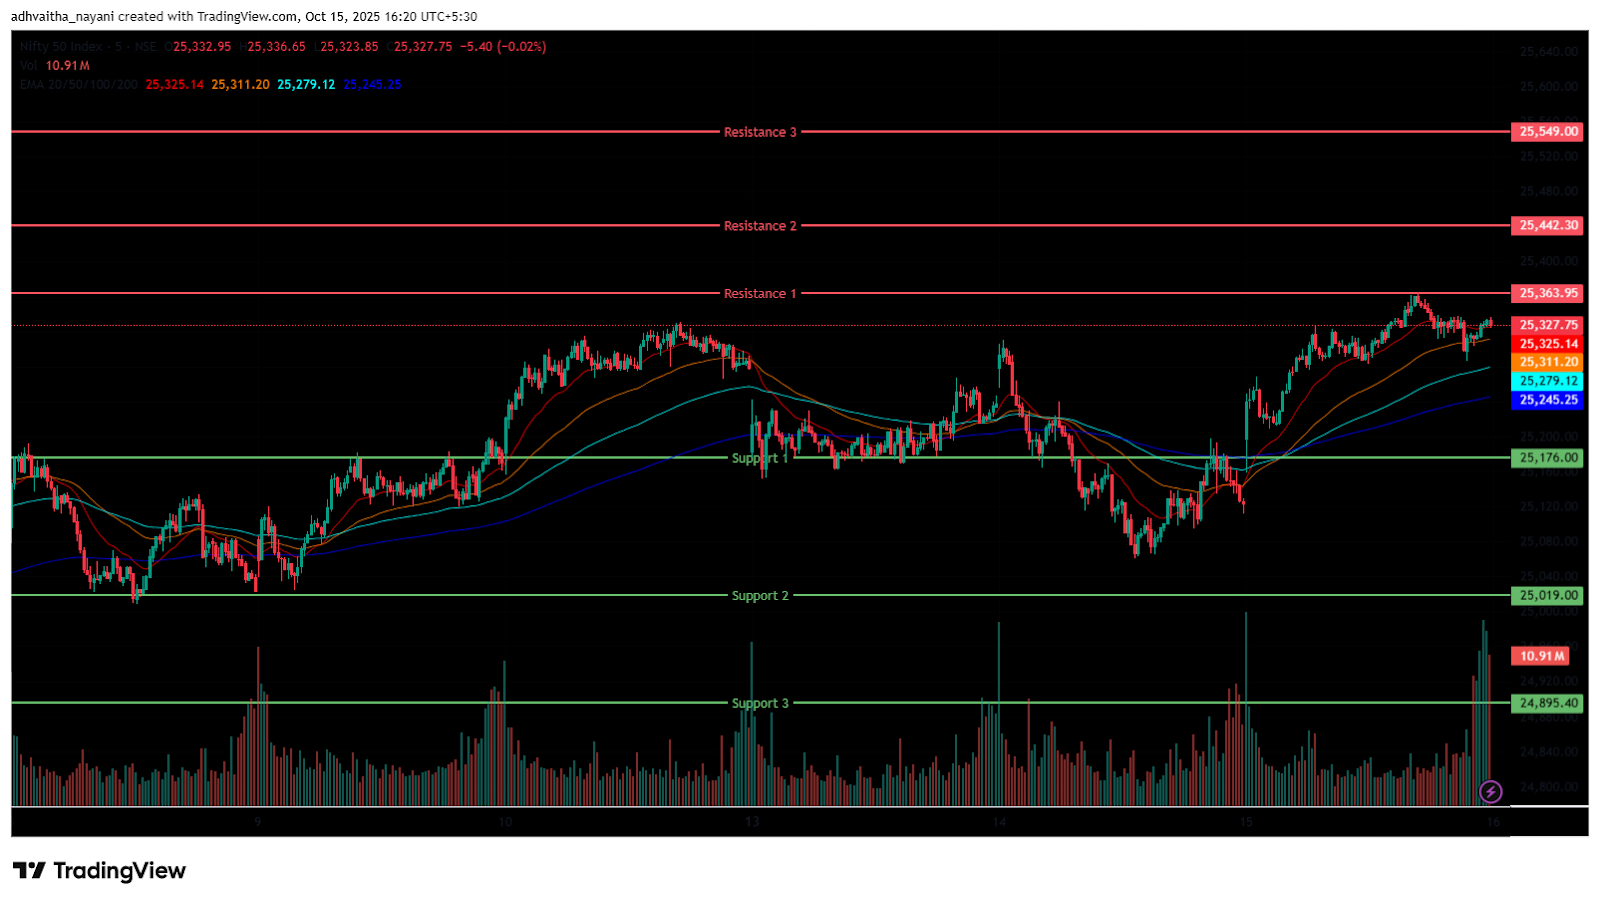
The Nifty 50 Index opened on a positive note at 25,181.95 on Wednesday, up by 36.45 points from Tuesday’s closing of 25,145.50. With a bullish start to the day, the index had a highly volatile morning session, trading in the 25,150 to 25,350 range. Additionally, the Index stood above all four EMAs of 20/50/100/200 in the 15-minute time frame during the morning session.
Further, the index continued its momentum and surged as high as 25,365, marking its day’s high in the afternoon session and was traded in the range of 25,250 and 25,350. During the afternoon session, the Nifty 50 closed above all four EMAs of 20/50/100/200 in the 15-minute time frame. The Nifty’s immediate resistance levels are R1 (25,364), R2 (25,442), and R3 (25,549), while immediate support levels are S1 (25,176), S2 (25,019), and S3 (24,895).

The Nifty index had reached a day’s high at 25,365.15 and saw a day’s low at 25,159.35. Finally, it had closed at 25,323.55, in green above the 25,300 level, gaining 178.05 points, or 0.71%. The Nifty 50 closed above all four EMAs of 20/50/100/200 in the daily time frame.
Momentum Indicators
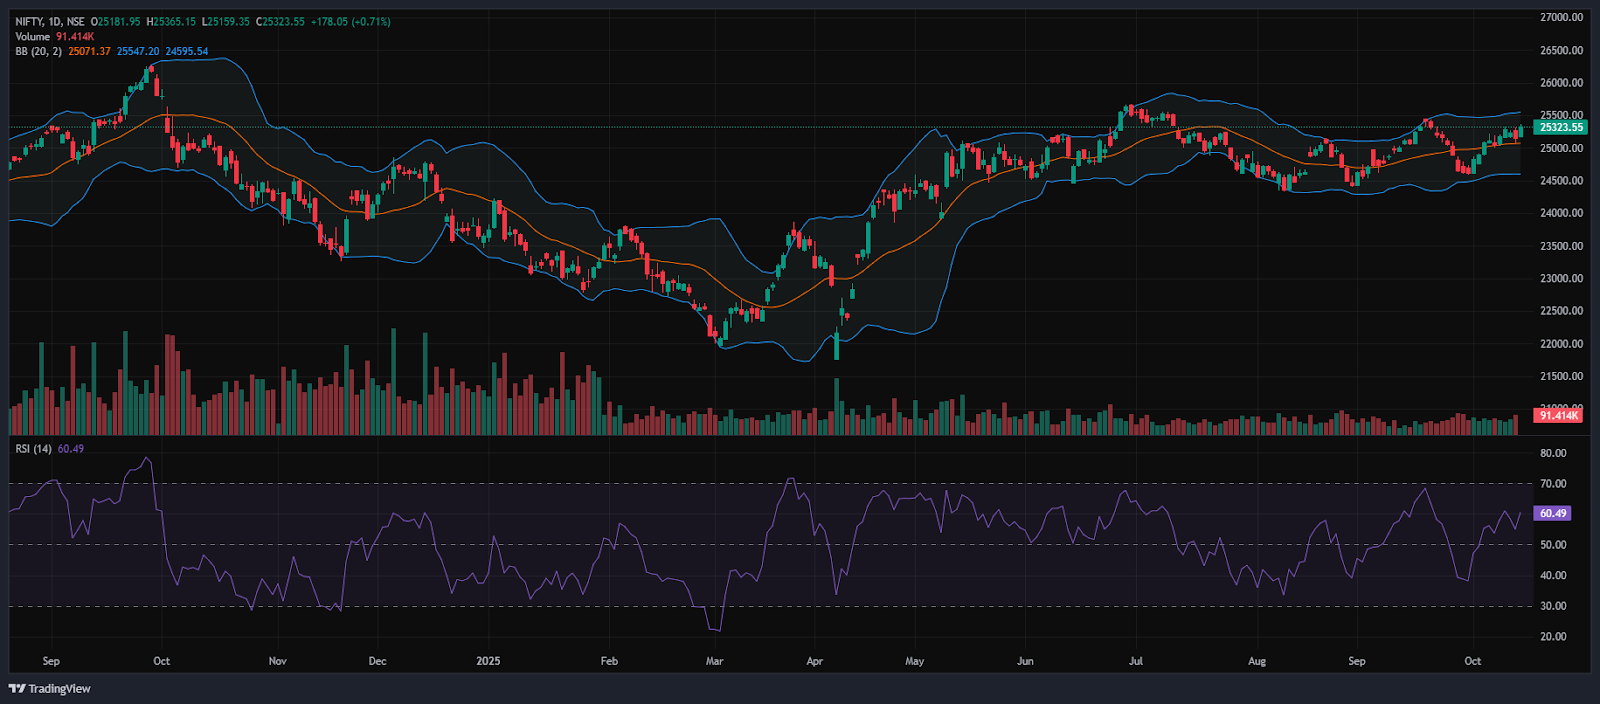
RSI (Daily): The Nifty 50’s RSI stood at 60.49, which is well below the overbought zone of 70, indicating a bullish sentiment and still has room to grow higher.
Bollinger Bands (Daily): The index is trading in the upper band of the Bollinger Band range above the middle band (Simple Moving Average). Its position in the upper range indicates a bullish sentiment, and the Index took support at 25,150 and pulled back to the 25,300 level. A sustained move above the middle band signals a bullish sentiment, while a drop back toward the lower band may reinforce bearish sentiment.
Volume Analysis: Wednesday’s trading session had average volumes, which stood at 289.93 Mn.
Derivatives Data: Options OI indicates strong Put writing at 25,300, followed by 25,200, establishing it as a firm support zone. On the upside, a significant Call OI buildup at 25,400 and 25,500 suggests a potential resistance supply. PCR (Put/Call Ratio) stands at 1.2379 (>1), leaning towards bearish sentiment and the Long Buildup signals a strong bullish signal, with an overall mixed outlook for the next trading session.

Bank Nifty
(In this analysis, we have used 20/50/100/200 EMAs, where 20 EMA (Red), 50 EMA (Orange), 100 EMA (Light Blue), and 200 EMA (Dark Blue)).
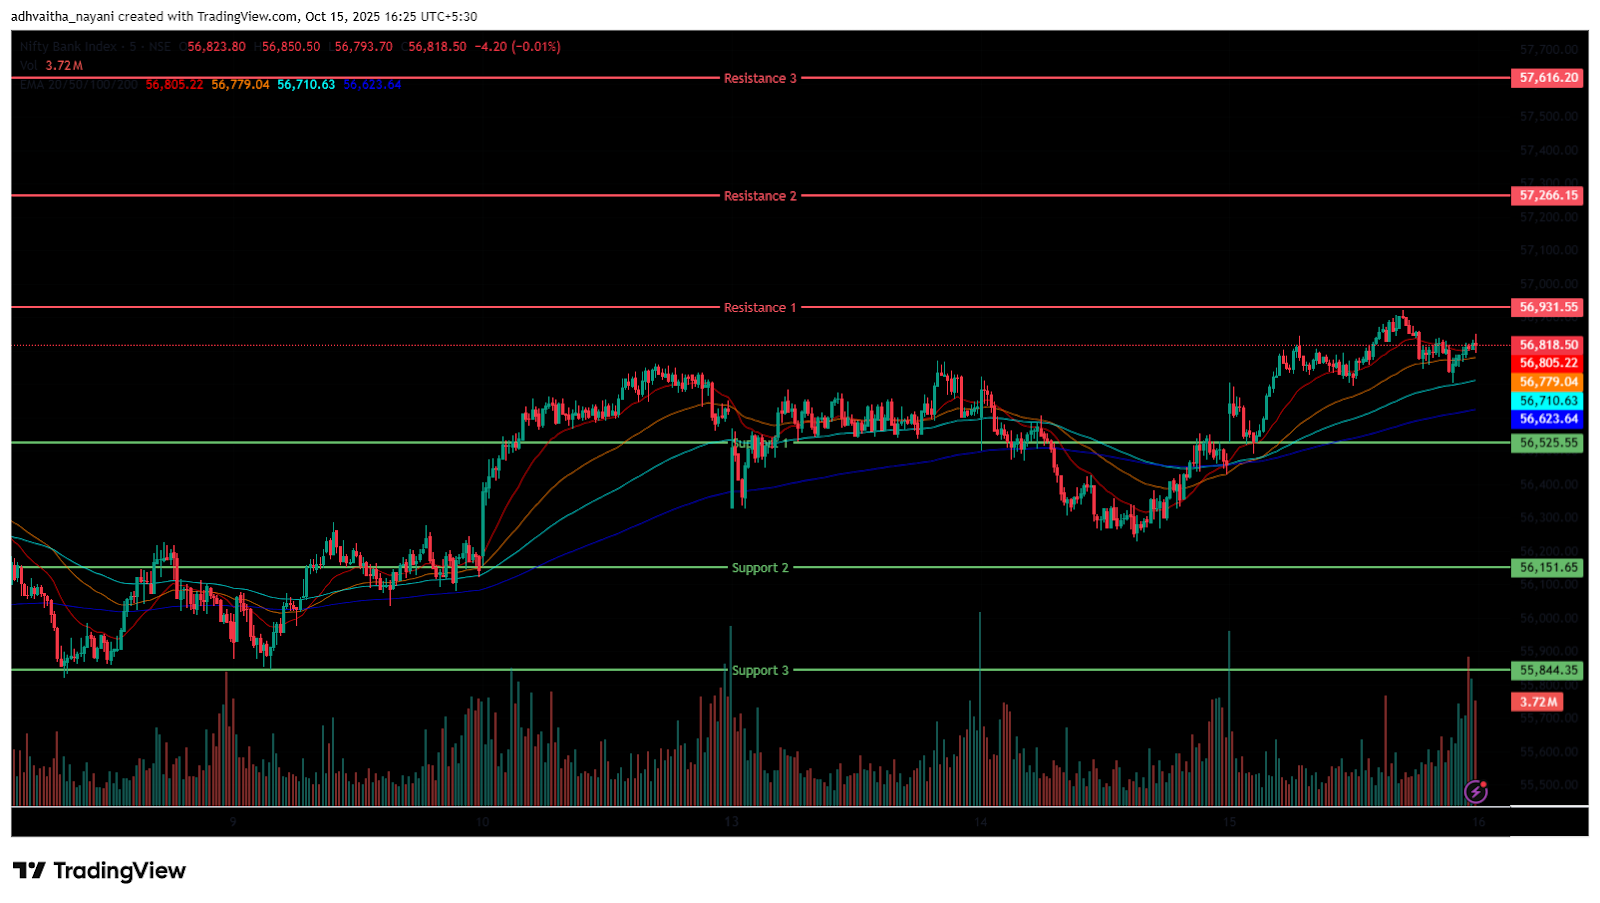
The Bank Nifty Index also started the session on a positive note at 56,528.95 on Wednesday, up by 32.5 points from Tuesday’s closing of 56,496.45. The index was trading between the range of 56,450 and 56,850 in the morning session, indicating high volatility. In addition, the index was trading above all four EMAs of 20/50/100/200 in the 15-minute time frame. In the afternoon session, the Index continued its upward momentum and surged as high as 56,922, marking its day’s high.
Further, the Index was trading in the range of 56,700 and 56,950, and ended in green above its opening level. During the afternoon session, Bank Nifty closed above all four EMAs of 20/50/100/200 in the 15-minute time frame. The Bank Nifty’s immediate resistance levels are R1 (56,932), R2 (57,266), and R3 (57,616), while its immediate support levels are S1 (56,526), S2 (56,152), and S3 (55,844).
The Bank Nifty index had peaked at 56,922.70 and made a day’s low at 56,491.85. Finally, it had closed in green at 56,799.90, closing above the 56,750 level, gaining 303.45 points or 0.54%. The Relative Strength Index (RSI) stood at 67.48, well below the overbought zone of 70 in the daily time frame, and Bank Nifty closed above all four EMAs of 20/50/100/200 in the daily time frame.
Sensex
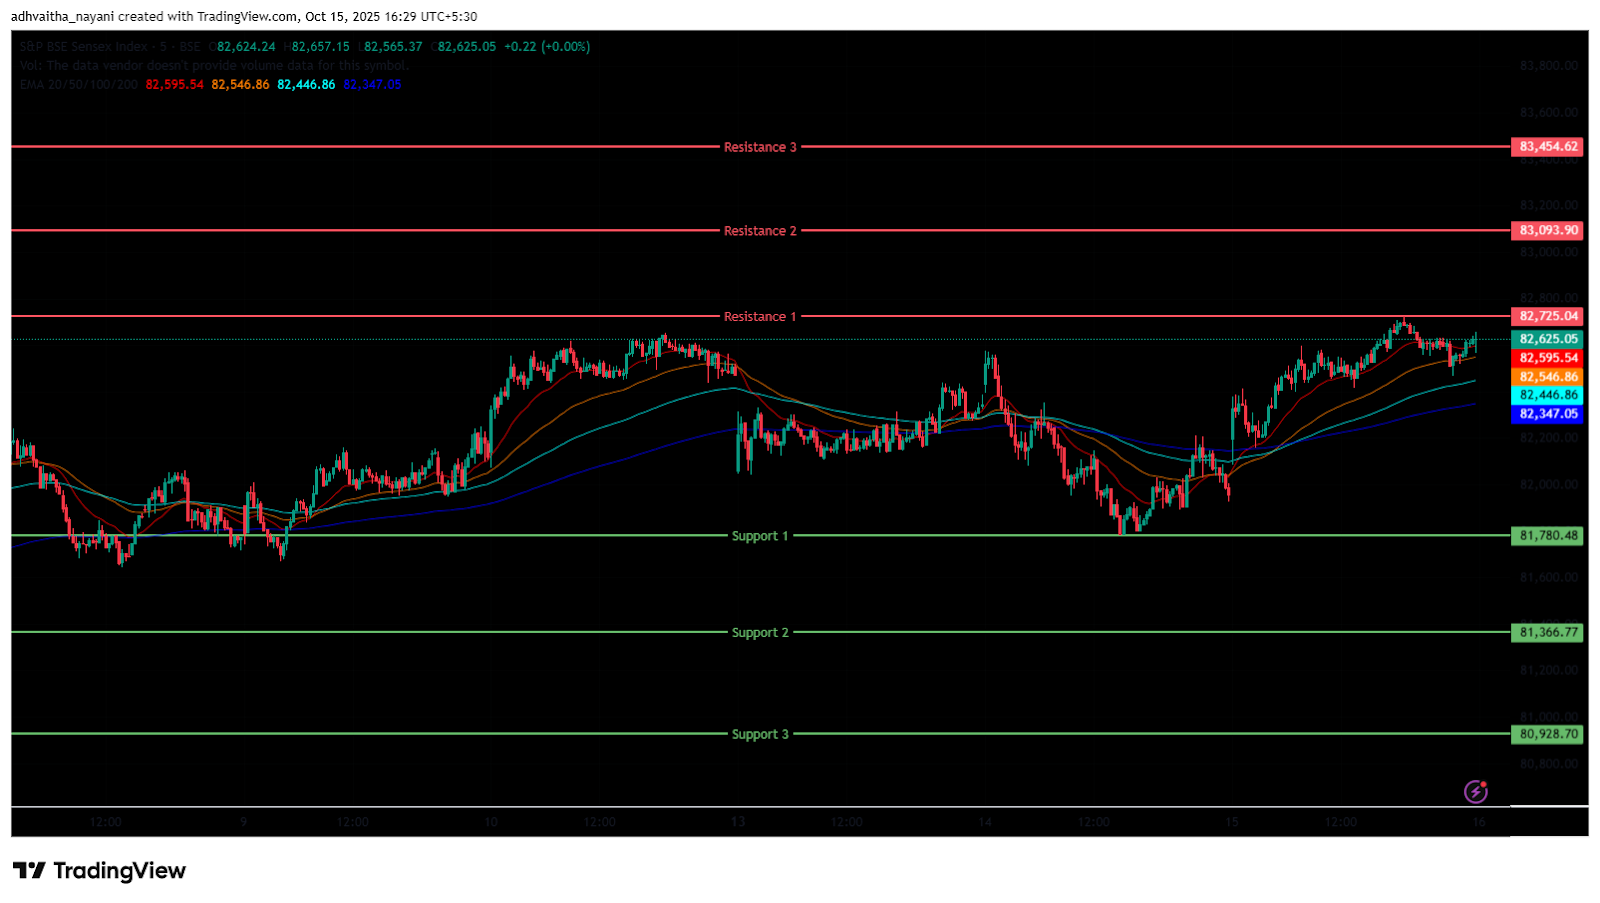
(In this analysis, we have used 20/50/100/200 EMAs, where 20 EMA (Red), 50 EMA (Orange), 100 EMA (Light Blue), and 200 EMA (Dark Blue)).
To view other technical reports, click here
The BSE Sensex Index also opened on a positive note at 82,197.25 on Wednesday, up by 167.27 points from Tuesday’s closing of 82,029.98. The index started its session on a bullish note and was trading in the 82,250 and 82,550 range throughout the morning session, and was above all four EMAs of 20/50/100/200 in the 15-minute time frame.
In the afternoon session, the Index continued to rise and was trading around 82,550 and 82,650, maintaining its overall bullish trend and closing above the EMAs of 20/50/100/200 in the 15-minute time frame. The BSE Sensex immediate resistance levels are R1 (82,725), R2 (83,094), and R3 (83,455), while immediate support levels are S1 (81,780), S2 (81,367), and S3 (80,929).
The BSE Sensex index had peaked at 82,727.02 and made a day’s low at 82,084.37. Finally, it had closed at 82,605.4 in green, gaining 575.45 points or 0.70%. The Relative Strength Index (RSI) stood at 60.12 (below the overbought zone of 70) in the daily time frame, and the BSE Sensex closed above all four EMAs of 20/50/100/200 in the daily time frame.
India VIX
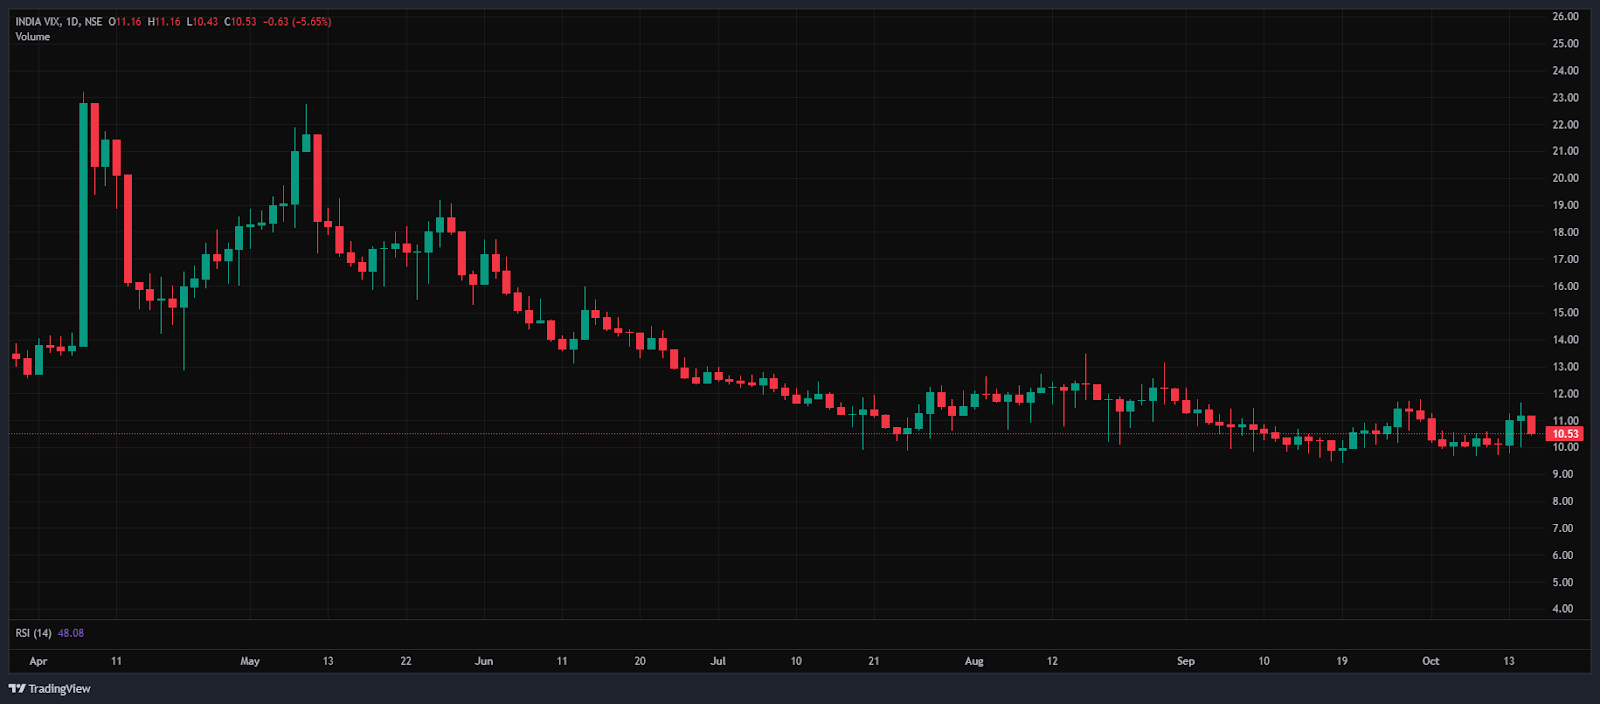
The India VIX decreased by 0.62 points or 5.60%, from 11.16 to 10.53 during Wednesday’s session. A decrease in the India VIX typically indicates lower price volatility in the stock market, suggesting a more stable market environment. However, a stable market environment and minimal volatility are anticipated when the India VIX is below 15.
Market Recap on the 15th of October 2025
On Wednesday, the Nifty 50 opened on a positive note at 25,181.95, up 36.45 points from its previous close of 25,145.5. The index hit an intraday high of 25,365.15, crossing above the 25,350 level, before closing at 25,323.55, up 178.05 points, or 0.71%. The index remained above all key moving averages (20/50/100/200-day EMAs) on the daily chart, indicating some technical support. The BSE Sensex mirrored the Nifty’s trend, opening at 82,197.25, up 167.27 points from the previous close of 82,029.98.
It followed a similar pattern, closing at 82,605.43, a gain of 575.45 points, or 0.70%. Both indices showed moderate momentum, with RSI values for Nifty 50 at 60.49 and Sensex at 60.12, below the overbought threshold of 70. All the major indices remained positive on Wednesday. The Bank Nifty Index ended in positive territory, increasing 303.45 points, or 0.54%, to 56,799.9. The rise was mainly due to the positive cues from global markets amid expectations of a US Federal Reserve rate cut later this month. Furthermore, hopes for an early US-India trade deal amid China tensions boosted market sentiment on Wednesday.
Most of the indices ended in green on Wednesday. The Nifty Realty Index was the biggest gainer, gaining 3%, or 27.05 points, to 915.4. Stocks like Sobha Ltd, Brigade Enterprises Ltd, Prestige Estates Projects and Signature Global saw gains of up to 4.7%. The Nifty PSU Bank Index also posted gains, advancing 1.7%, or 126.6 points, to 7,723.1. Key stocks like Bank of Maharashtra, Indian Overseas Bank, and Punjab & Sind Bank were up by 7.6%.
The Nifty Capital Market Index followed the positive trend, closing at 4,644.85, up 1.4%, or 66 points. Stocks like HDFC AMC Ltd gained 3%, while other capital market stocks such as 360 One Wam Ltd, Nippon Life India AMC and Motilal Oswal Financial Services saw gains of up to 3%. Nifty Media was the only loser for today, declining 0.5% or -8 points, closing at 1,539.25. Media stocks such as DB Corp Ltd, Tips Music Ltd, and Sun TV Network dropped up to -8.4%.
Asian markets followed a positive sentiment as well. Japan’s Nikkei 225 gained 1.76%, increasing 825.35 points, to close at 47,672.67. Hong Kong’s Hang Seng rose by 1.84%, closing at 25,910.6, while China’s Shanghai Composite increased 1.22%, to 3,912.21. Similarly, South Korea’s KOSPI Index rose 2.68%, ending at 3,657.28, and the Shenzhen Component Index was also up 1.73%, closing at 13,118.75. At 5 p.m. IST, U.S. Dow Jones Futures were up 0.4%, at 46,686, a drop of 186 points.
Trade Setup Summary
The Nifty 50 opened on a positive note at 25,181.95 on Wednesday and ended the session in the green above the 25,300 level at 25,323.55. A break below 25,176 could trigger further selling towards 25,019, while breaking the next resistance level of 25,363.9 could trigger bullishness towards the 25,442 level.
Bank Nifty also started the session on a positive note at 56,528.95 and ended the session in the green at 56,799.9, at the 56,800 level. A break below 56,526 could trigger further selling towards 56,152, while breaking the next resistance level of 56,932 could trigger bullishness towards the 57,266 level.
Sensex also opened on a positive note at 82,197.25 and also ended the session in the green at 82,605.43, near the 82,600 level. A break below 81,780 could trigger further selling towards 81,367, while breaking the next resistance level of 82,725 could lead towards the 83,094 level.
Given the ongoing volatility and mixed sentiments, it’s advisable to avoid aggressive positions and wait for clear directional moves above resistance or below support. Traders should consider these key support and resistance levels when entering long or short positions following the price break from these critical levels. Additionally, traders can combine moving averages to identify more accurate entry and exit points.
Disclaimer

The views and investment tips expressed by investment experts/broking houses/rating agencies on tradebrains.in are their own, and not that of the website or its management. Investing in equities poses a risk of financial losses. Investors must therefore exercise due caution while investing or trading in stocks. Trade Brains Technologies Private Limited or the author are not liable for any losses caused as a result of the decision based on this article. Please consult your investment advisor before investing.
About: Trade Brains Portal is a stock analysis platform. Its trade name is Dailyraven Technologies Private Limited, and its SEBI-registered research analyst registration number is INH000015729.
Investments in securities are subject to market risks. Read all the related documents carefully before investing.
Registration granted by SEBI and certification from NISM in no way guarantee performance of the intermediary or provide any assurance of returns to investors.


