

On Thursday, Indian equity markets ended the session on a strong note, with benchmark indices registering notable gains across the board. The Nifty 50 and the BSE Sensex opened higher and maintained upward momentum throughout the day, supported by strong buying interest in banking, FMCG, realty, and consumer durable stocks. Both indices comfortably held above key technical levels, reflecting bullish sentiment and sustained strength in the broader market trend. Positive cues from global markets, optimism around India-US trade developments, and steady foreign institutional investments further lifted investor confidence.

Sectorally, most indices closed in the green, led by robust performances in FMCG, realty, and consumer durables. Banking stocks also contributed significantly to the rally, pushing the Bank Nifty into positive territory. However, PSU stocks were the only laggards, witnessing mild profit booking. The overall market breadth remained positive, and momentum indicators showed continued strength without entering overbought territory. Meanwhile, Asian markets reflected a mixed tone, while U.S. futures pointed to a cautiously optimistic start ahead of key economic cues.

In this overview, we will analyze the key technical levels and trend directions for Nifty and BSE Sensex to monitor in the upcoming trading sessions. All the charts mentioned below are based on the 5-minute timeframe.
Nifty 50
(In this analysis, we have used 20/50/100/200 EMAs, where 20 EMA (Red), 50 EMA (Orange), 100 EMA (Light Blue), and 200 EMA (Dark Blue)).
To view other technical reports, click here
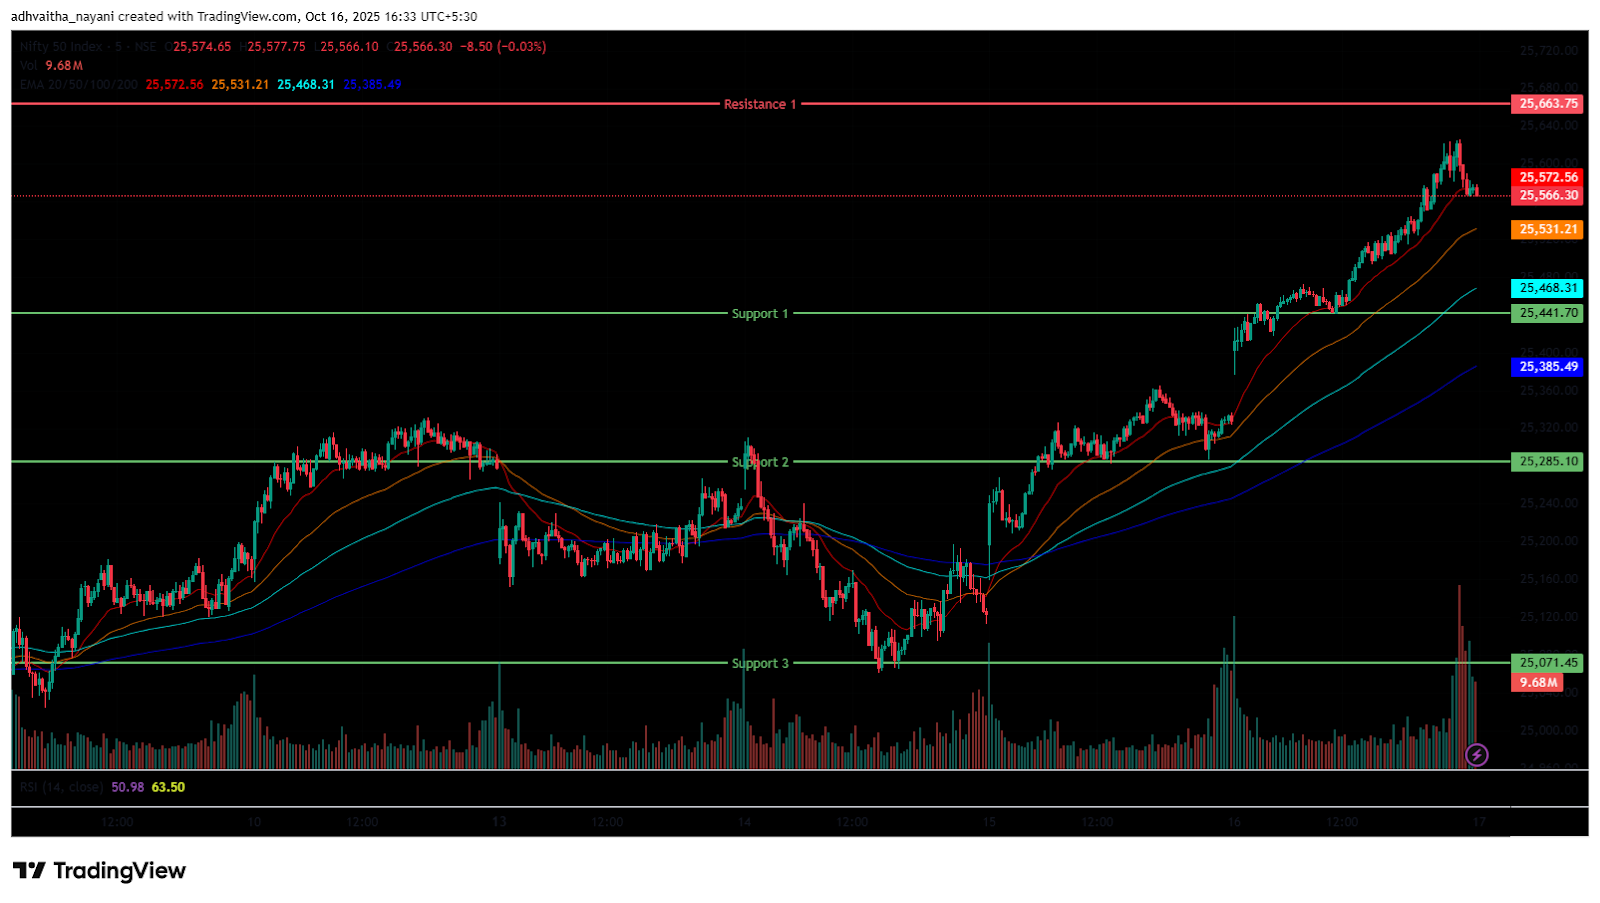
The Nifty 50 Index opened on a positive note at 25,394.9 on Thursday, up by 71.35 points from Wednesday’s closing of 25,323.55. With a bullish start to the day, the index had an overall bullish morning session, trading in the 25,400 to 25,500 range. Additionally, the Index stood above all four EMAs of 20/50/100/200 in the 15-minute time frame during the morning session. Further, the index continued its momentum and surged as high as 25,625.4, marking its day’s high in the afternoon session, crossing above the 25,600 mark and trading in the range of 25,500 and 25,600.
During the afternoon session, the Nifty 50 closed above all four EMAs of 20/50/100/200 in the 15-minute time frame. The Nifty 50 is trading near its 52-week high of 25,669.35. The Nifty’s immediate resistance level is at 25,663.75, while immediate support levels are S1 (25,441.7), S2 (25,285.1), and S3 (25,071.45).
The Nifty index had reached a day’s high at 25,625.4 and saw a day’s low at 25,376.85. Finally, it had closed at 25,585.3, in green above the 25,550 level, gaining 261.75 points, or 1.03%. The Nifty 50 closed above all four EMAs of 20/50/100/200 in the daily time frame.
Momentum Indicators
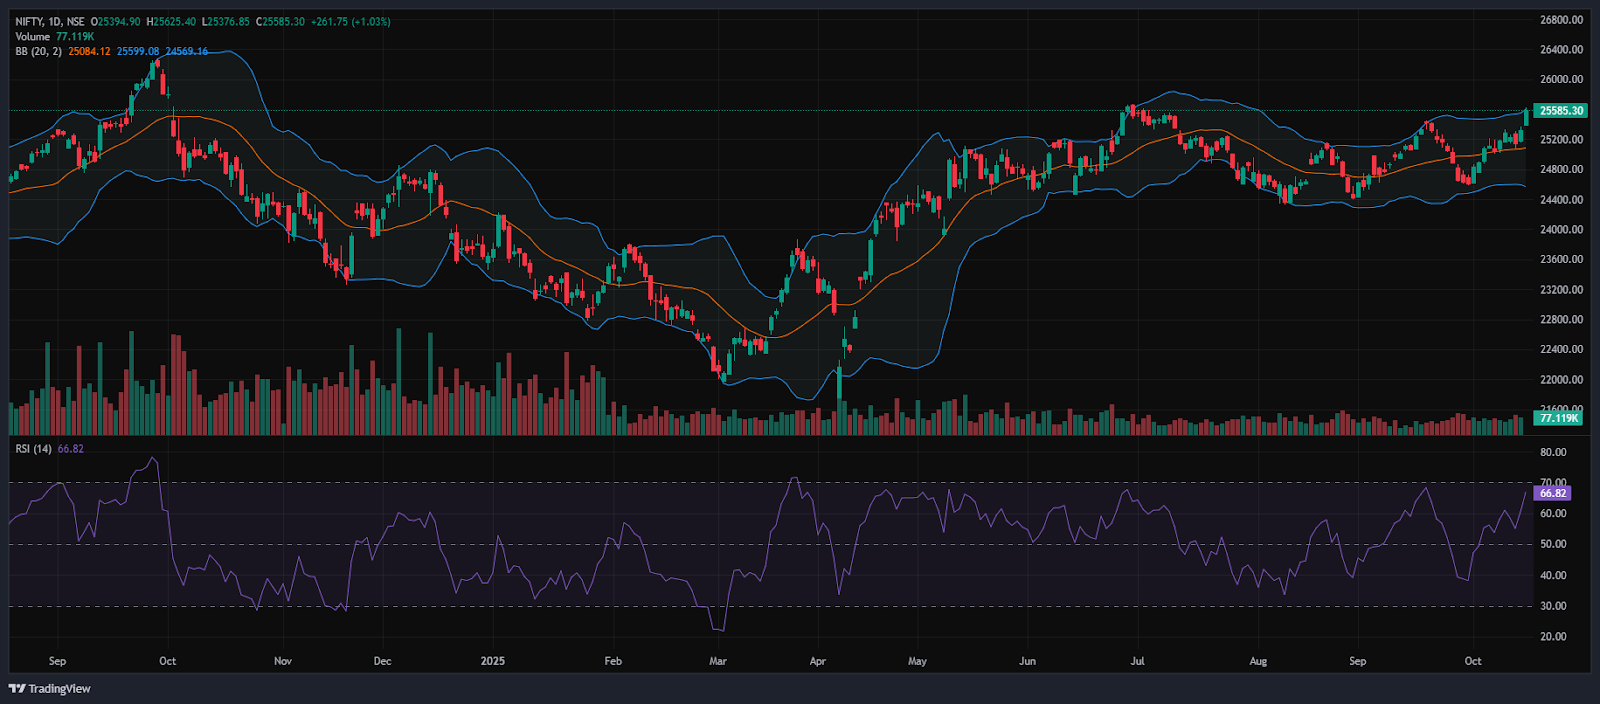
RSI (Daily): The Nifty 50’s RSI stood at 66.82, which is nearing the overbought zone of 70, indicating a bullish sentiment and a potential reversal.
Bollinger Bands (Daily): The index is trading in the upper band of the Bollinger Band range above the middle band (Simple Moving Average). Its position in the upper range indicates a bullish sentiment, and the Index took support near the 25,350 and 25,600 acted as a resistance level. A sustained move above the middle band signals a bullish sentiment, while a drop back toward the lower band may reinforce bearish sentiment.
Volume Analysis: Thursday’s trading session had above-average volumes, which stood at 372.78 Mn.
Derivatives Data: Options OI indicates strong Put writing at 25,500, followed by 25,400, establishing it as a firm support zone. On the upside, a significant Call OI buildup at 25,600 and 25,700 suggests a potential resistance supply. PCR (Put/Call Ratio) stands at 1.54 (>1), leaning towards bearish sentiment, and the short covering signals a short-term bullish signal, with an overall mixed outlook for the next trading session.
Bank Nifty
(In this analysis, we have used 20/50/100/200 EMAs, where 20 EMA (Red), 50 EMA (Orange), 100 EMA (Light Blue), and 200 EMA (Dark Blue)).
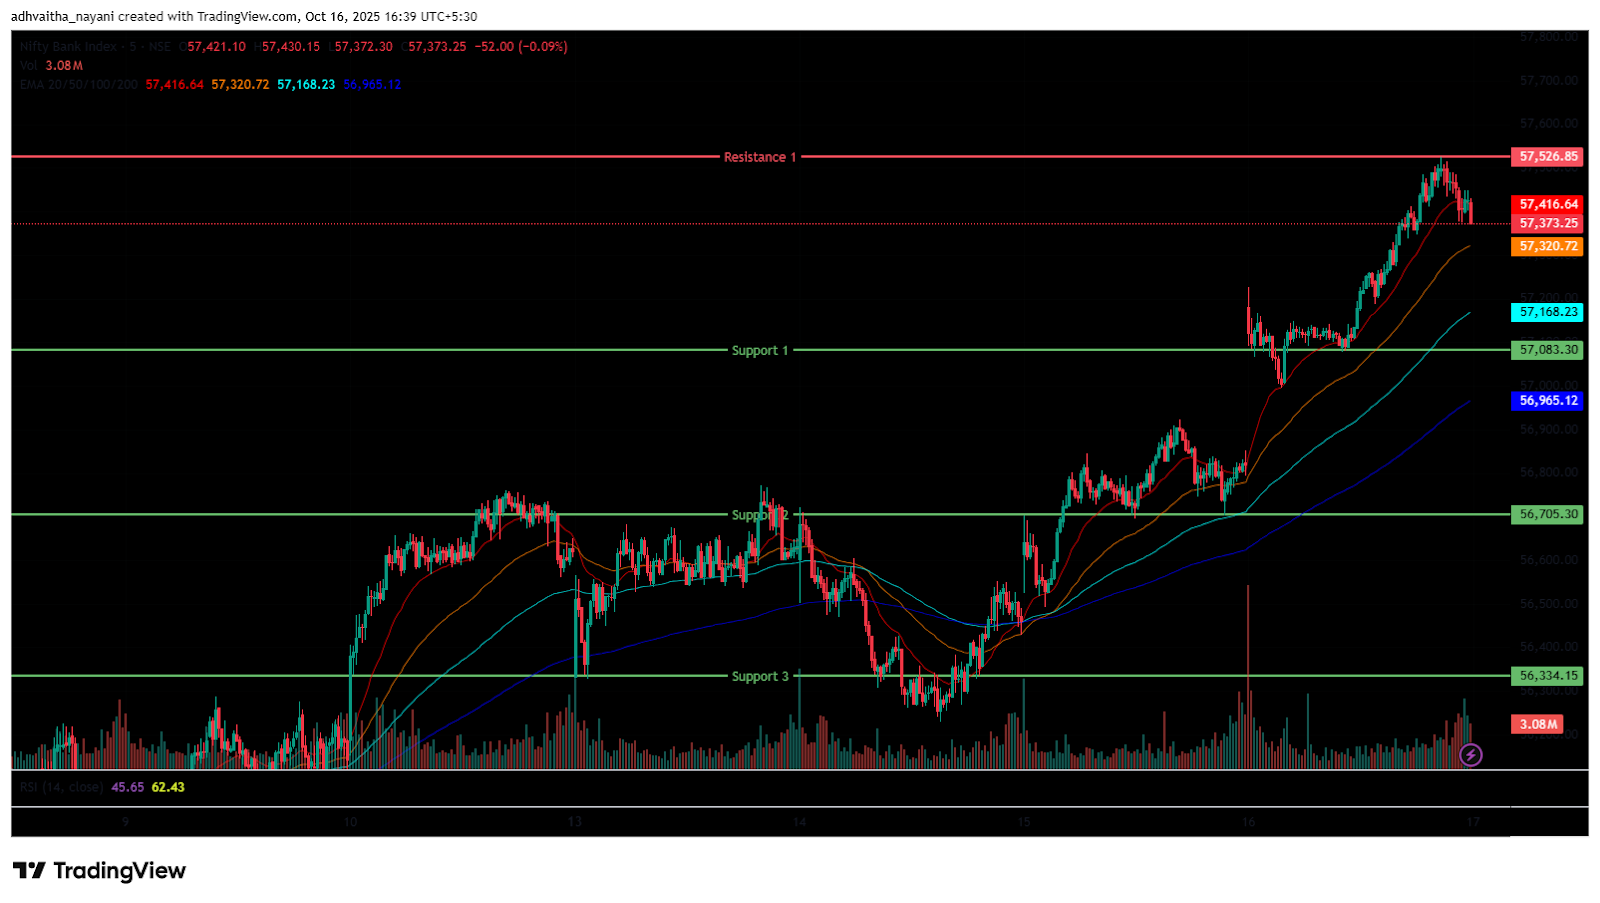
The Bank Nifty Index also started the session on a positive note, opening with a gap up at 57,139.95 on Thursday, up 340.05 points from Wednesday’s closing of 56,799.9. The index was trading between the range of 57,140 and 57,240 in the morning session, mostly on a sideways trend. In addition, the index was trading above all four EMAs of 20/50/100/200 in the 15-minute time frame. In the afternoon session, the Index continued its upward momentum and surged as high as 57,525.8, trading near its 52-week high of 57,628.40.
Further, the Index was trading in the range of 57,250 and 57,500, and ended in green above its opening level. During the afternoon session, Bank Nifty closed above all four EMAs of 20/50/100/200 in the 15-minute time frame. The Bank Nifty’s immediate resistance level is at 57,526.85, while its immediate support levels are S1 (57,083.3), S2 (56,705.3), and S3 (56,334.15).
The Bank Nifty index had peaked at 57,525.8 and made a day’s low at 56,994.7. Finally, it had closed in green at 57,422.55, closing above the 57,400 level, gaining 622.65 points or 1.10%. The Relative Strength Index (RSI) stood at 72.64, entering the overbought zone of 70 in the daily time frame, and Bank Nifty closed above all four EMAs of 20/50/100/200 in the daily time frame.
Sensex
(In this analysis, we have used 20/50/100/200 EMAs, where 20 EMA (Red), 50 EMA (Orange), 100 EMA (Light Blue), and 200 EMA (Dark Blue)).
To view other technical reports, click here
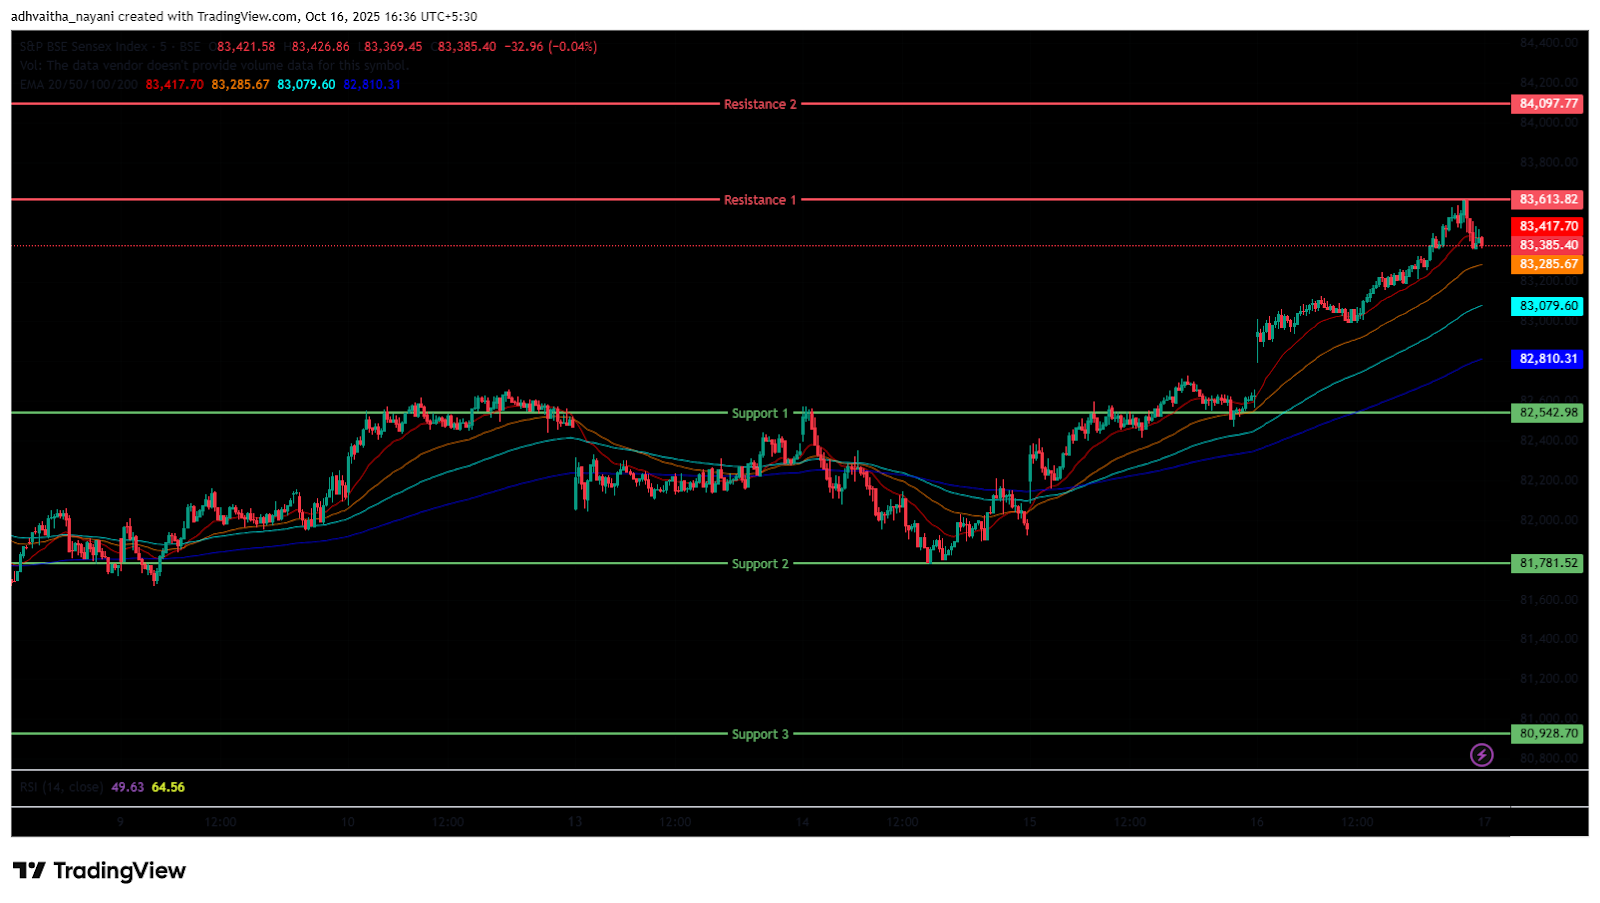
The BSE Sensex Index also opened on a positive note at 82,794.79 on Thursday, up by 189.4 points from Wednesday’s closing of 82,605.43. The index started its session on a bullish note and was trading in the 82,800 and 83,000 range throughout the morning session and was above all four EMAs of 20/50/100/200 in the 15-minute time frame.
In the afternoon session, the Index continued to rise and was trading around 83,200 and 83,600, maintaining its overall bullish trend and closing above the EMAs of 20/50/100/200 in the 15-minute time frame. The BSE Sensex immediate resistance levels are R1 (83,614) and R2 (84,098), while immediate support levels are S1 (82,543), S2 (81,782), and S3 (80,929).
The BSE Sensex index had peaked at 83,615.48 and made a day’s low at 82,791.35. Finally, it had closed at 83,468 in green, gaining 862.23 points or 1.04%. The Relative Strength Index (RSI) stood at 66.56, nearing towards the overbought zone of 70 in the daily time frame, and the BSE Sensex closed above all four EMAs of 20/50/100/200 in the daily time frame.
India VIX
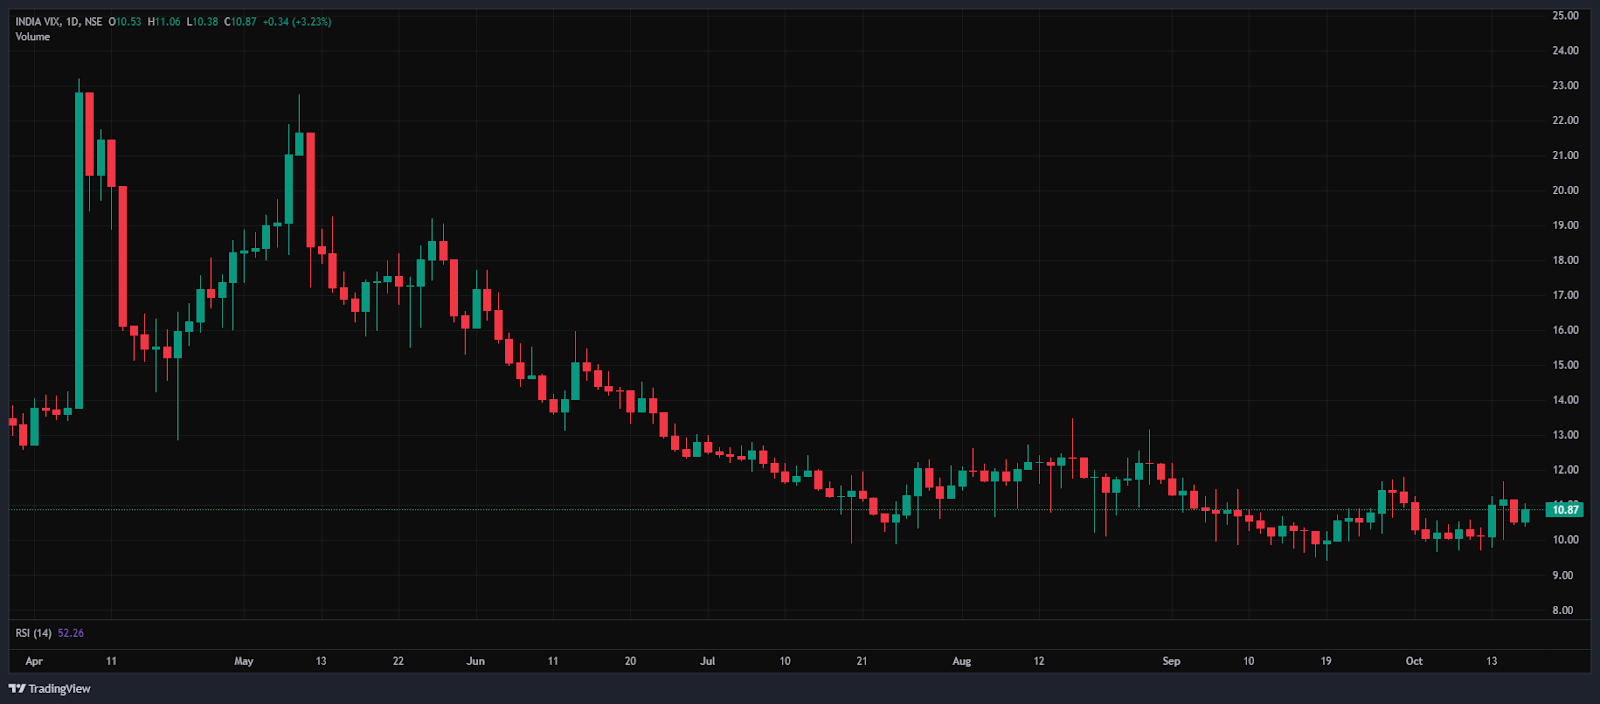
The India VIX increased by 0.34 points or 3.18%, from 10.53 to 10.86 during Thursday’s session. An increase in the India VIX typically indicates higher price volatility in the stock market, suggesting a less stable market environment. However, a stable market environment and minimal volatility are anticipated when the India VIX is below 15.
Market Recap – 16th October 2025
On Thursday, the Nifty 50 opened on a positive note at 25,394.9, rising 71.35 points from its previous close of 25,323.55. The index touched an intraday high of 25,625.4, crossing the 25,600 mark, before settling at 25,585.3, up 261.75 points, or 1.03%. The Nifty remained above all key moving averages (20/50/100/200-day EMAs) on the daily chart, signalling continued technical strength.
The BSE Sensex moved in tandem with the Nifty, opening at 82,794.79, up 189.36 points from its previous close of 82,605.43. It followed a similar upward trajectory, closing at 83,467.66, a gain of 862.23 points, or 1.04%. Both benchmarks exhibited moderate momentum, with the Relative Strength Index (RSI) at 66.82 for the Nifty 50 and 66.56 for the Sensex, approaching the overbought zone near 70.
Major indices remained in the green on Thursday. The Bank Nifty Index also ended on a strong note, rising 622.65 points, or 1.1%, to close at 57,422.55. The upmove was supported by gains in banking shares, steady foreign inflows (FIIs invested Rs 68.64 crore, while DIIs bought shares worth Rs 4,650.08 crore on Wednesday), improved investor sentiment amid India-US trade expectations, and positive global cues, including hopes of a U.S. Federal Reserve rate cut.
Most sectoral indices closed in the green on Thursday. The Nifty FMCG Index emerged as the top gainer, climbing 2%, or 1,105.2 points, to 55,853.9. Stocks such as Nestle India Ltd, Varun Beverages Ltd, Tata Consumer Products Ltd, and Britannia Industries recorded gains of up to 2.9%. The Nifty Realty Index also saw strong momentum, rising 1.9%, or 17.4 points, to 932.8.
Key constituents including Oberoi Realty, Godrej Properties, Sobha Ltd, and Signatureglobal Ltd were up by as much as 5.4%. The Nifty Consumer Durable Index maintained the positive sentiment, ending at 38,752.1, up 1.5%, or 584.05 points. Whirlpool of India Ltd led the pack with a 4.6% gain, while Titan Company Ltd and Blue Star Ltd added up to 2.6%.
The Nifty PSU Index was the only sectoral index to end in the red, slipping 0.4%, or 34.35 points, to close at 7,688.75. PSU banking stocks like Bank of Maharashtra, Indian Overseas Bank, and Bank of Baroda declined by up to 2.8%.
Asian markets showed mixed trends through the day. Japan’s Nikkei 225 advanced 1.27%, gaining 605.07 points to close at 48,277.74. Hong Kong’s Hang Seng edged lower by 0.09%, ending at 25,888.51, while China’s Shanghai Composite added 0.1% to close at 3,916.22. South Korea’s KOSPI Index posted a strong gain of 2.49%, finishing at 3,748.37, whereas the Shenzhen Component Index declined 0.25%, settling at 13,086.40. As of 4:43 p.m. IST, U.S. Dow Jones Futures were trading 0.41% higher at 46,681, a drop of 189 points.
Trade Setup Summary
The Nifty 50 opened on a positive note at 25,394.9 on Thursday and ended the session in the green above the 25,550 level at 25,585.3. A break below 25,441.7 could trigger further selling towards 25,285.1, while breaking the nearest resistance level at 25,663.75 could trigger further bullishness.
Bank Nifty also started the session on a positive note at 57,139.9 and ended the session in the green at 57,422.5, at the 57,400 level. A break below 57,083 could trigger further selling towards 56,705.3, while breaking the nearest resistance level at 57,526.85 could trigger further bullishness.
Sensex also opened on a positive note at 82,794.8 and also ended the session in the green at 83,468, near the 83,450 level. A break below 82,543 could trigger further selling towards 81,782, while breaking the next resistance level of 83,614 could lead towards the 84,098 level.
Given the ongoing volatility and mixed sentiments, it’s advisable to avoid aggressive positions and wait for clear directional moves above resistance or below support. Traders should consider these key support and resistance levels when entering long or short positions following the price break from these critical levels. Additionally, traders can combine moving averages to identify more accurate entry and exit points.
Disclaimer

The views and investment tips expressed by investment experts/broking houses/rating agencies on tradebrains.in are their own, and not that of the website or its management. Investing in equities poses a risk of financial losses. Investors must therefore exercise due caution while investing or trading in stocks. Trade Brains Technologies Private Limited or the author are not liable for any losses caused as a result of the decision based on this article. Please consult your investment advisor before investing.
About: Trade Brains Portal is a stock analysis platform. Its trade name is Dailyraven Technologies Private Limited, and its SEBI-registered research analyst registration number is INH000015729.
Investments in securities are subject to market risks. Read all the related documents carefully before investing.
Registration granted by SEBI and certification from NISM in no way guarantee performance of the intermediary or provide any assurance of returns to investors.
