
Equity markets began the week on a strong footing, with benchmark indices extending their upward momentum. Both the Nifty 50 and BSE Sensex opened higher and maintained a positive trajectory throughout Monday’s session, supported by strong buying interest across sectors. The Bank Nifty also displayed bullish strength, hitting a fresh 52-week high and reflecting continued optimism in the financial space.

During Tuesday’s special Muhurat trading session, markets continued to exhibit a bullish undertone, albeit with a more measured pace. While headline indices opened higher and briefly touched fresh 52-week highs, they closed on a relatively flat note amid mild profit booking. Despite this, all three major indices held above key moving averages on the daily charts, signalling sustained strength in the broader trend. Momentum indicators also suggested overbought conditions, particularly in the banking and large-cap spaces, indicating a market that remains strong but potentially due for some consolidation.

In this overview, we will analyse the key technical levels and trend directions for Nifty and BSE Sensex to monitor in the upcoming trading sessions. All the charts mentioned below are based on the 5-minute timeframe.
Nifty 50
(In this analysis, we have used 20/50/100/200 EMAs, where 20 EMA (Red), 50 EMA (Orange), 100 EMA (Light Blue), and 200 EMA (Dark Blue)).
To view other technical reports, click here
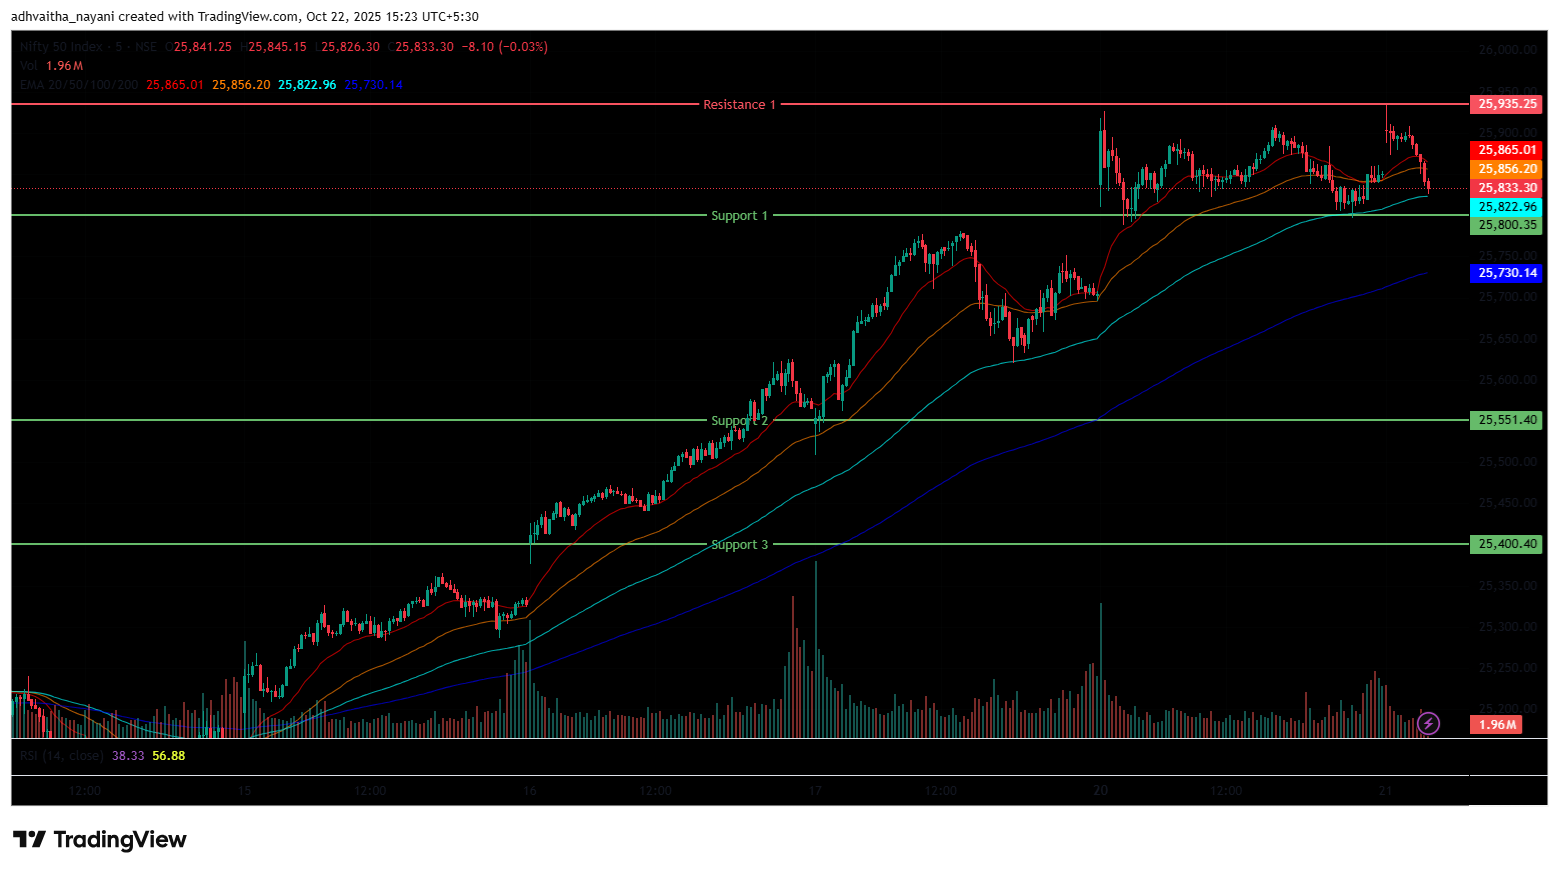
The Nifty 50 Index opened on a positive note at 25,838 on Monday, up by 133.3 points from Friday’s closing of 25,704.7. With a bullish start to the day. The index had an overall bullish morning session and surged as high as 25,926, marking its day’s high in the morning session, trading in the 25,750 to 25,950 range. Additionally, the Index stood above all four EMAs of 20/50/100/200 in the 15-minute time frame during the morning session.
In the afternoon session, the index declined and settled above the 25,851 level and was trading in the range of 25,750 and 25,950. During the afternoon session, the Nifty 50 closed above all four EMAs of 20/50/100/200 in the 15-minute time frame. The Nifty’s immediate resistance level is at R1 (25,935), while immediate support levels are S1 (25,800), S2 (25,551), and S3 (25,400).
On Monday, the Nifty index had reached a day’s high at 25,926 and saw a day’s low at 25,797. Finally, it had closed at 25,850.70, in green above the 25,800 level, gaining 146 points, or 0.56%. The Nifty 50 closed above all four EMAs of 20/50/100/200 in the daily time frame. On Tuesday, in the Muhurat Trading session, the Nifty Index opened on a positive note at 25,901 but ended at 25,868.60.
Momentum Indicators
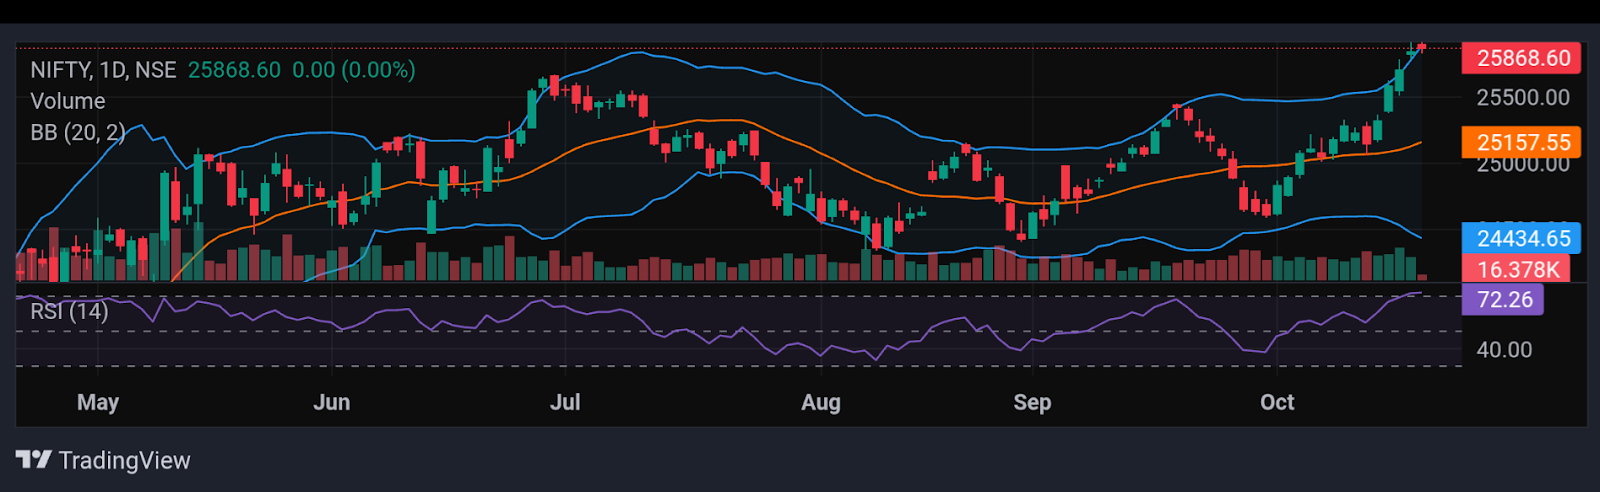
RSI (Daily): The Nifty 50’s RSI stood at 71.80 in Monday’s session, which is in the overbought zone of 70, indicating a bearish sentiment and potential for a reversal.
Bollinger Bands (Daily): The index is trading near the upper band, above the middle SMA, indicating bullish sentiment. On Monday, it found support at 25,788 and faced resistance at 25,926. During the Muhurat session, support was at 25,826 and resistance at 25,934. Holding above the middle band supports a bullish view; a drop toward the lower band may signal weakness.
Volume Analysis: Monday’s trading session had average volumes, which stood at 301.13 Mn and Tuesday (Muhurat trading session) the volumes stood at 42.48 Mn.
Derivatives Data: Options OI indicates strong Put writing at 25,850, followed by 25,800, establishing it as a firm support zone. On the upside, a significant Call OI buildup at 25,900 and 26,000 suggests a potential resistance supply. PCR (Put/Call Ratio) stands at 0.9836 (<1), leaning towards bullish sentiment, and the long unwinding signals a Strong bearish signal, with an overall mixed outlook for the next trading session.
Bank Nifty
(In this analysis, we have used 20/50/100/200 EMAs, where 20 EMA (Red), 50 EMA (Orange), 100 EMA (Light Blue), and 200 EMA (Dark Blue)).
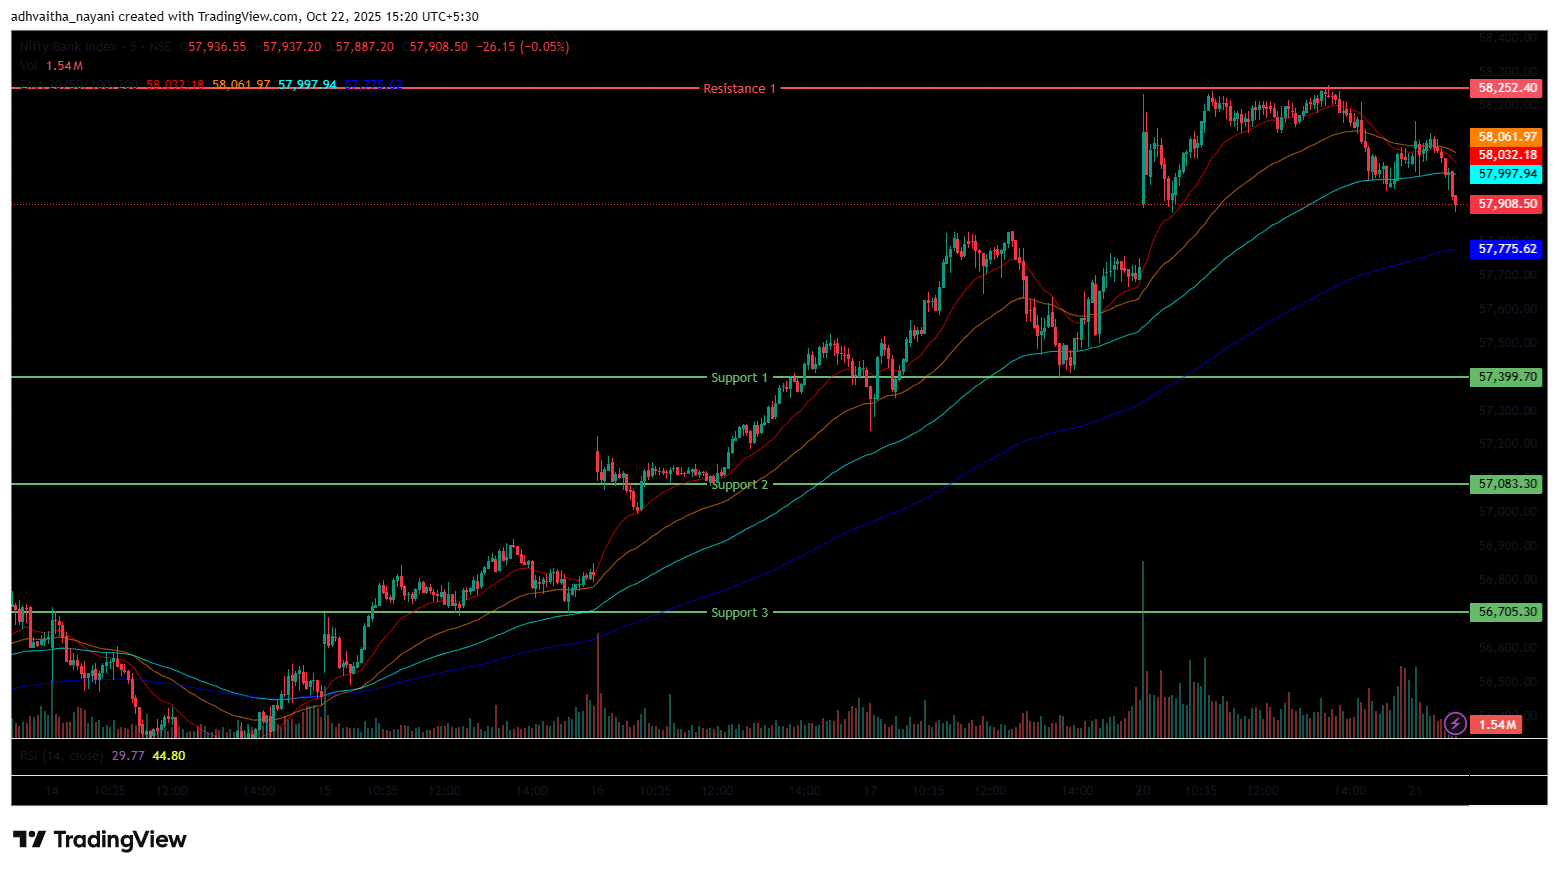
The Bank Nifty Index started the session on a positive at 57,872.85 on Monday, up by 159.5 points from Friday’s closing of 57,713.35. The index was trading between the range of 57,850 and 58,250 in the morning session and surged as high as 58,242.5, marking its day high. In addition, the index was trading above all four EMAs of 20/50/100/200 in the 15-minute time frame.
In the afternoon session, the Index formed a rangebound and declined below the 58,100 mark. Further, the Index was trading in the range of 57,900 and 58,252, and ended in green above its opening level. During the afternoon session, Bank Nifty closed above the EMAs of 50/100/200 but below the 20-period EMA in the 15-minute time frame. The Bank Nifty’s immediate resistance level is at R1 (58,252), while immediate support levels are S1 (57,400), S2 (57,083), and S3 (56,705).
On Monday, the Bank Nifty index had peaked at 58,261.55 and made a day’s low at 57,872.85. Finally, it had closed in green at 58,033, closing above the 58,000 level, gaining 319.85 points or 0.55%. The Relative Strength Index (RSI) stood at 76.70, entered the overbought zone of 70 in the daily time frame, and Bank Nifty closed above all four EMAs of 20/50/100/200 in the daily time frame. On Tuesday, in the Muhurat Trading session, the Bank Nifty Index opened on a positive note at 58,074.85 but ended at 57,908.5.
Sensex
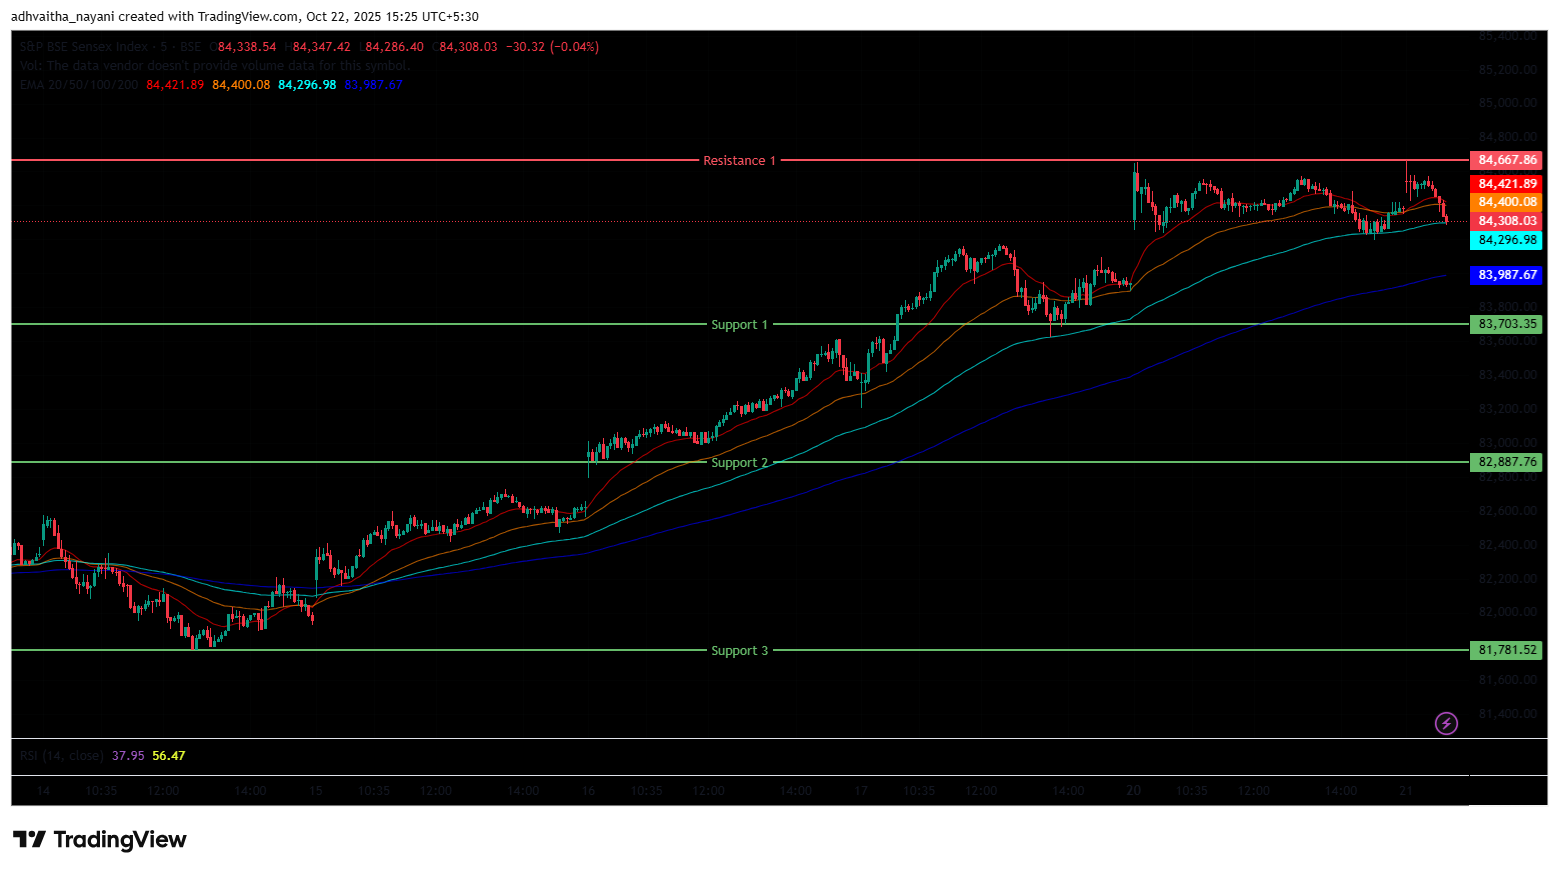
(In this analysis, we have used 20/50/100/200 EMAs, where 20 EMA (Red), 50 EMA (Orange), 100 EMA (Light Blue), and 200 EMA (Dark Blue)).
To view other technical reports, click here
The BSE Sensex Index also opened on a positive note at 84,322 on Monday, up by 377.71 points from Friday’s closing of 83,944.29. The index started its session on a bullish note and was trading in the 84,200 and 84,656 range throughout the morning session and was above all four EMAs of 20/50/100/200 in the 15-minute time frame.
In the afternoon session, the Index consolidated and settled above the 84,350 level. The Index was trading around 84,150 and 84,600, maintaining its overall bullish trend and closing above the EMAs of 20/50/100/200 in the 15-minute time frame. The BSE Sensex immediate resistance level is at R1 (84,668), while immediate support levels are S1 (83,703), S2 (82,888), and S3 (81,781).
On Monday, the BSE Sensex index had peaked at 84,656.56 and made a day’s low at 84,196.79. Finally, it had closed at 84,363.37 in green, gaining 411.18 points or 0.49%. The Relative Strength Index (RSI) stood at 71.83, entering towards the overbought zone of 70 in the daily time frame, and the BSE Sensex closed above all four EMAs of 20/50/100/200 in the daily time frame. On Tuesday, in the Muhurat Trading session, the Sensex Index opened on a positive note at 84,543 but ended at 84,308.
India VIX
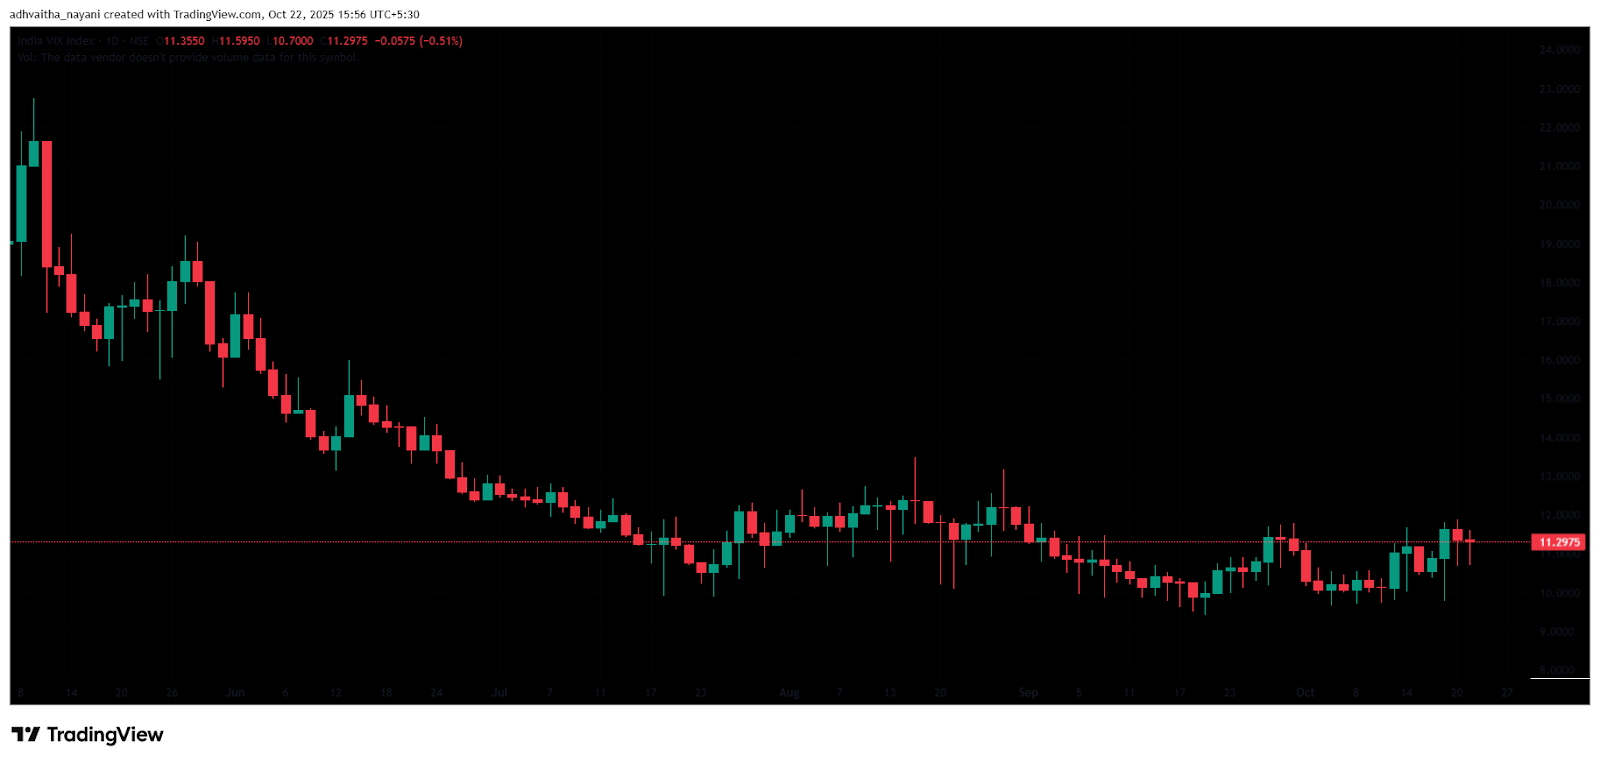
The India VIX decreased by 0.057 points or 0.51%, from 11.36 to 11.30 during Tuesday (Muhurat trading session). A decrease in the India VIX typically indicates lower price volatility in the stock market, suggesting a more stable market environment. However, a stable market environment and minimal volatility are anticipated when the India VIX is below 15.
Market Recap as of the 20th & 21st of October 2025
On Monday, the Nifty 50 opened on a strong note at 25,824.6, gaining 114.75 points from Friday’s close of 25,709.85. The index surged to an intraday high of 25,926.2, crossing the 25,900 mark. The BSE Sensex echoed the Nifty’s momentum, opening at 84,269.3, up 317.11 points from its previous close of 83,952, and touching an intraday high of 84,656.56, moving past the 84,600 level. The Bank Nifty Index also ended on a positive note, recording a 52-week high of 58,261.55, breaching the 58,250 level.
On Tuesday’s Muhurat session, held from 1:45 p.m. to 2:45 p.m., the broader indices continued their upward trend. The Nifty 50 opened at 25,901, up 57.85 points from Monday’s close of 25,843.15. It touched a 52-week high of 25,934.35, before settling slightly higher at 25,868.6, up 25.45 points or 0.10%. The BSE Sensex followed suit, opening at 84,484.67, up 121.3 points from Monday’s close of 84,363.37, and closing at 84,426.34, up 62.97 points or 0.07%. The index also marked a 52-week high of 84,665.44, crossing the 84,650 level. The Bank Nifty Index, however, had a subdued session, ending marginally lower at 58,007.20, down 26 points or -0.04%.
All three indices closed above their 20/50/100/200-day EMAs on the daily timeframe, signalling strong bullish momentum. The Nifty 50’s RSI stood at 72.26, while the BSE Sensex’s RSI was at 72.18—both entering the overbought zone (above 70). Meanwhile, the Bank Nifty’s RSI came in at 76.17, indicating it is well into overbought territory.
On the sectoral indices front, the Nifty Media Index emerged as the top gainer on Tuesday, rising 0.56% or 8.65 points, to 1,541.50. Stocks such as Tips Music Ltd, Prime Focus Ltd, Hathway Cable & Datacom Ltd, and D.B. Corp Ltd gained up to 2.3%. The Nifty Metal Index also ended in the green, advancing 0.40% or 40.90 points to 10,232.75. Key contributors included Lloyds Metals & Energy Ltd, Welspun Corp Ltd, Jindal Stainless Ltd, and JSW Steel Ltd, with gains up to 2.3%. The Nifty Pharma Index continued its positive run for the fifth consecutive session, closing at 22,515.70, up 0.34% or 75.80 points.
On the downside, the Nifty Realty Index was among the sectoral laggards, slipping 0.10% or -0.80 points, to close at 937.40. Shares of Sobha Ltd, DLF Ltd, The Phoenix Mills Ltd, and Prestige Estates Projects Ltd fell by up to 0.5%. The Nifty PSU Bank Index also ended in the red, closing at 7,853.30, down 4.55 points or -0.10%. Key underperformers included Bank of Baroda, Canara Bank, and Punjab National Bank, with losses of up to 0.5%.
In Asian markets, sentiment was mixed on Wednesday. Japan’s Nikkei 225 closed flat at 49,308, down 8.06 points or -0.02%. Hong Kong’s Hang Seng Index dropped 0.91% or -234.55 points, finishing at 25,793, while China’s Shanghai Composite Index edged lower by -0.07% or -2.57 points, to end at 3,913.76. In contrast, South Korea’s KOSPI Index gained 1.54% or 59.84 points, settling at 3,883.68. As of 4:00 p.m. IST, U.S. Dow Jones Futures were trading 0.06% higher at 46,952.65, up 27.91 points.
Trade Setup Summary
The Nifty 50 opened on a positive note at 25,901 on Tuesday (Muhurat trading session) and ended above the 25,850 level at 25,868. A break below 25,800 could trigger further selling towards 25,551, while breaking the nearest resistance level, which leads to 25,935.
Bank Nifty also started the session on a positive note at 58,063 ended the session at 58,007 and ended the session above the 58,000 level. A break below 57,400 could trigger further selling towards 57,083, while breaking the nearest resistance level, which leads to 58,252.
Sensex also opened on a positive note at 84,269 and ended the session at 84,426.34, above the 84,400 level. A break below 83,703 could trigger further selling towards 82,888, while breaking the nearest resistance level, which leads to the 84,668 level.
Given the ongoing volatility and mixed sentiments, it’s advisable to avoid aggressive positions and wait for clear directional moves above resistance or below support. Traders should consider these key support and resistance levels when entering long or short positions following the price break from these critical levels. Additionally, traders can combine moving averages to identify more accurate entry and exit points.
Disclaimer

The views and investment tips expressed by investment experts/broking houses/rating agencies on tradebrains.in are their own, and not that of the website or its management. Investing in equities poses a risk of financial losses. Investors must therefore exercise due caution while investing or trading in stocks. Trade Brains Technologies Private Limited or the author are not liable for any losses caused as a result of the decision based on this article. Please consult your investment advisor before investing.
About: Trade Brains Portal is a stock analysis platform. Its trade name is Dailyraven Technologies Private Limited, and its SEBI-registered research analyst registration number is INH000015729.
Investments in securities are subject to market risks. Read all the related documents carefully before investing.
Registration granted by SEBI and certification from NISM in no way guarantee performance of the intermediary or provide any assurance of returns to investors.
