
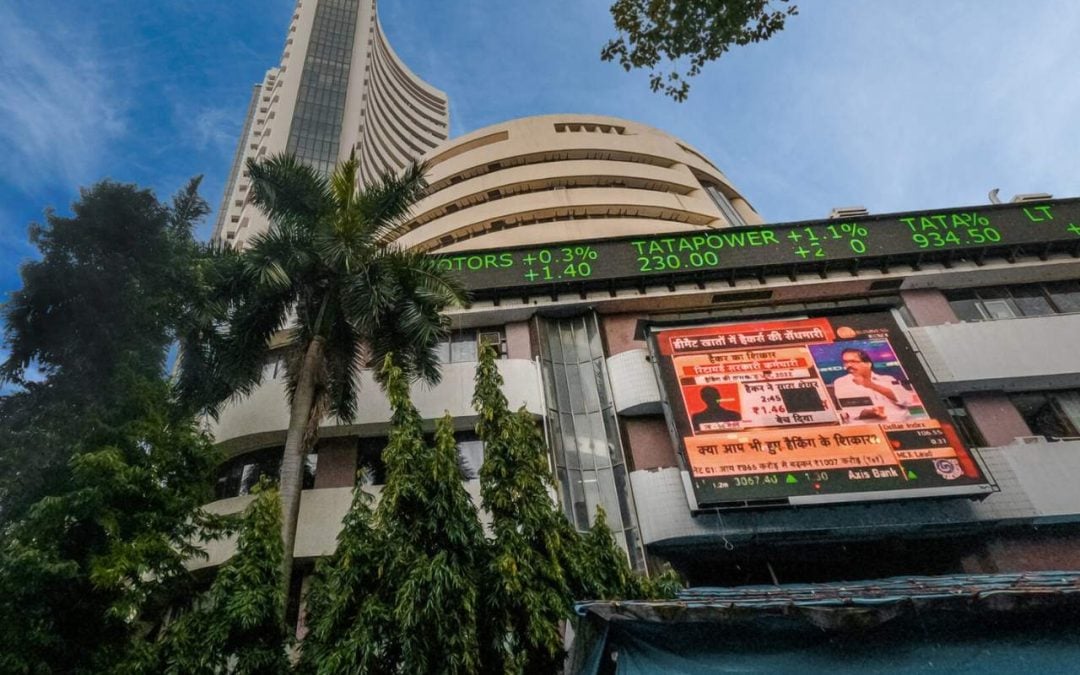
Indian equity markets opened the week on a firm note, with benchmark indices ending in the green after a recent correction, supported by positive global cues and renewed investor optimism. Both the Nifty 50 and Sensex traded higher through the session, buoyed by strong corporate earnings, easing geopolitical concerns, and expectations of a potential U.S. Federal Reserve rate cut. Market sentiment was further bolstered by robust technical indicators, with the indices sustaining above key moving averages, while strength in banking and energy stocks added to the upside momentum.

Broad-based buying interest was evident across sectors, led by notable gains in PSU banks, oil & gas, and realty. Meanwhile, mild profit booking was seen in media and pharmaceutical stocks after recent advances. Positive trends across major Asian markets and firm cues from U.S. futures reinforced the upbeat mood, indicating sustained investor confidence and a continued risk-on sentiment at the start of the week.

In this overview, we will analyse the key technical levels and trend directions for Nifty and BSE Sensex to monitor in the upcoming trading sessions. All the charts mentioned below are based on the 5-minute timeframe.
Nifty 50
(In this analysis, we have used 20/50/100/200 EMAs, where 20 EMA (Red), 50 EMA (Orange), 100 EMA (Light Blue), and 200 EMA (Dark Blue)).
To view other technical reports, click here
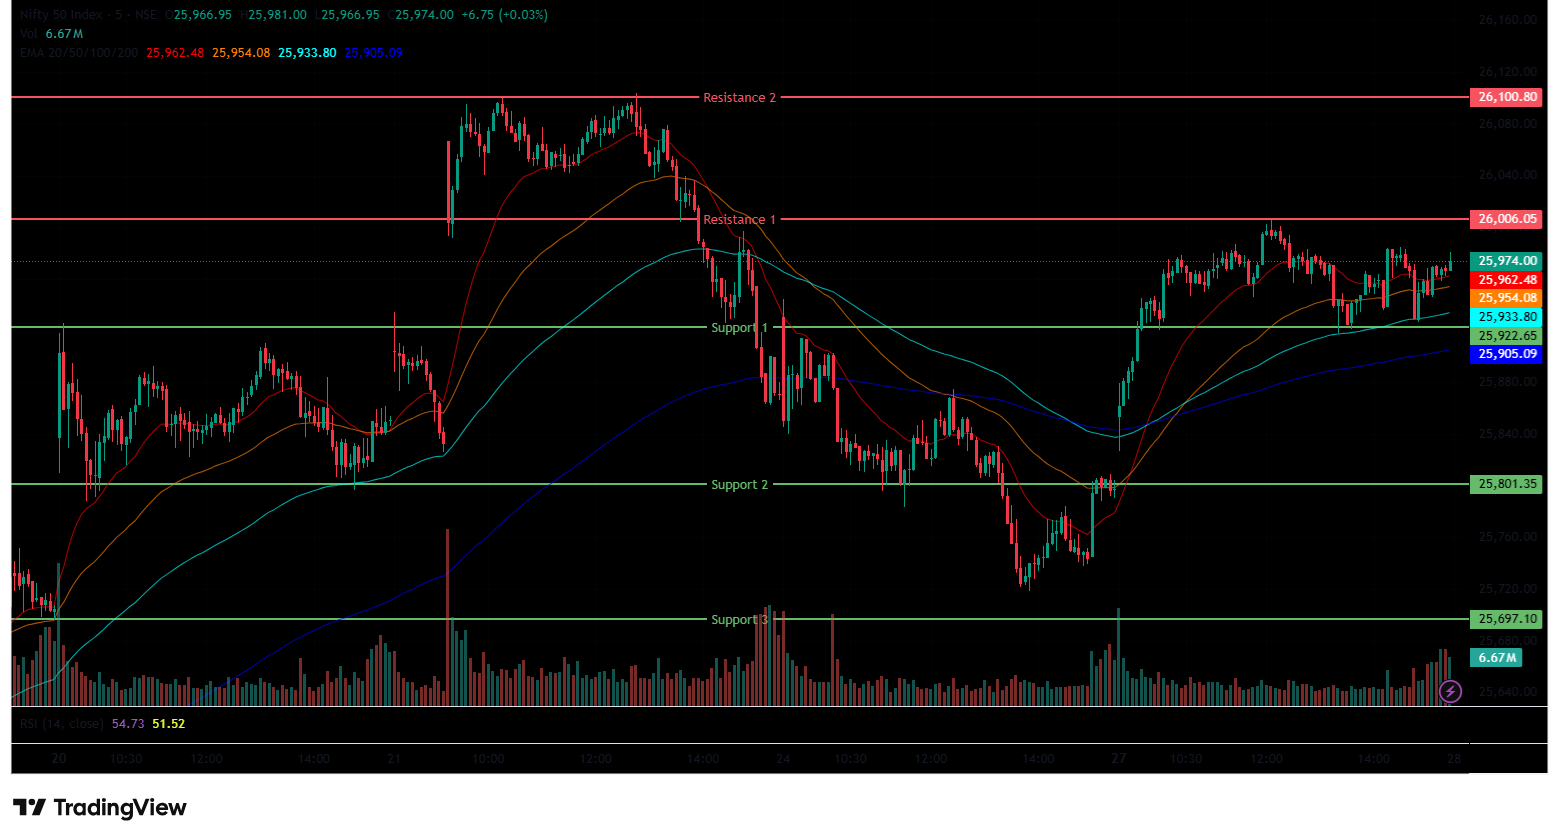
The Nifty 50 Index opened on a positive note at 25,843.20 on Monday, up by 48.05 points from Friday’s closing of 25,795.15. The index had a bullish start and surged as high as 26,005.95, marking its day high in the morning session. Later the index Consolidated and sustained above the 25,950 mark and was trading in the range of 25,800 to 26,050 above all four EMAs of 20/50/100/200 in the 15-minute time frame during the morning session.
In the afternoon session, the index formed a rangebound within the 25,900-26,000 range. During the afternoon session, the Nifty 50 closed above all four EMAs of 20/50/100/200 in the 15-minute time frame. The Nifty’s immediate resistance levels are R1 (26,006) and R2 (26,101), while immediate support levels are S1 (25,923), S2 (25,801), and S3 (25,697).
The Nifty index had reached a day’s high at 26,005.95 and saw a day’s low at 25,827.00. Finally, it had closed at 25,966.05, in the green above the 25,950 level, gaining 170.9 points, or 0.66%. The Nifty 50 closed above all four EMAs of 20/50/100/200 in the daily time frame.
Momentum Indicators
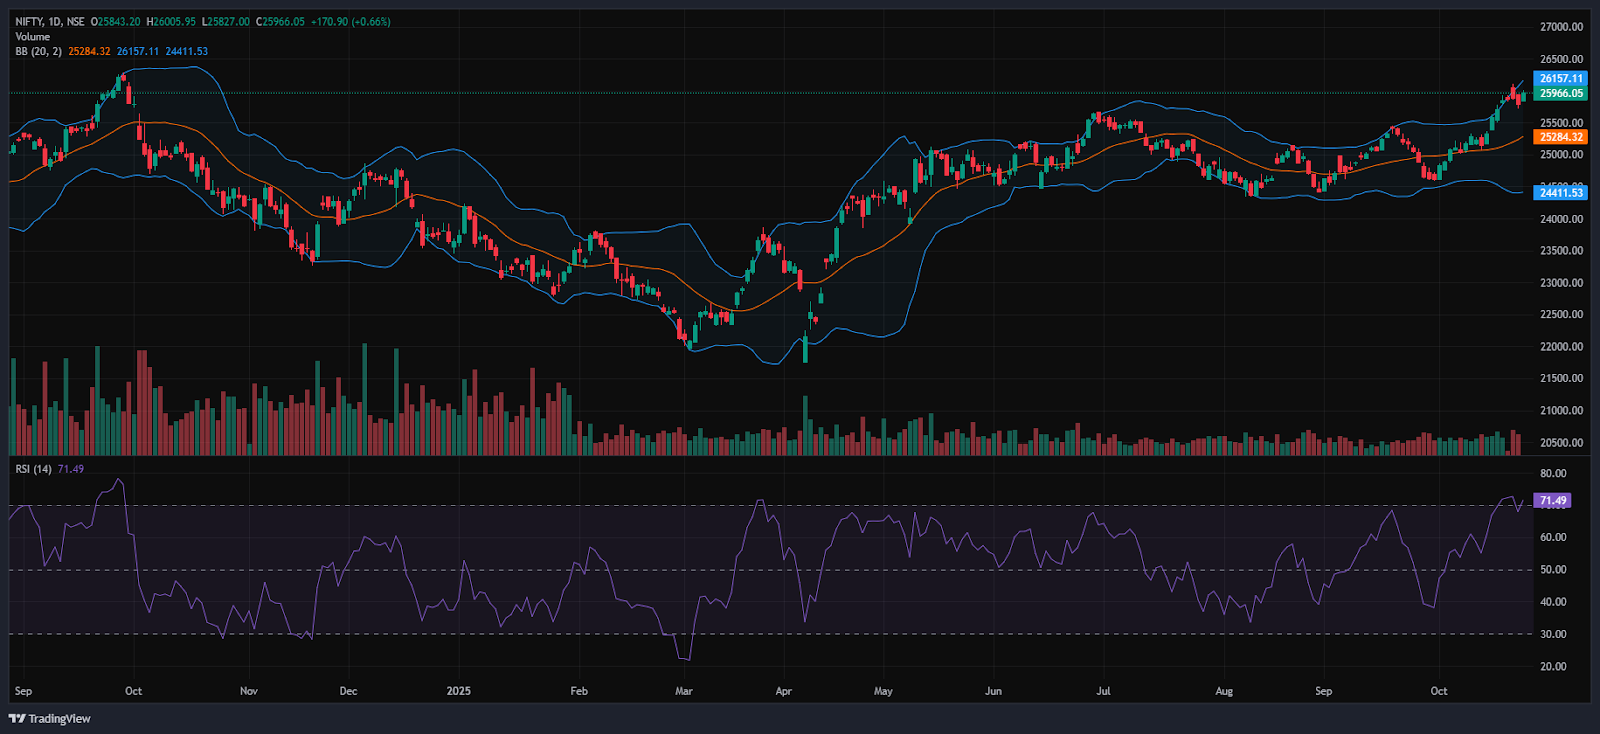
RSI (Daily): The Nifty 50’s RSI stood at 71.5, which is above the overbought zone of 70, indicating potential for a reversal.
Bollinger Bands (Daily): The index is trading in the upper band of the Bollinger Band range above the middle band (Simple Moving Average). Its position in the upper range indicates a bullish sentiment, and the Index formed a large bullish candle and took support near 25,827 and 26,006 acted as a resistance level. A sustained move above the middle band signals a bullish sentiment, while a drop back toward the lower band may reinforce bearish sentiment.
Volume Analysis: Monday’s trading session had an average volume of 255.64 Mn.
Derivatives Data: Options OI indicates strong Put writing at 25,900, followed by 25,800, establishing it as a firm support zone. On the upside, a significant Call OI buildup at 26,000 and 26,100 suggests a potential resistance supply. PCR (Put/Call Ratio) stands at 1.0234 (>=1), leaning towards neutral sentiment, and the Short-covering indicates a Short-term Bullish outlook, with an overall neutral to Bullish outlook for the next trading session.
Bank Nifty
(In this analysis, we have used 20/50/100/200 EMAs, where 20 EMA (Red), 50 EMA (Orange), 100 EMA (Light Blue), and 200 EMA (Dark Blue)).
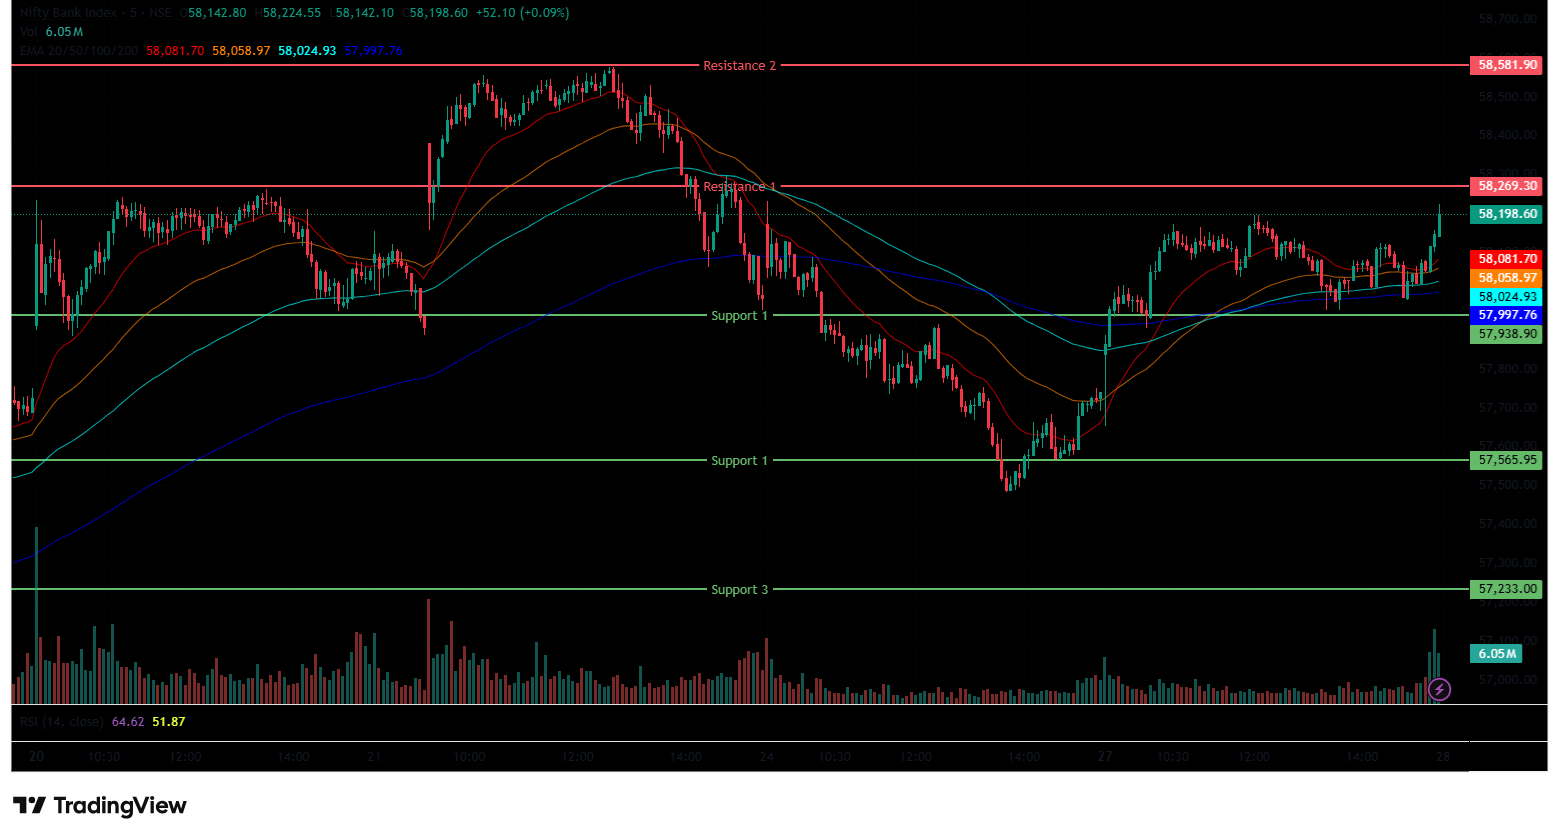
The Bank Nifty Index started the session on a positive at 57,796.45 on Monday, up by 96.85 points from Friday’s closing of 57,699.60. The index started on a Bullish note, was trading between the range of 57,650 and 58,250. In addition, the index was trading above all four EMAs of 20/50/100/200 in the 15-minute time frame in the morning session. In the afternoon session, the Index was pulled down to 57,951 but later recovered and surged as high as 58,224.55 marking its day high.
Further, the Index was trading in the range of 57,950 and 58,250, ended in green. During the afternoon session, Bank Nifty closed above all four EMAs of 20/50/100/200 in the 15-minute time frame.The Bank Nifty’s immediate resistance levels are R1 (58,269), R2 (58,582), and R3 (58,582), while immediate support levels are S1 (57,939), S2 (57,566), and S3 (57,233).
The Bank Nifty index had peaked at 58,224.55 and made a day’s low at 57,652.75. Finally, it had closed in green at 58,114.25, closing above the 58,100 level, gaining 414.65 points or 0.72%. The Relative Strength Index (RSI) stood at 72.11, above the overbought zone of 70 in the daily time frame, and Bank Nifty closed above all four EMAs of 20/50/100/200 in the daily time frame.
Sensex
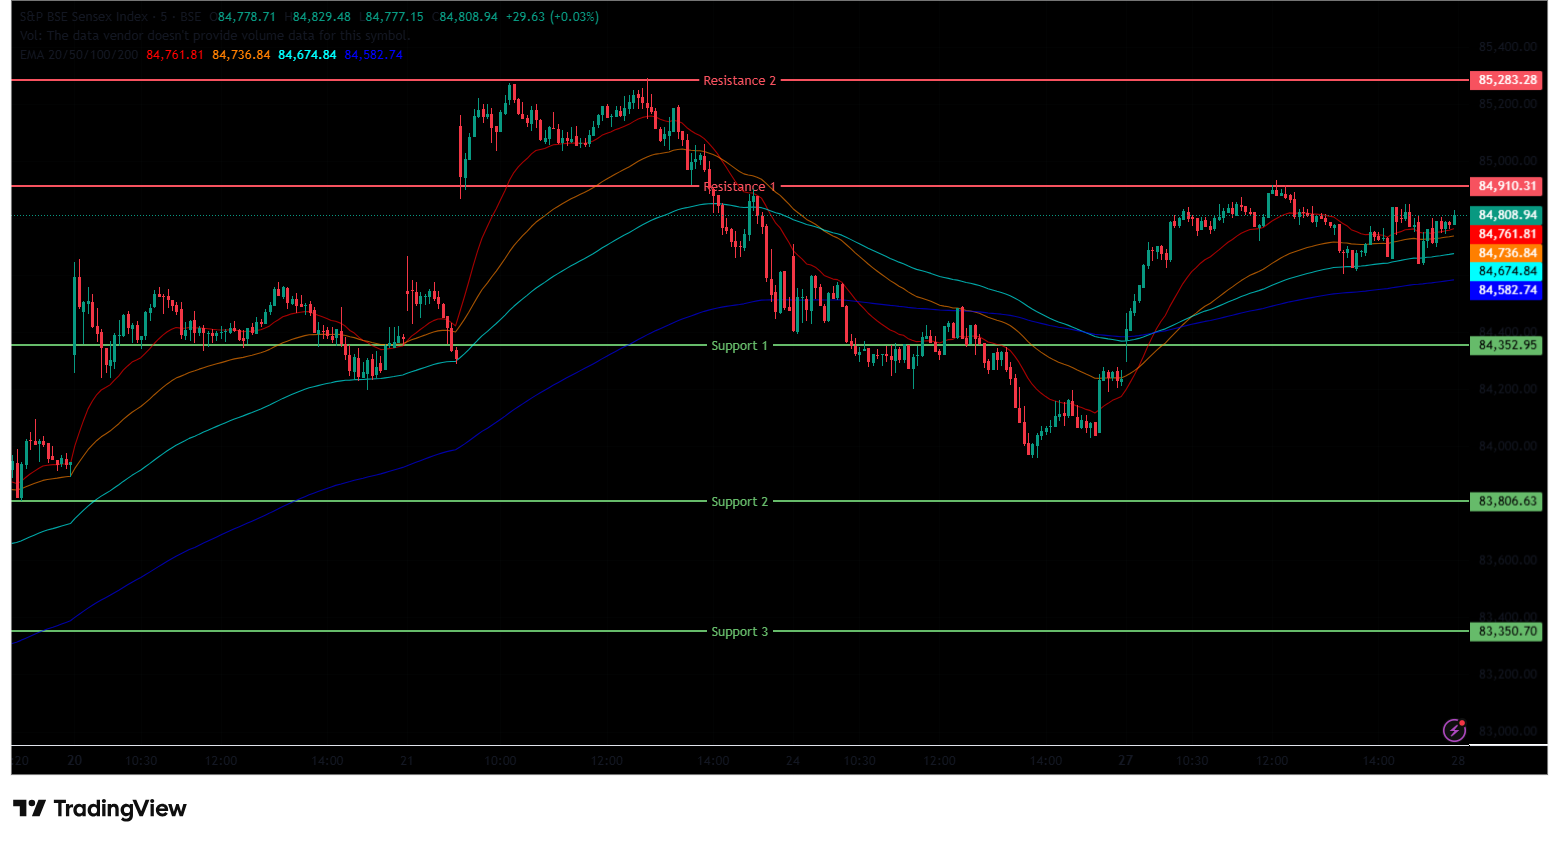
(In this analysis, we have used 20/50/100/200 EMAs, where 20 EMA (Red), 50 EMA (Orange), 100 EMA (Light Blue), and 200 EMA (Dark Blue)).
To view other technical reports, click here
The BSE Sensex Index also opened on a positive note at 84,297.39 on Monday, up by 85.51 points from Friday’s closing of 84,211.88. The index started its session on a bullish note and surged as high as 84,932, marking its day high. The Index was trading within the 84,200-84,950 range and was trading above all four EMAs of 20/50/100/200 in the 15-minute time frame in the morning session.
In the afternoon session, the Index pulled down to 84,600, but later recovered and ended above the 84,750 level. The Index was trading in the 84,600-84,850 range, maintaining its overall bullish trend and closed above all four EMAs of 20/50/100/200 in the 15-minute time frame. The BSE Sensex immediate resistance levels are R1 (84,910) and R2 (85,283), while immediate support levels are S1 (84,353), S2 (83,807), and S3 (83,351).
The BSE Sensex index had peaked at 84,932.08 and made a day’s low at 84,294.20. Finally, it had closed at 84,778.84 in green, gaining 566.96 points or 0.67%. The Relative Strength Index (RSI) stood at 71.36, above the overbought zone of 70 in the daily time frame, and the BSE Sensex closed above all four EMAs of 20/50/100/200 in the daily time frame.
India VIX
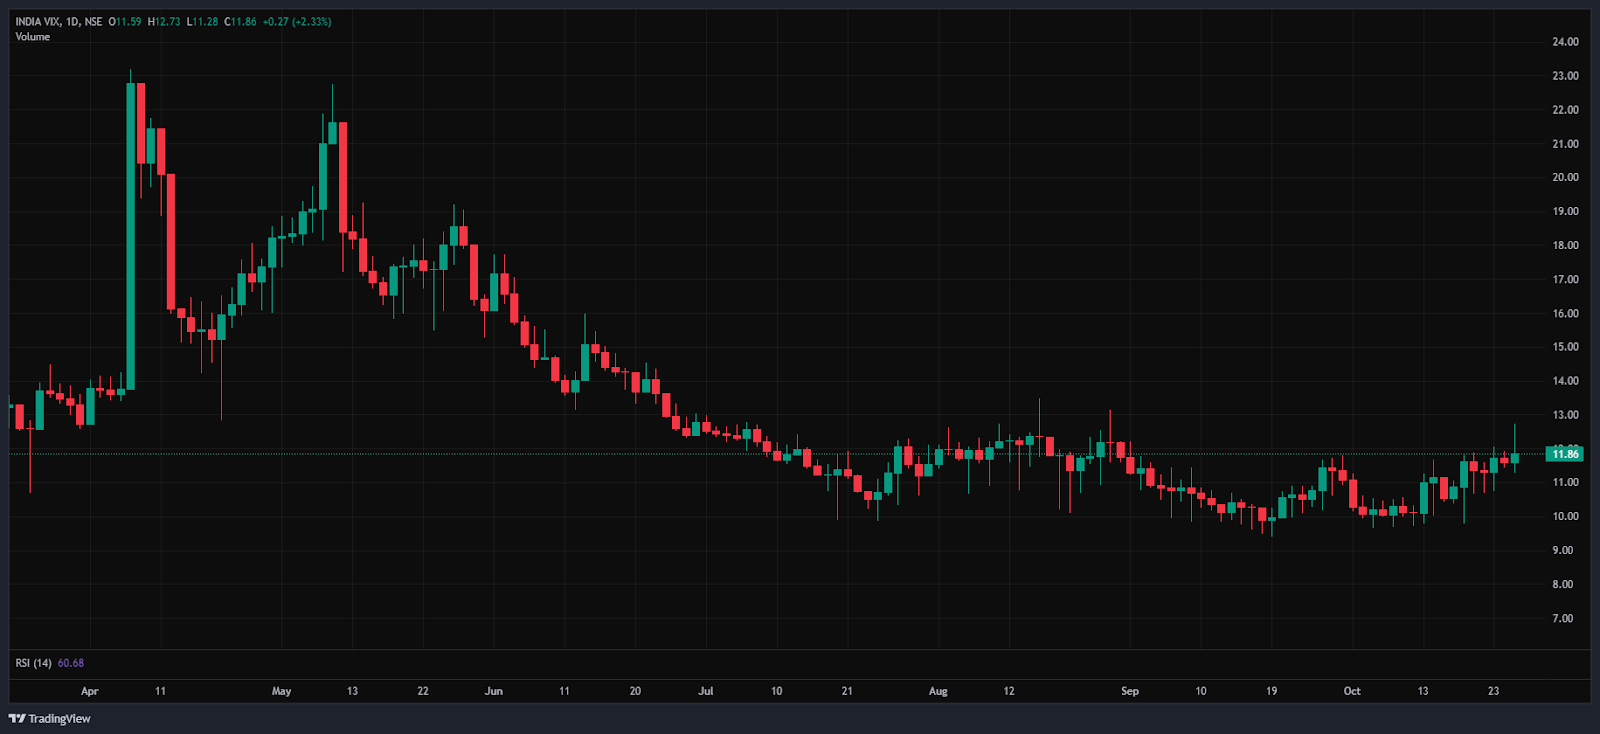
The India VIX increased by 0.27 points or 2.31%, from 11.59 to 11.86 during Monday’s session. An increase in the India VIX typically indicates higher price volatility in the stock market, suggesting a less stable market environment. However, a stable market environment and minimal volatility are anticipated when the India VIX is below 15.
Market Recap – 27th October 2025
On Monday, the Nifty 50 opened the week on a positive note at 25,843.20, up 48.05 points from its previous close of 25,795.15. The index maintained upward momentum, reaching an intraday high of 26,005.95 before closing at 25,966.05, gaining 170.90 points (0.66%), just below the 26,000 mark. The Nifty traded above all major moving averages (20/50/100/200-day EMAs), indicating strong technical support. The BSE Sensex followed a similar trend, opening higher at 84,297.39 (up 85.51 points from the previous close of 84,211.88) and closing at 84,778.84, up 566.96 points (0.67%), after sustaining above the 84,500 level.
Both benchmarks ended firmly in the green, with RSI values above the overbought threshold, 71.49 for Nifty 50 and 71.36 for Sensex. The Bank Nifty also gained 414.65 points (0.72%), ending at 58,114.25. The indices finished strong, supported by upbeat quarterly earnings, easing US-China trade tensions, and softer-than-expected US inflation data, which boosted expectations of a US Federal Reserve rate cut.
Among sectoral indices, most ended higher, barring a few laggards. The Nifty PSU Bank Index emerged as the top gainer, climbing 2.22% (173.25 points) to 7,990.65, led by Bank of India, Bank of Baroda, Canara Bank, and Punjab National Bank, which surged up to 4.34%. The Nifty Oil & Gas Index rose 1.52% (176.15 points) to 11,800.20, driven by BPCL, HPCL, IOCL, and Aegis Logistics, all up around 3.80%. The Nifty Realty Index also advanced 1.46% to 954.65, supported by Brigade Enterprises (+3.54%), along with gains in Sobha Ltd, Anant Raj, and Oberoi Realty (up to 2.23%).
On the downside, the Nifty Media Index was the weakest performer, slipping 0.26% (-3.95 points) to 1,536.15, weighed down by Zee Entertainment (-1.56%), along with losses in Nazara Technologies, Network18 Media & Investments, and Saregama India (down up to 1.47%). The Nifty Pharma Index declined 0.21% (-46.95 points) to 22,310.40, dragged by Wockhardt, Divi’s Laboratories, Alkem Laboratories, and Gland Pharma, which fell as much as 2.85%. The Nifty CPSE Index also edged lower by 0.05% (-3.50 points) to 6,611.95.
In the broader Asian markets, sentiment remained upbeat. Japan’s Nikkei 225 surged 2.28% (+1,148.35 points) to 50,448, Hong Kong’s Hang Seng advanced 1.01% (+266.85) to 26,427, China’s Shanghai Composite gained 1.17% (+46.63) to 3,996.94, and South Korea’s KOSPI climbed 2.50% (+101.24) to 4,042.83. As of 4:49 p.m. IST, U.S. Dow Jones Futures were up 0.52% (+247.39 points) at 47,458.49.
Trade Setup Summary
The Nifty 50 opened on a positive note at 25,843.20 on Monday and ended the session in the green above the 25,950 level at 25,966.05. A break below 25,923 could trigger further selling towards 25,801, while breaking the next resistance level of 26,006 could trigger bullishness towards the 26,101 level.
Bank Nifty also started the session on a positive note at 57,796.45 and ended the session in the green at 58,114.25, above the 58,100 level. A break below 57,939 could trigger further selling towards 57,566, while breaking the next resistance level of 58,269 could trigger bullishness towards the 58,582 level.
Sensex also opened on a positive note at 84,297.39 and ended the session in the green at 84,778.84, above the 84,750 level. A break below 84,353 could trigger further selling towards 83,807, while breaking the next resistance level of 84,910 could trigger bullishness towards the 85,283 level.
Given the ongoing volatility and mixed sentiments, it’s advisable to avoid aggressive positions and wait for clear directional moves above resistance or below support. Traders should consider these key support and resistance levels when entering long or short positions following the price break from these critical levels. Additionally, traders can combine moving averages to identify more accurate entry and exit points.
Disclaimer

The views and investment tips expressed by investment experts/broking houses/rating agencies on tradebrains.in are their own, and not that of the website or its management. Investing in equities poses a risk of financial losses. Investors must therefore exercise due caution while investing or trading in stocks. Trade Brains Technologies Private Limited or the author are not liable for any losses caused as a result of the decision based on this article. Please consult your investment advisor before investing.
About: Trade Brains Portal is a stock analysis platform. Its trade name is Dailyraven Technologies Private Limited, and its SEBI-registered research analyst registration number is INH000015729.
Investments in securities are subject to market risks. Read all the related documents carefully before investing.
Registration granted by SEBI and certification from NISM in no way guarantee performance of the intermediary or provide any assurance of returns to investors.
