
![]()
![]()
Domestic equity markets ended the week on a subdued note, extending losses for the second straight session as investors booked profits amidst cautious global sentiment. Both benchmark indices opened marginally lower and moved within a narrow range before closing in the red, reflecting a consolidation phase after recent gains. Despite the decline, key indices remained above their major moving averages, suggesting underlying technical support and resilience in the broader trend.

Sectoral performance was mixed, with most indices closing lower while select pockets like PSU banks and defence stocks outperformed. Gains in these segments were supported by regulatory developments and renewed buying interest. On the other hand, media, metal, services, and healthcare stocks dragged the markets lower. Globally, Asian markets showed a mixed trend as investors reacted to developments in U.S.-China trade relations and monetary policy cues. Overall, sentiment remained cautious amid concerns over foreign capital outflows and uncertainty about future U.S. rate decisions.

In this overview, we will analyse the key technical levels and trend directions for Nifty and BSE Sensex to monitor in the upcoming trading sessions. All the charts mentioned below are based on the 5-minute timeframe.
Nifty 50
(In this analysis, we have used 20/50/100/200 EMAs, where 20 EMA (Red), 50 EMA (Orange), 100 EMA (Light Blue), and 200 EMA (Dark Blue)).
To view other technical reports, click here
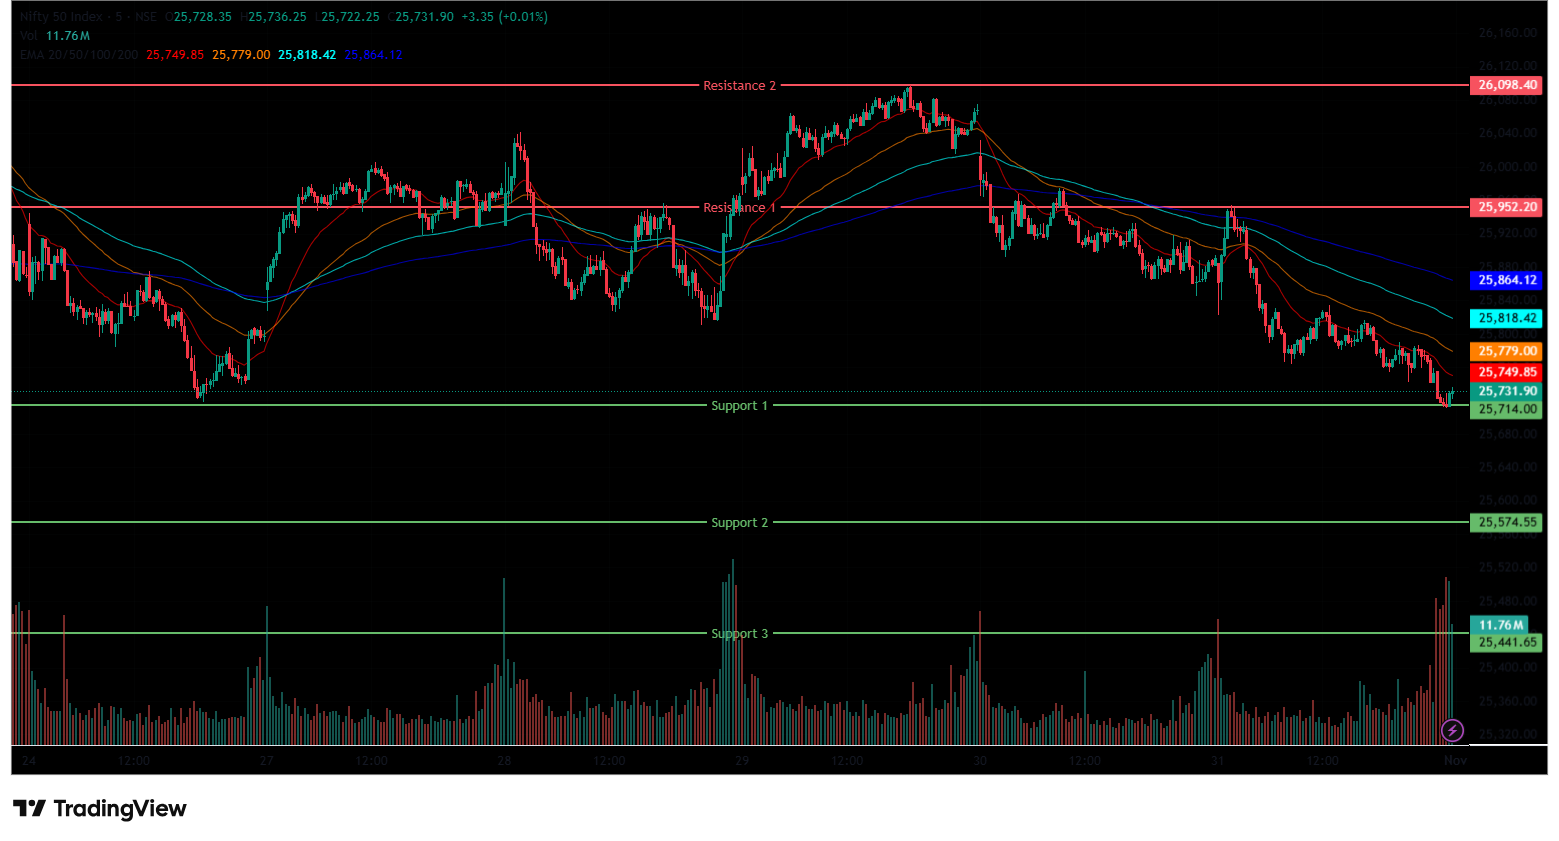
The Nifty 50 Index opened on a negative note at 25,863.80 on Friday, down by 14.05 points from Thursday’s closing of 25,877.85. The index opened on a bearish note; however, the Index made its day at 25,954 and was dragged down below the 25,800 level in the morning session. During the morning session, the index traded within the 25,750-26,000 range and traded below all four EMAs of 20/50/100/200 in the 15-minute chart.
In the afternoon, the index continued its downward momentum and fell as low as 25,711, marking its day low. Overall, the Index traded within a 25,700-25,850 range throughout the session. During the afternoon session, the Nifty 50 closed below all four EMAs of 20/50/100/200 in the 15-minute time frame. The Nifty’s immediate resistance levels are R1 (25,952) and R2 (26,098), while immediate support levels are S1 (25,714), S2 (25,575) and S3 (25,442).
The Nifty index had reached a day’s high at 25,953.75 and saw a day’s low at 25,711.20. Finally, it had closed at 25,722.10, in the red below the 25,750 level, losing 155.75 points, or 0.60%. The Nifty 50 closed above all four EMAs of 20/50/100/200 in the daily time frame.
Momentum Indicators
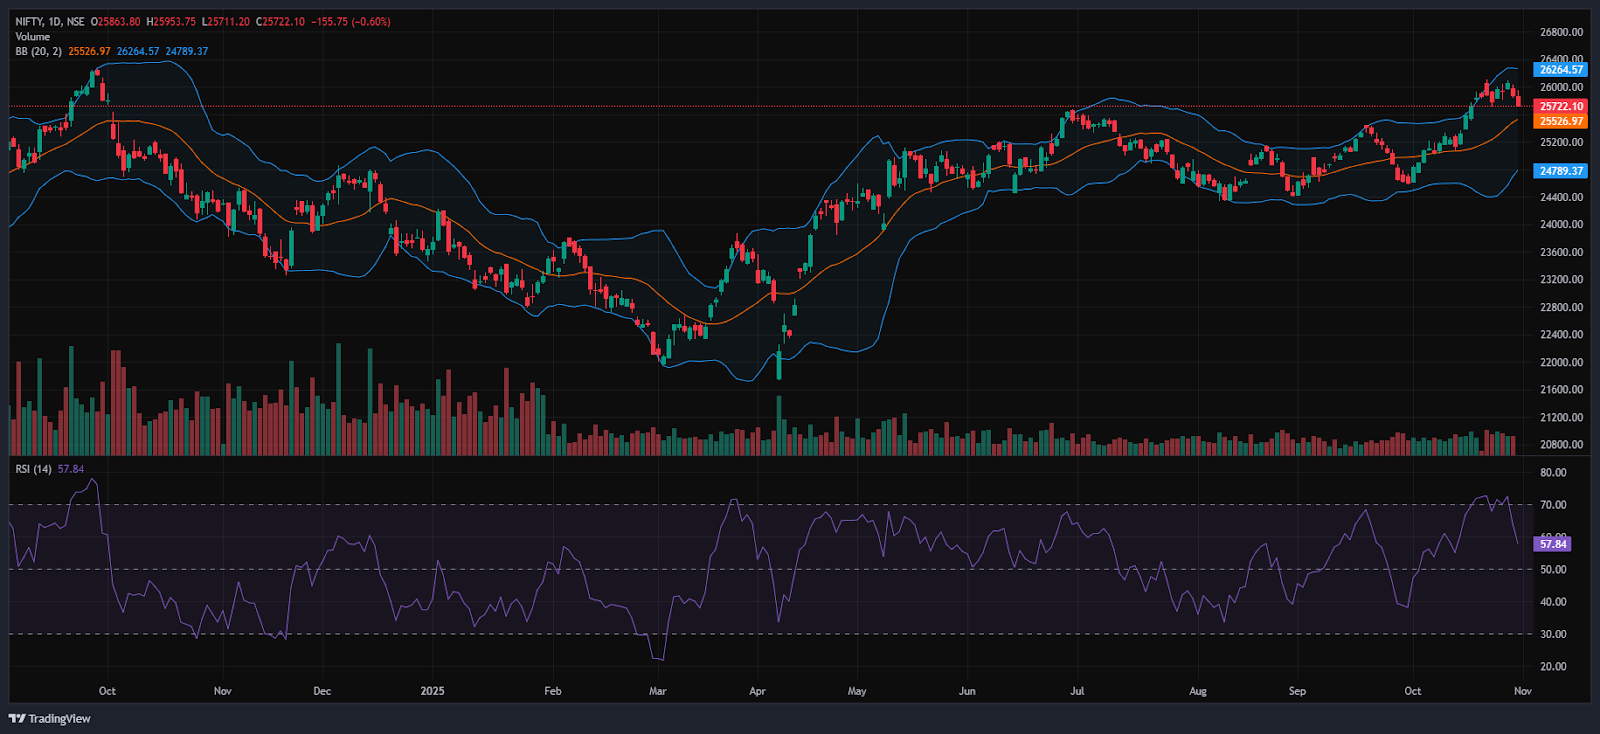
RSI (Daily): The Nifty 50’s RSI stood at 57.84, which is below the overbought zone of 70, indicating a bullish sentiment.
Bollinger Bands (Daily): The index is trading in the upper band of the Bollinger Band range above the middle band (Simple Moving Average). Its position in the upper range indicates a bullish sentiment, but the Index formed a strong bearish candle in the daily time frame and took support near 25,711 and 25,954 acted as a resistance level. A sustained move above the middle band signals a bullish sentiment, while a drop back toward the lower band may reinforce bearish sentiment.
Volume Analysis: Friday’s trading session had an above-average volume of 334.38 Mn.
Derivatives Data: Options OI indicates strong Put writing at 25,700, followed by 25,600, establishing it as a firm support zone. On the upside, a significant Call OI buildup at 25,800 and 25,900 suggests a potential resistance supply. PCR (Put/Call Ratio) stands at 0.5 (<1), leaning towards bullish sentiment, and the Long Buildup indicates a Strong Bullish outlook, with an overall bullish outlook for the next trading session.
Bank Nifty
(In this analysis, we have used 20/50/100/200 EMAs, where 20 EMA (Red), 50 EMA (Orange), 100 EMA (Light Blue), and 200 EMA (Dark Blue)).
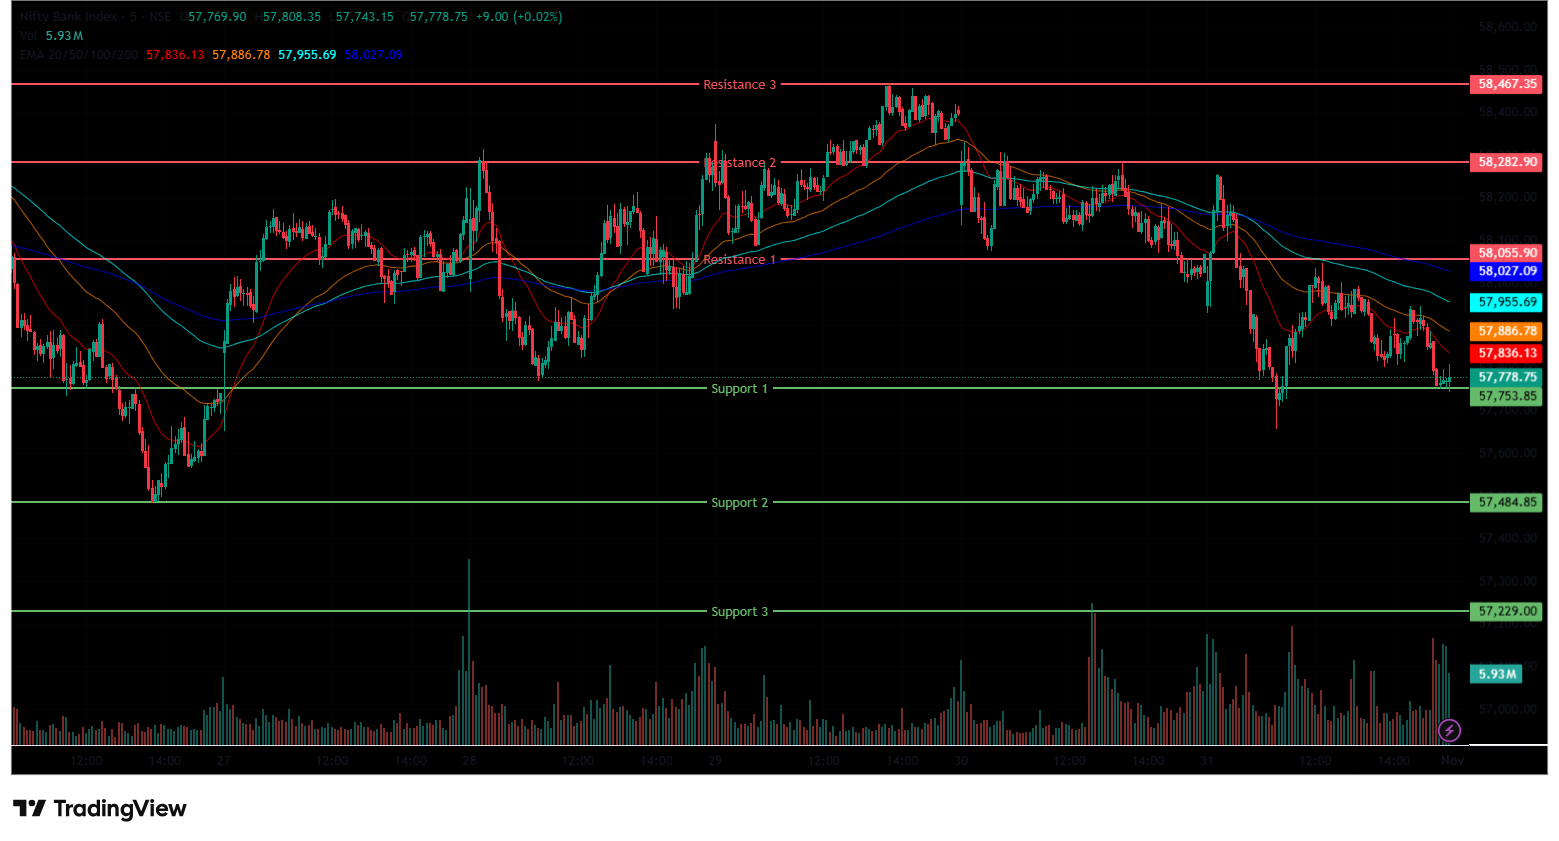
The Bank Nifty Index started the session on a negative note at 57,942.45 on Friday, down by 88.65 points from Thursday’s closing of 58,031.10. The index started on a Bearish note, but made its day high at 58,255 and made its day low at the 57,657 level in the morning session and was trading in the range of 57,650-58,300. In addition, the index was trading above the EMA of 200 and below the 20/50/100 EMAs in the 15-minute time frame in the morning session.
In the afternoon session, the Index recovered from its day low and settled above the 57,750 level. Further, the Index was trading in the range of 57,700-58,000, ended in red. During the afternoon session, Bank Nifty closed below all four EMAs of 20/50/100/200 in the 15-minute time frame. The Bank Nifty’s immediate resistance levels are R1 (58,056), R2 (58,283) and R3 (58,467), while immediate support levels are S1 (57,754), S2 (57,485), and S3 (57,229).
The Bank Nifty index had peaked at 58,254.95 and made a day’s low at 57,656.95. Finally, it had closed in red at 57,776.35, closing below the 57,800 level, losing 254.75 points or 0.44%. The Relative Strength Index (RSI) stood at 62.29, below the overbought zone of 70 in the daily time frame, and Bank Nifty closed above all four EMAs of 20/50/100/200 in the daily time frame.
Sensex
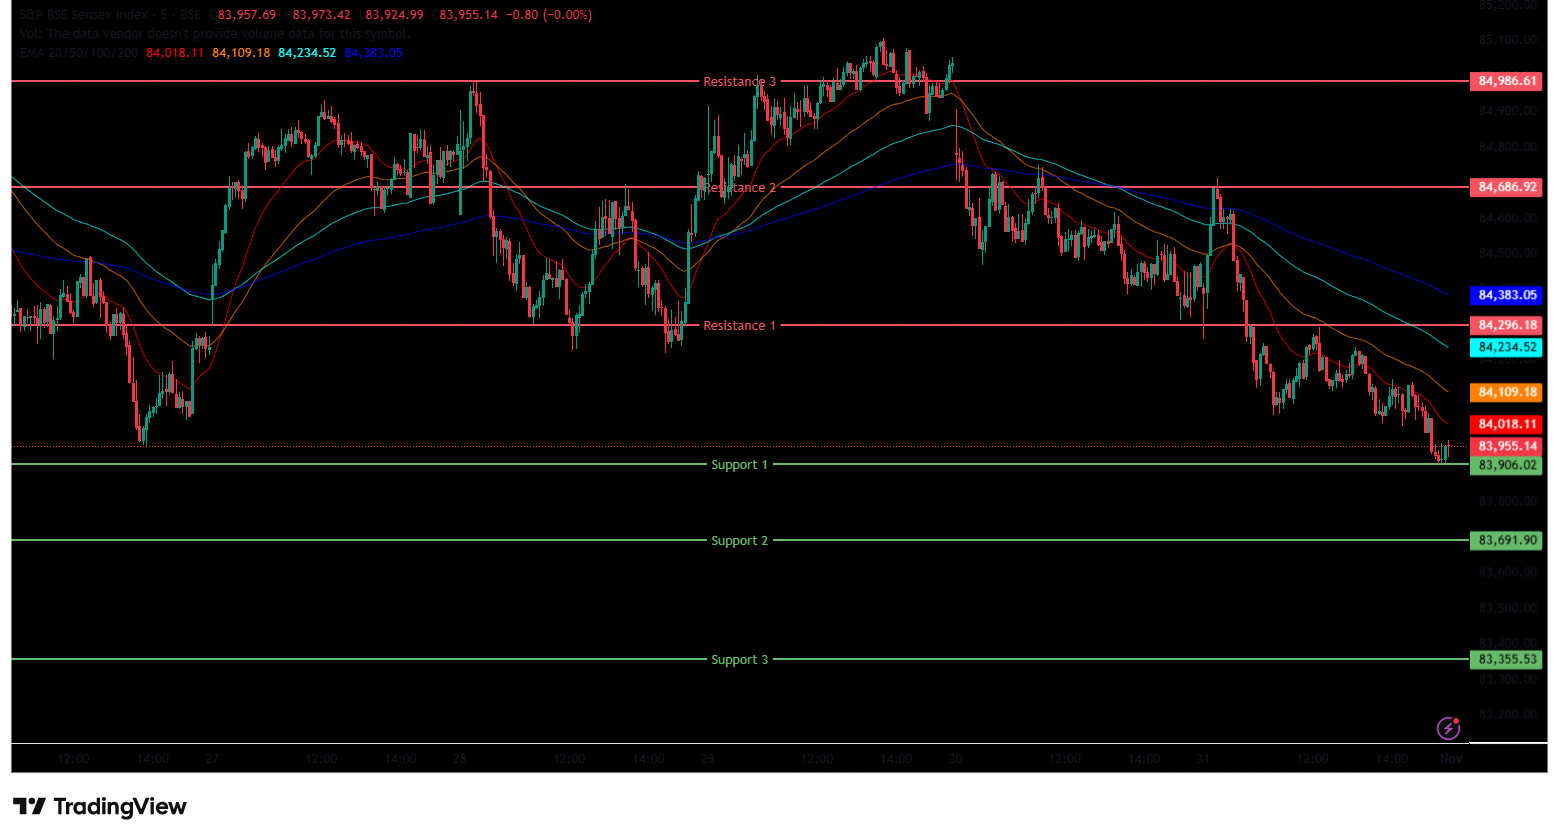
(In this analysis, we have used 20/50/100/200 EMAs, where 20 EMA (Red), 50 EMA (Orange), 100 EMA (Light Blue), and 200 EMA (Dark Blue)).
To view other technical reports, click here
The BSE Sensex Index also opened on a negative note at 84,379.79 on Friday, down by 24.67 points from Thursday’s closing of 84,404.46. The index started its session on a bearish note and made its day high at 84,712.79. Later, the Index fell below the 84,050 mark and was trading within the 84,000-84,750 range, below all four EMAs of 20/50/100/200 EMA in the 15-minute time frame in the morning session.
In the afternoon session, the Index further pulled down and fell as low as 83,905.66, marking its day low. The Index was trading in the 83,900-84,250 range, maintaining its overall bearish trend and closing below all four EMAs of 20/50/100/200 EMA in the 15-minute time frame. The BSE Sensex immediate resistance levels are R1 (84,296), R2 (84,687) and R3 (84,987), while immediate support levels are S1 (83,906), S2 (83,692), and S3 (83,356).
The BSE Sensex index had peaked at 84,712.79 and made a day’s low at 83,905.66. Finally, it had closed at 83,938.71 in red, losing 465.75 points or 0.55%. The Relative Strength Index (RSI) stood at 57.66, below the overbought zone of 70 in the daily time frame, and the BSE Sensex closed above all four EMAs of 20/50/100/200 in the daily time frame.
India VIX
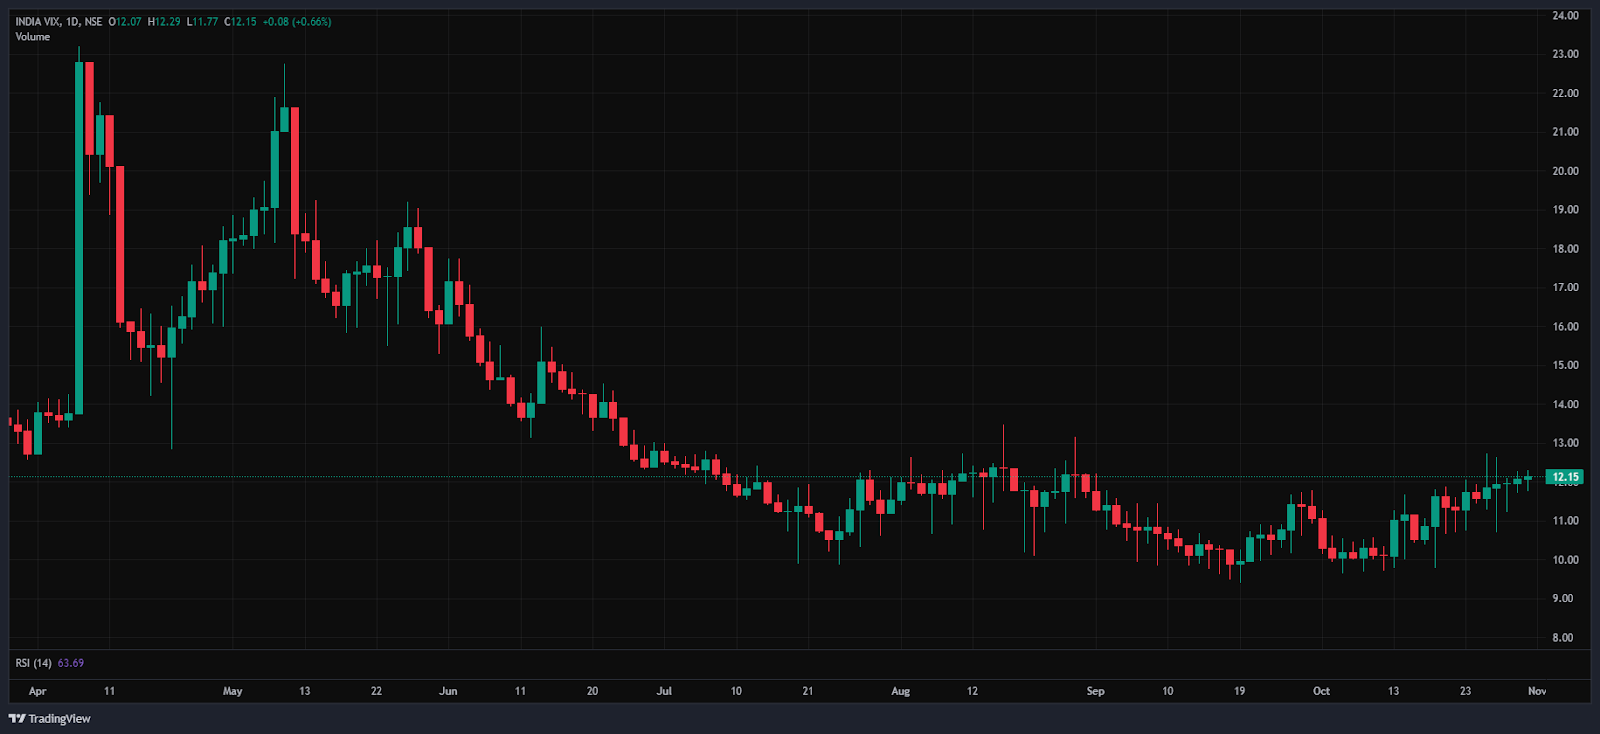
The India VIX increased by 0.085 points or 0.70%, from 12.07 to 12.15 during Friday’s session. Overall, this week the India VIX saw a 2.4% or 0.2925 points jump. An increase in the India VIX typically indicates higher price volatility in the stock market, suggesting a less stable market environment. However, a stable market environment and minimal volatility are anticipated when the India VIX is below 15.
Market Recap – 31st of October 2025
On Friday, the Nifty 50 opened slightly lower at 25,863.8, down -14.05 points from its previous close of 25,877.85. The index hit an intraday high of 25,953.75 and closed at 25,722.1, down -155.75 points, or -0.60%. The index remained above all key moving averages (20/50/100/200-day EMAs) on the daily chart, indicating some technical support. The BSE Sensex mirrored the Nifty’s trend, opening at 84,379.79, down -24.67 points from the previous close of 84,404.46.
It followed a similar pattern, closing at 83,938.71, a fall of -465.75 points, or -0.55%. Both indices showed high momentum, with RSI values for Nifty 50 at 57.84 and Sensex at 57.65, below the overbought threshold of 70. The markets ended on a muted note amidst the global cues, as investors continued to keep booking profits for the second consecutive day.
The majority of indices were in red on Friday, with a few in green. The Nifty PSU bank index was the biggest gainer, rising 1.6% or 125.6 points, and standing at 8,184.35. Stocks such as Union Bank of India Ltd jumped 4.5% on Friday. While other PSU bank stocks like Canara Bank Ltd, Punjab National Bank Ltd, and UCO Bank also gained up to 3.1%.
Stocks rose following SEBI’s announcement of new rules for Bank Nifty, which now requires a minimum of 14 constituents instead of 12, starting in December. The Nifty India Defence index was also among the major gainers, rising 1% or 83.10 points, and standing at 8,135.2. Stocks such as Bharat Electronics Ltd rose 4%, followed by MTAR Technologies Ltd and Dynamatic Technologies Ltd, which gained up to 3.3% on Friday.
The majority of the indices ended in red on Friday. The Nifty Media Index was the biggest loser, falling -1.3%, or -20.6 points, to 1,538.35. Media Sector stocks like PVR Inox Ltd, Zee Entertainment Ltd, Nazara Technologies Ltd, and Saregama Ltd saw declines of up to -2.8%. The Nifty Metal Index also fell on Friday, losing -117.05 points or -1.1%, ending at 10,612.15.
Jindal Stainless Ltd fell the most, declining by -3.7%, followed by Vedanta Ltd, Hindustan Copper Ltd, and Adani Enterprises Ltd, falling up to -2.6%. The Nifty Services Sector Index followed the decline, losing -0.9% or -303.3 points, to close at 33,206.35. Services Sector stocks, including Eternals Ltd, Max Healthcare Institute Ltd, NTPC Ltd, and HDFC Life Insurance Company Ltd, fell up to 3.5%. The Nifty Healthcare Index also fell on Friday’s trade, ending at 14,693.3, down -132.6 or -0.9%.
Asian markets followed a mixed sentiment on Friday. Japan’s Nikkei 225 increased by 1,085.73 points or 2.12%, hitting a fresh record, closing at 52,411.34. The Japanese market rallied after Washington and Beijing reached a trade truce over rare earths. While China’s Shanghai Composite fell by -32.11 points, or -0.04%, to 3,954.79, similarly, Hong Kong’s Hang Seng Index also declined by -376.04 points, or -1.43%, to close at 25,906.65.
Singapore’s Straits Times Index also declined by -5.15 points or -0.39%, finishing at 4,428.62, but South Korea’s KOSPI increased by 20.61 points or 0.5%, closing at 4,107.5. At 4:21 p.m. IST, U.S. Dow Jones Futures were lower, down 0.061%, at 47,648, losing -29 points.
This week, the US Federal Reserve cut US interest rates by 0.25% putting it in a range of 3.75% to 4%. The US President lowered tariffs on China and announced an end to rare earth roadblocks, after meeting the Chinese president. The MEA shared an update on India, and the US continued to be engaged in discussions for finalising a trade deal. This week, the broad indices Nifty 50 and Sensex declined by -0.65% and -0.87% respectively. Ongoing foreign capital outflows and fading expectations for a U.S. rate cut in December continued to weigh on market sentiment.
Trade Setup Summary
The Nifty 50 opened on a negative note at 25,863.80 on Friday and ended the session in the red below the 25,750 level at 25,722.10. A break below 25,714 could trigger further selling towards 25,575, while breaking the next resistance level of 25,952 could trigger bullishness towards the 26,098 level.
Bank Nifty also started the session on a negative note at 57,942.45 and ended the session in the red at 57,776.35, below the 57,800 level. A break below 57,754 could trigger further selling towards 57,485, while breaking the next resistance level of 58,056 could trigger bullishness towards the 58,283 level.
Sensex also opened on a negative note at 84,379.79 and ended the session in the red at 83,938.71, below the 84,000 level. A break below 83,906 could trigger further selling towards 83,692, while breaking the next resistance level of 84,296 could trigger bullishness towards the 84,687 level.
Given the ongoing volatility and mixed sentiments, it’s advisable to avoid aggressive positions and wait for clear directional moves above resistance or below support. Traders should consider these key support and resistance levels when entering long or short positions following the price break from these critical levels. Additionally, traders can combine moving averages to identify more accurate entry and exit points.
Disclaimer

The views and investment tips expressed by investment experts/broking houses/rating agencies on tradebrains.in are their own, and not that of the website or its management. Investing in equities poses a risk of financial losses. Investors must therefore exercise due caution while investing or trading in stocks. Trade Brains Technologies Private Limited or the author are not liable for any losses caused as a result of the decision based on this article. Please consult your investment advisor before investing.
About: Trade Brains Portal is a stock analysis platform. Its trade name is Dailyraven Technologies Private Limited, and its SEBI-registered research analyst registration number is INH000015729.
Investments in securities are subject to market risks. Read all the related documents carefully before investing.
Registration granted by SEBI and certification from NISM in no way guarantee performance of the intermediary or provide any assurance of returns to investors.

