
![]()
![]()
The domestic equity markets began the week on a cautious note but soon gained momentum, ending the session with modest gains. After a subdued opening, both the Nifty 50 and the Sensex recovered sharply, supported by strong buying interest across key sectors. The benchmarks managed to close in positive territory, maintaining their position above crucial moving averages, a sign of sustained underlying strength. Technical indicators also reflected a healthy market setup, with momentum remaining steady and comfortably below the overbought zone.

Broader market sentiment was buoyed by strong performances in realty, PSU banking, and pharmaceutical stocks, which offset mild weakness in consumer durables, IT, and CPSE indices. Realty and PSU bank shares led the rally, driven by robust buying in select large- and mid-cap names, while the pharma space saw renewed investor interest. In contrast, profit-booking in consumer-oriented and technology counters kept gains in check. Positive cues from other Asian markets further supported domestic sentiment, with major regional indices trading higher and U.S. futures also indicating a firm start to global trade.

In this overview, we will analyse the key technical levels and trend directions for Nifty and BSE Sensex to monitor in the upcoming trading sessions. All the charts mentioned below are based on the 5-minute timeframe.
NIFTY 50 Chart & Price Action Analysis
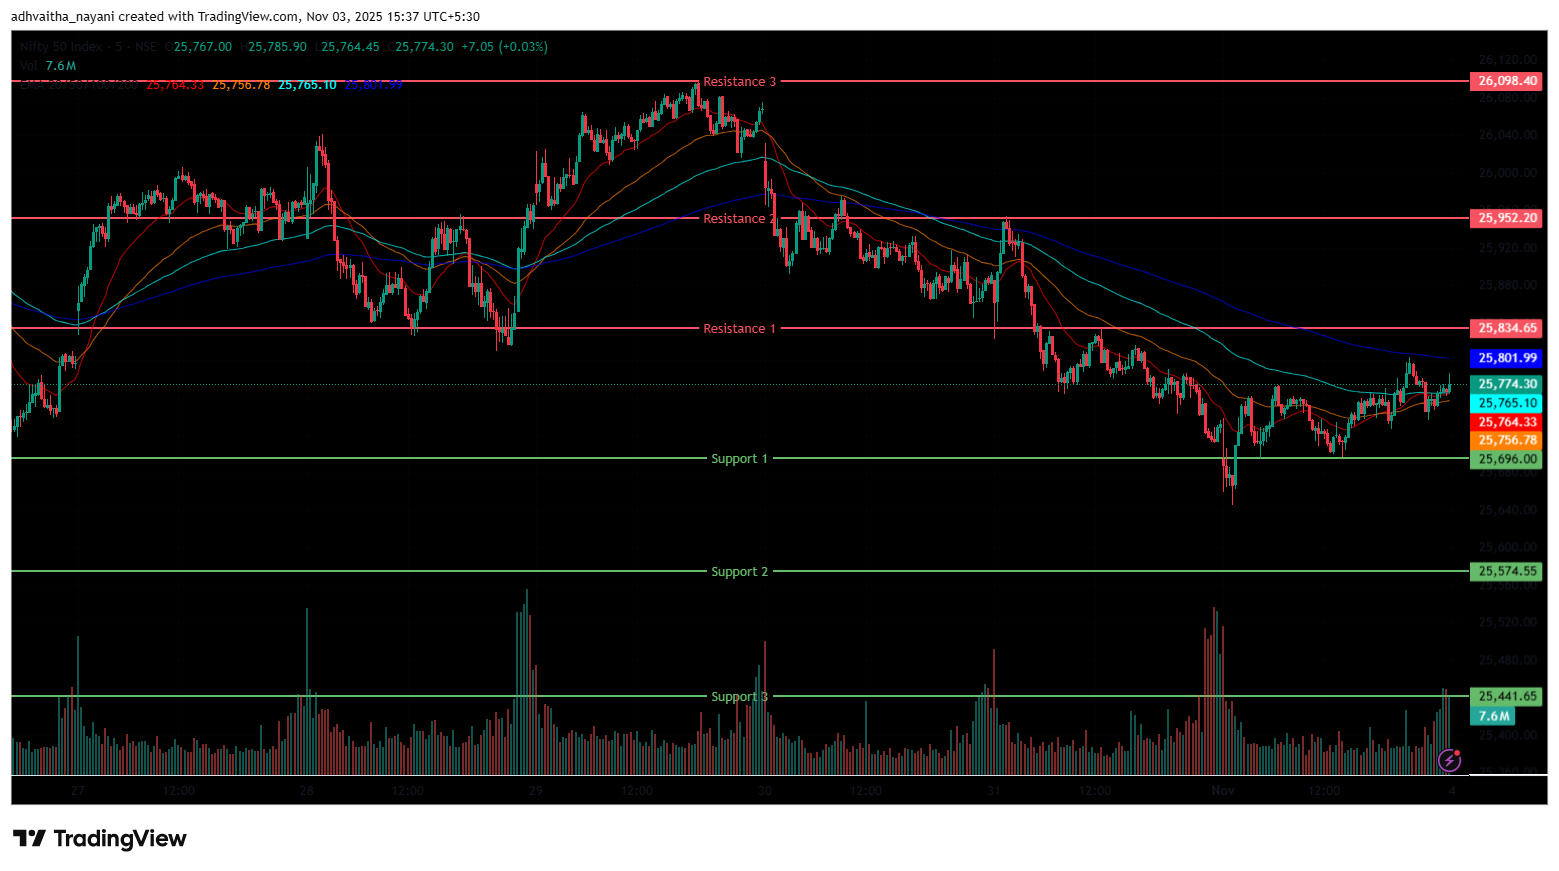
(In this analysis, we have used 20/50/100/200 EMAs, where 20 EMA (Red), 50 EMA (Orange), 100 EMA (Light Blue), 200 EMA (Dark Blue)).
To view other technical reports, click here
The Nifty 50 Index opened on a muted note at 25,696.85 on Monday, down by 25.15 points from Friday’s closing of 25,722.10. The index opened on a bearish note and traded within the 25,700-25,750 range during the morning session, and traded below all four EMAs of 20/50/100/200 in the 15-minute chart.
In the afternoon session, the index, however, moved upwards and hit an intraday high of 25,803, briefly touching the 25,800 level. Overall, the Index traded within a 25,750-25,800 range throughout the afternoon session. During the afternoon session, the Nifty 50 closed below 50/100/200 EMAs but above the 20-day EMA in the 15-minute time frame.
The Nifty’s immediate resistance levels are R1 (25,835), R2 (25,952), and R3 (26,098), while immediate support levels are S1 (25,696), S2 (25,575) and S3 (25,442). The Nifty index had reached a day’s high at 25,803 and saw a day’s low at 25,646. Finally, it had closed at 25,763.35, in the green but below the 25,800 level, up 41.25 points, or 0.16%. The Nifty 50 closed above all four EMAs of 20/50/100/200 in the daily time frame.
NIFTY 50 Momentum Indicators Analysis
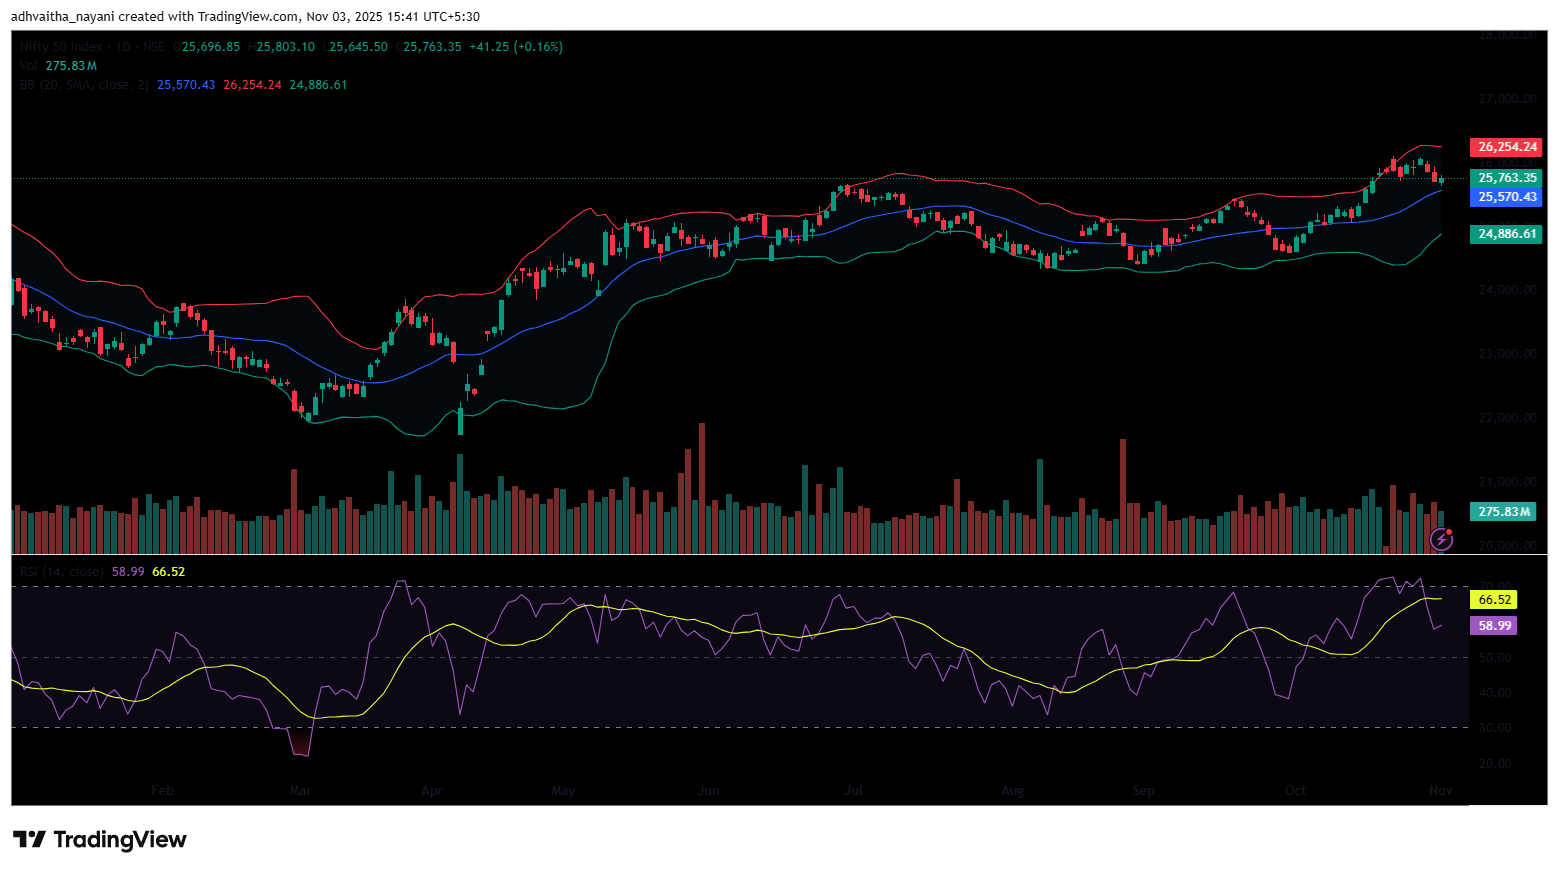
RSI (Daily): The Nifty 50’s RSI stood at 58.99, which is below the overbought zone of 70, indicating a bullish sentiment.
Bollinger Bands (Daily): The index is trading in the upper band of the Bollinger Band range, slightly above the middle band (Simple Moving Average). Its position in the upper range indicates a bullish sentiment, but the Index is nearing the middle band in the daily time frame. The index took support near 25,696, and 25,835 acted as a resistance level. A sustained move above the middle band signals a bullish sentiment, while a drop back toward the lower band may reinforce bearish sentiment.
Volume Analysis: Monday’s trading session had an average volume of 275.86 Mn.
Derivatives Data: Options OI indicates strong Put writing at 25,700, followed by 25,600, establishing it as a firm support zone. On the upside, a significant Call OI buildup at 25,800 and 25,900 suggests a potential resistance supply. PCR (Put/Call Ratio) stands at 0.66 (<1), leaning towards bullish sentiment, and the Long Buildup indicates a Strong Bullish outlook, with an overall bullish outlook for the next trading session.
Bank Nifty Chart & Price Action Analysis

(In this analysis, we have used 20/50/100/200 EMAs, where 20 EMA (Red), 50 EMA (Orange), 100 EMA (Light Blue), 200 EMA (Dark Blue)).
The Bank Nifty Index started the session on a negative note at 57,726.85 on Monday, down by 49.5 points from Friday’s closing of 57,776. The index started on a Bearish note, but continued to move upwards and was trading in the range of 57,800-58,100. In addition, the index was trading above the EMA of 200 and near the 20/50/100 EMAs in the 15-minute time frame in the morning session. In the afternoon session, the Index hit an intraday high at 58,247.55, nearing the 58,250 level.
Further, the Index was trading in the range of 58,000-58,200, and ended with gains. During the afternoon session, Bank Nifty closed above all four EMAs of 20/50/100/200 in the 15-minute time frame. The Bank Nifty’s immediate resistance levels are R1 (58,254), R2 (58,425) and R3 (58,575), while immediate support levels are S1 (57,939), S2 (57,712), and S3 (57,487).
The Bank Nifty index had peaked at 58,247.55 and made a day’s low at 57,718.40. Finally, it had closed in green at 58,101.45, closing near the 58,100 level, gaining 325.1 points or 0.56%. The Relative Strength Index (RSI) stood at 65.60, near the overbought zone of 70 in the daily time frame, and Bank Nifty closed above all four EMAs of 20/50/100/200 in the daily time frame.
BSE Sensex Chart & Price Action Analysis
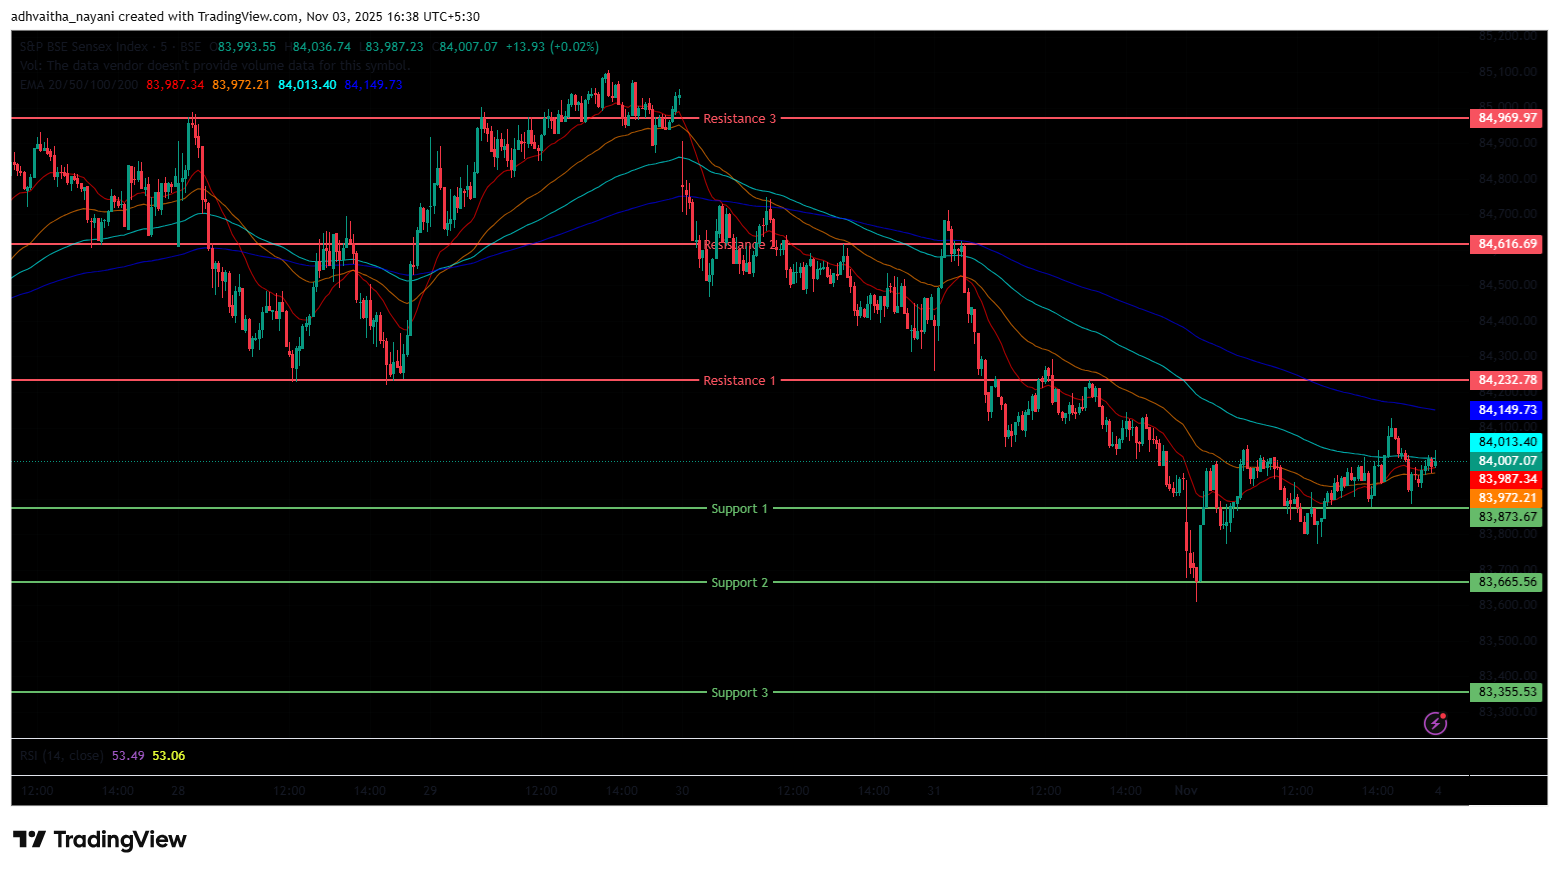
(In this analysis, we have used 20/50/100/200 EMAs, where 20 EMA (Red), 50 EMA (Orange), 100 EMA (Light Blue), 200 EMA (Dark Blue)).
To view other technical reports, click here
The BSE Sensex Index also opened on a negative note at 83,835 on Monday, down by 104 points from Friday’s closing of 83,939. The index started its session on a bearish note, but later, it moved slightly upwards and was trading within the 83,800-84,000 range. It traded below all four EMAs of 20/50/100/200 EMA in the 15-minute time frame in the morning session.
In the afternoon session, the Index further moved upwards and touched 84,127, marking its day high. The Index was trading in the 83,900-84,150 range, following a volatile trading session and closed below all four EMAs of 20/50/100/200 EMA in the 15-minute time frame. The BSE Sensex immediate resistance levels are R1 (84,233), R2 (84,617) and R3 (84,970), while immediate support levels are S1 (83,874), S2 (83,666), and S3 (83,356).
The BSE Sensex index had peaked at 84,127 and made a day’s low at 83,609. Finally, it had closed at 83,978.49 in green, gaining 39.78 points or 0.05%. The Relative Strength Index (RSI) stood at 58, below the overbought zone of 70 in the daily time frame, and the BSE Sensex closed above all four EMAs of 20/50/100/200 in the daily time frame.
India VIX
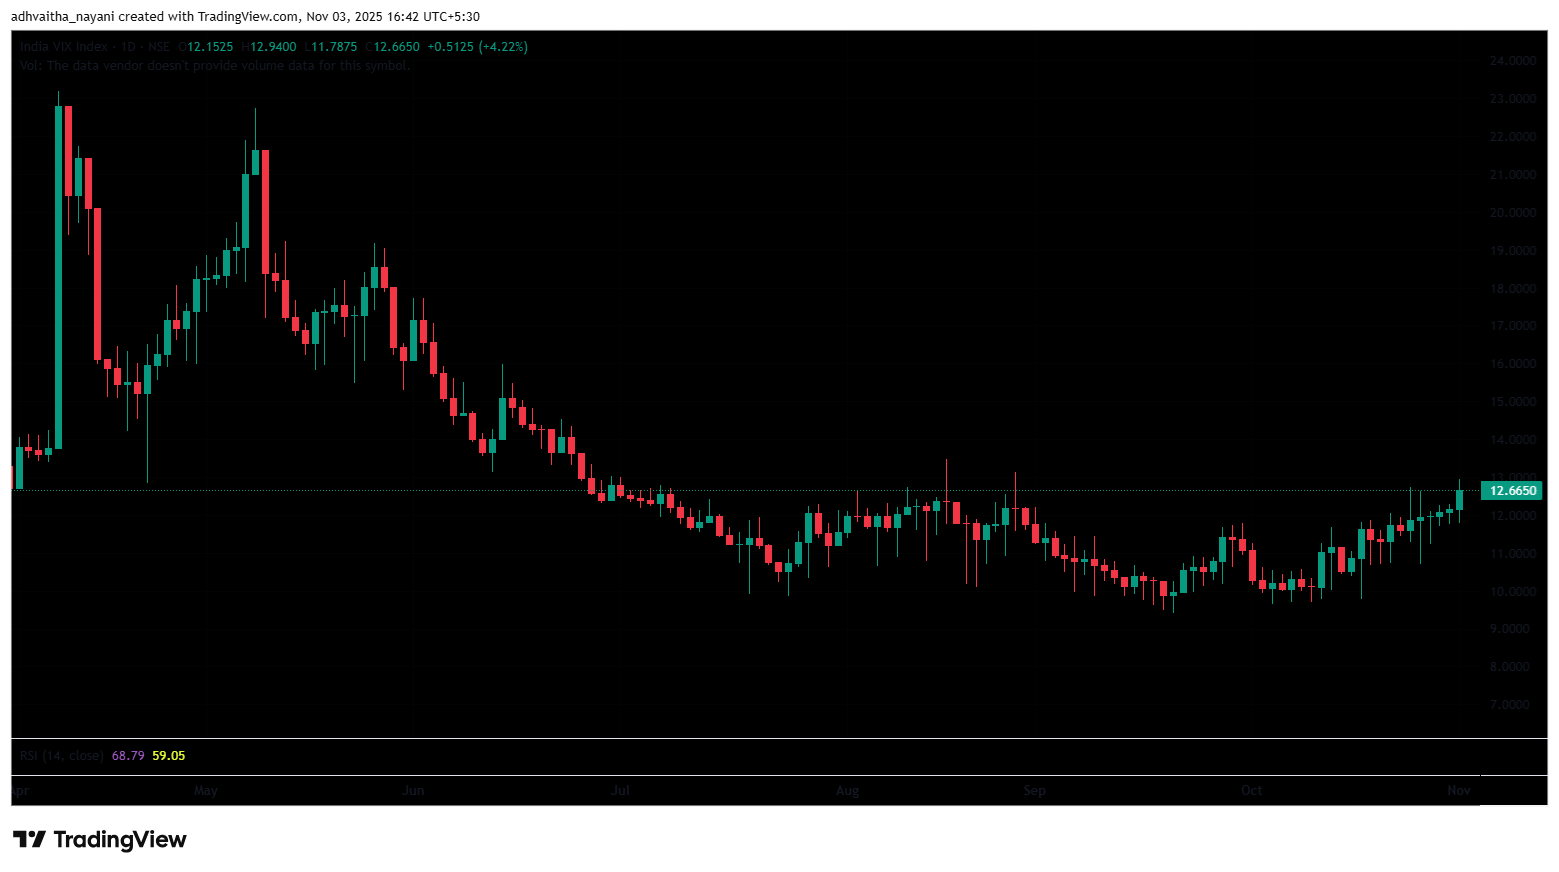
The India VIX increased by 0.5125 points or 4.22%, from 12.15 to 12.67 during Monday’s session. An increase in the India VIX typically indicates higher price volatility in the stock market, suggesting a less stable market environment. However, a stable market environment and minimal volatility are anticipated when the India VIX is below 15.
Market Recap on November 3rd, 2025
On Monday, the Nifty 50 started the week on a slightly negative note at 25,696.85, down -25.25 points from its previous close of 25,722.10. Later, the index moved towards an upward trajectory, hitting an intraday high of 25,803.10 before closing at 25,763.35, up 41.25 points (0.16%), near the 25,800 mark. The Nifty stayed above all major moving averages (20/50/100/200-day EMAs), reflecting strong underlying technical support.
The BSE Sensex followed a similar trajectory, opening lower at 83,835.10 (lower by -103.61 points from the previous close of 83,938.71), went above the 84,100 mark, and eventually settled at 83,978.49, up 39.78 points (0.05%). Both benchmarks ended the day in positive territory, with RSI values below the overbought zone (over 70), 58.99 for Nifty 50 and 58.00 for Sensex. The Bank Nifty also closed with gains of 325.10 points (0.56%) at 58,101.45.
Among sectoral indices, most ended in the green except for a few losers. The Nifty Realty Index was the top performer, rising 2.23% (21.10 points) to 968.65, driven by strong gains in Phoenix Mills Ltd, Lodha Developers Ltd, DLF Ltd, and Sobha Ltd, which advanced up to 3.80%.
The Nifty PSU Bank Index also added 1.92% (157.00 points) to 8,341.35, led by Bank of Baroda, Indian Bank, Canara Bank, and Punjab & Sind Bank, up to 4.60%. The Nifty Pharma Index also ended higher at 22,442.60 (+1.20%), supported by Wockhardt Ltd (+10.32%), along with modest gains in Ipca Laboratories Ltd, Ajanta Pharma Ltd, and Laurus Labs Ltd (up to 3.01%).
On the downside, the Nifty Consumer Durables Index was the biggest laggard, falling 0.3% (-112.05 points) to 38,503.05. Kajaria Ceramics Ltd led the declines with a 1.9% drop, followed by losses in Whirlpool of India Ltd, Voltas Ltd, and Amber Enterprises India Ltd (-1%). The Nifty IT Index slipped 0.2% (-59.25 points) to 35,653.1, dragged by TCS Ltd, Oracle Financial Services Software Ltd, and Tech Mahindra Ltd, which fell as much as 1.4%. The Nifty CPSE Index also closed lower by 0.1% (-9.05 points) at 6,606.6.
In the broader Asian markets, sentiment was mostly positive. Japan’s Nikkei 225 surged 2.12% (+1,085.73 points) to 52,411.34, Hong Kong’s Hang Seng advanced 0.97% (+251.71) to 26,158.36, China’s Shanghai Composite climbed 0.55% (+21.73) to 3,976.52, and South Korea’s KOSPI surged 2.78% (+114.37) to 4,221.87. As of 4:34 p.m. IST, U.S. Dow Jones Futures were up 0.11% (+52 points) at 47,774.
Trade Setup Summary
The Nifty 50 opened on a negative note at 25,697 on Monday but ended the session in the green above the 25,750 level at 25,763.3. A break below 25,696 could trigger further selling towards 25,575, while breaking the next resistance level of 25,835 could trigger bullishness towards the 25,952 level.
The Bank Nifty also started the session on a negative note at 57,727 but ended the session in the green at 58,101.45, near the 58,100 level. A break below 57,939 could trigger further selling towards 57,712, while breaking the next resistance level of 58,254 could trigger bullishness towards the 58,425 level.
The Sensex also opened on a negative note at 83,835 but ended the session on a flat note at 83,978.49, below the 84,000 level. A break below 83,874 could trigger further selling towards 83,666, while breaking the next resistance level of 84,233 could trigger bullishness towards the 84,617 level.
Given the ongoing volatility and mixed sentiments, it’s advisable to avoid aggressive positions and wait for clear directional moves above resistance or below support. Traders should consider these key support and resistance levels when entering long or short positions following the price break from these critical levels. Additionally, traders can combine moving averages to identify more accurate entry and exit points.
Disclaimer

The views and investment tips expressed by investment experts/broking houses/rating agencies on tradebrains.in are their own, and not that of the website or its management. Investing in equities poses a risk of financial losses. Investors must therefore exercise due caution while investing or trading in stocks. Trade Brains Technologies Private Limited or the author are not liable for any losses caused as a result of the decision based on this article. Please consult your investment advisor before investing.
About: Trade Brains Portal is a stock analysis platform. Its trade name is Dailyraven Technologies Private Limited, and its SEBI-registered research analyst registration number is INH000015729.
Investments in securities are subject to market risks. Read all the related documents carefully before investing.
Registration granted by SEBI and certification from NISM in no way guarantee performance of the intermediary or provide any assurance of returns to investors.

