
On Tuesday, the Indian equity markets demonstrated a clear bullish sentiment, with both the Nifty 50 and BSE Sensex opening on a positive note and maintaining upward momentum throughout the session. Key sectoral indices like IT and Auto led the gains, reflecting strong investor interest in technology and automobile stocks, while broader market indicators suggested that the rally was supported by healthy buying momentum. Technical signals pointed to sustained strength, with indices trading above major moving averages and momentum indicators remaining comfortably below overbought levels, indicating room for further upside.
However, not all sectors participated in the rally, as PSU banks and realty stocks lagged behind, reflecting selective sectoral weakness. Globally, Asian markets presented a mixed picture, with some markets retreating while others advanced, indicating cautious investor sentiment amid regional variances. U.S. futures were slightly positive, hinting at potential support for Indian markets in the near term. Overall, market sentiment was optimistic but selective, favouring sectors with strong earnings visibility and growth prospects.
In this overview, we will analyse the key technical levels and trend directions for Nifty and BSE Sensex to monitor in the upcoming trading sessions. All the charts mentioned below are based on the 5-minute timeframe.
NIFTY 50 Chart & Price Action Analysis
(In this analysis, we have used 20/50/100/200 EMAs, where 20 EMA (Red), 50 EMA (Orange), 100 EMA (Light Blue), and 200 EMA (Dark Blue)).
To view other technical reports, click here
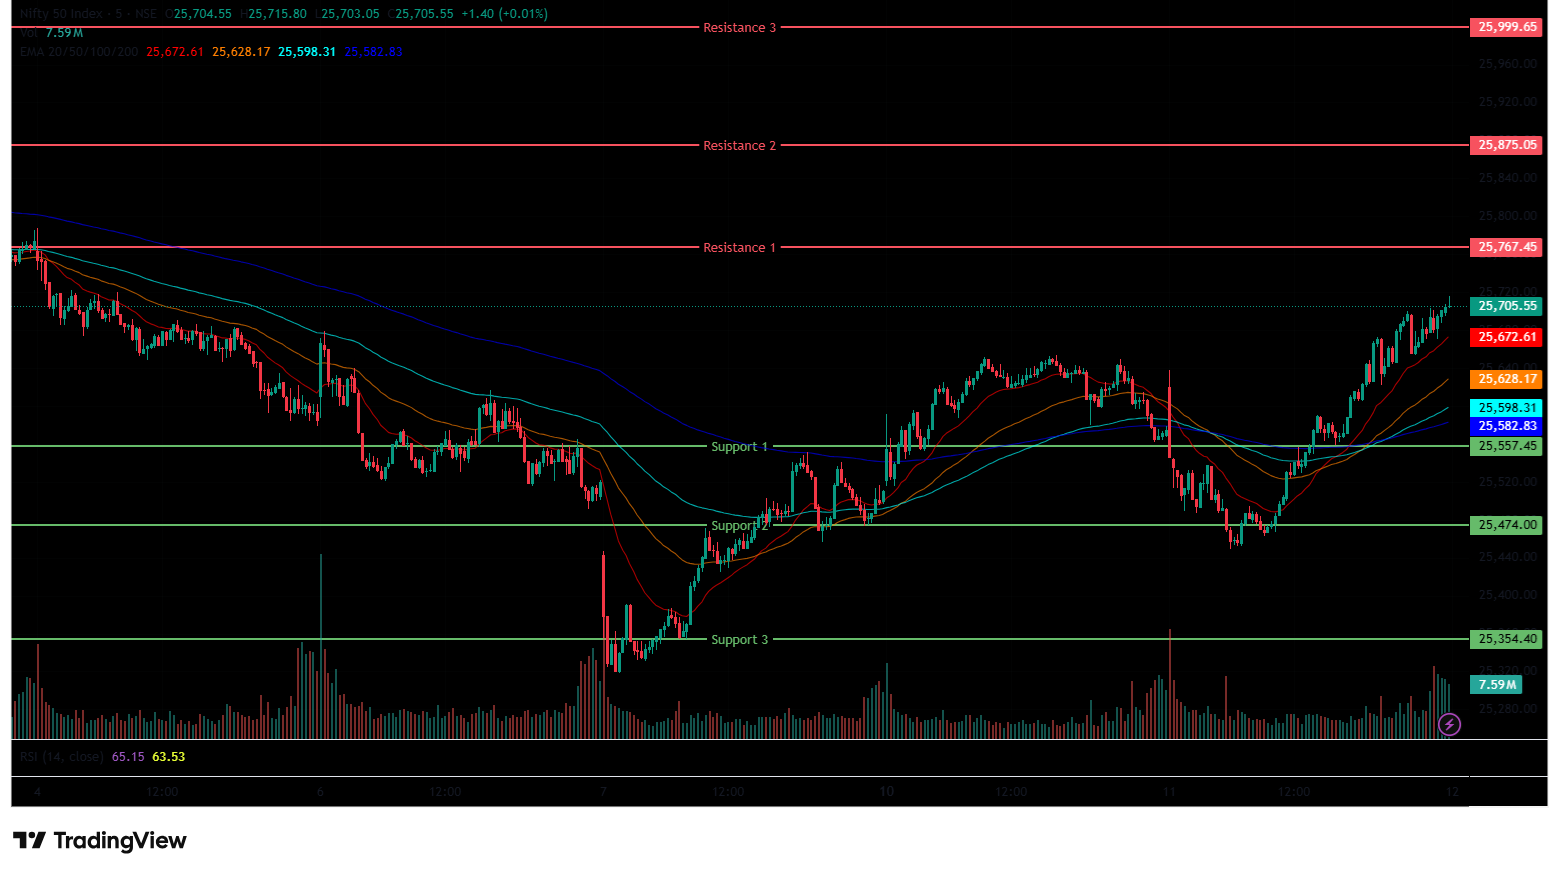
The Nifty 50 Index opened on a positive note at 25,617.00 on Tuesday, up by 42.65 points from Monday’s closing of 25,574.35. The index opened on a bullish note but was dragged down to the 25,449 level, marking its day low. Later, the Index recovered from the day’s low and traded within the 25,400-25,600 range. It traded above the EMAs of 20/50 but below the 100/200-day EMA in the 15-minute chart in the morning session.
In the afternoon session, the index made its intraday high of 25,716 and settled above the 25,650 level. Overall, the Index traded within a 25,550-25,750 range throughout the afternoon session. During the afternoon session, the Nifty 50 closed above all four EMAs of 20/50/100/200 in the 15-minute time frame.
The Nifty’s immediate resistance levels are R1 (25,767), R2 (25,875), and R3 (25,999.6), while immediate support levels are S1 (25,557), S2 (25,474) and S3 (25,354). The Nifty index had reached a day’s high at 25,715.80 and saw a day’s low at 25,449.25. Finally, it had closed at 25,694.95, in the green and above the 25,650 level, up 120.60 points, or 0.47%. The Nifty 50 closed above all four EMAs of 20/50/100/200 in the daily time frame.
NIFTY 50 Momentum Indicators Analysis
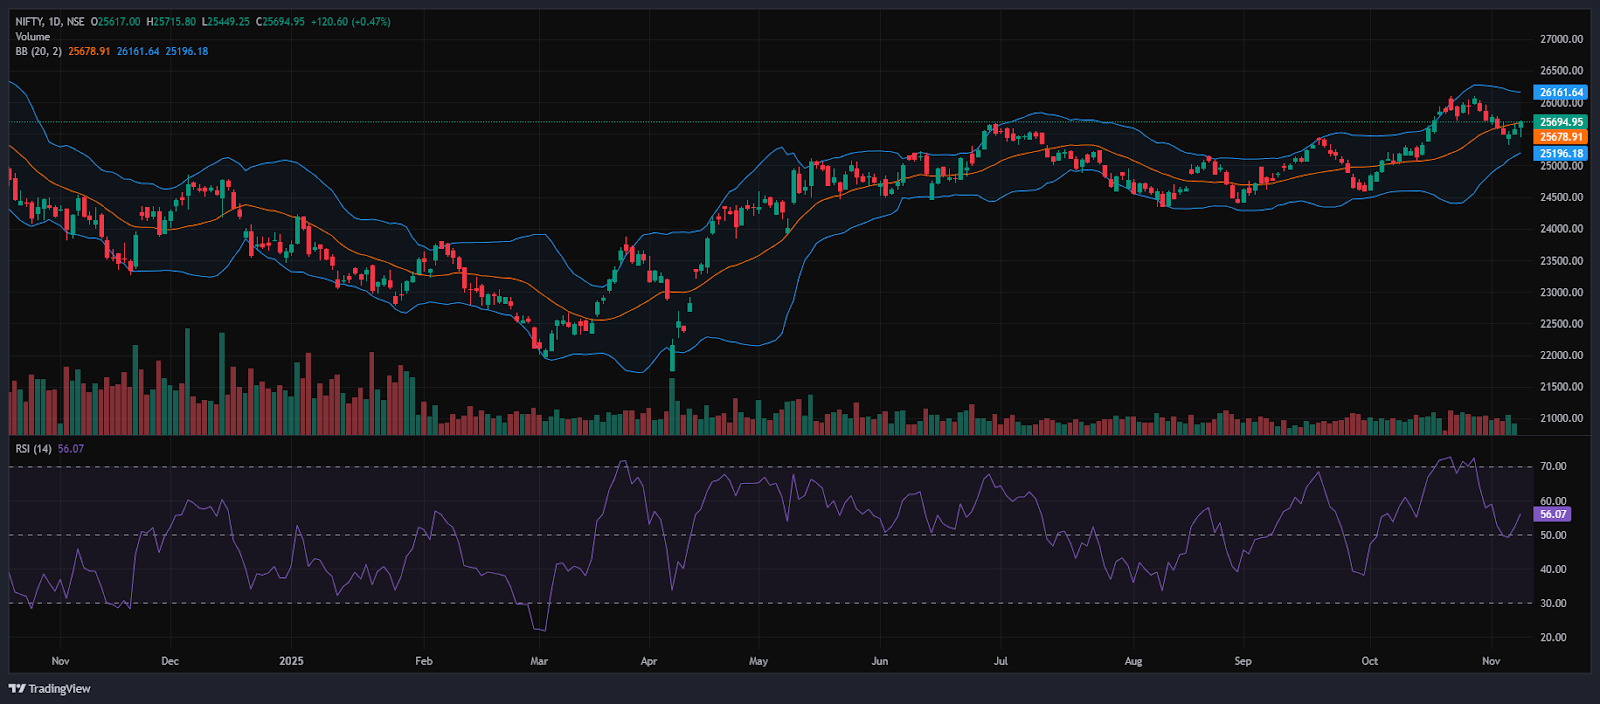
RSI (Daily): The Nifty 50’s RSI stood at 56.07, which is below the overbought zone of 70, indicating bullish sentiment.
Bollinger Bands (Daily): The index is trading in the upper band of the Bollinger Band range (Simple Moving Average). Its position in the upper range suggests a bullish sentiment, and in the daily time frame on Tuesday session, the Index ended on a bullish note. The index took support near 25,449, and 25,716 acted as a resistance level. A sustained move above the middle band signals a bullish sentiment, while a drop back toward the lower band may reinforce bearish sentiment.
Volume Analysis: Tuesday’s trading session had an average volume of 297.71 Mn.
Derivatives Data: Options OI indicates strong Put writing at 25,650, followed by 25,600, establishing a strong support zone. On the upside, a significant Call OI buildup at 25,700 and 25,750 suggests a potential resistance supply. PCR (Put/Call Ratio) stands at 1.04 (>1), leaning towards neutral sentiment and the long Buildup indicates a Strong Bullish outlook, thus indicating a neutral to bullish outlook for the next trading session.
Bank Nifty Chart & Price Action Analysis
(In this analysis, we have used 20/50/100/200 EMAs, where 20 EMA (Red), 50 EMA (Orange), 100 EMA (Light Blue), and 200 EMA (Dark Blue)).
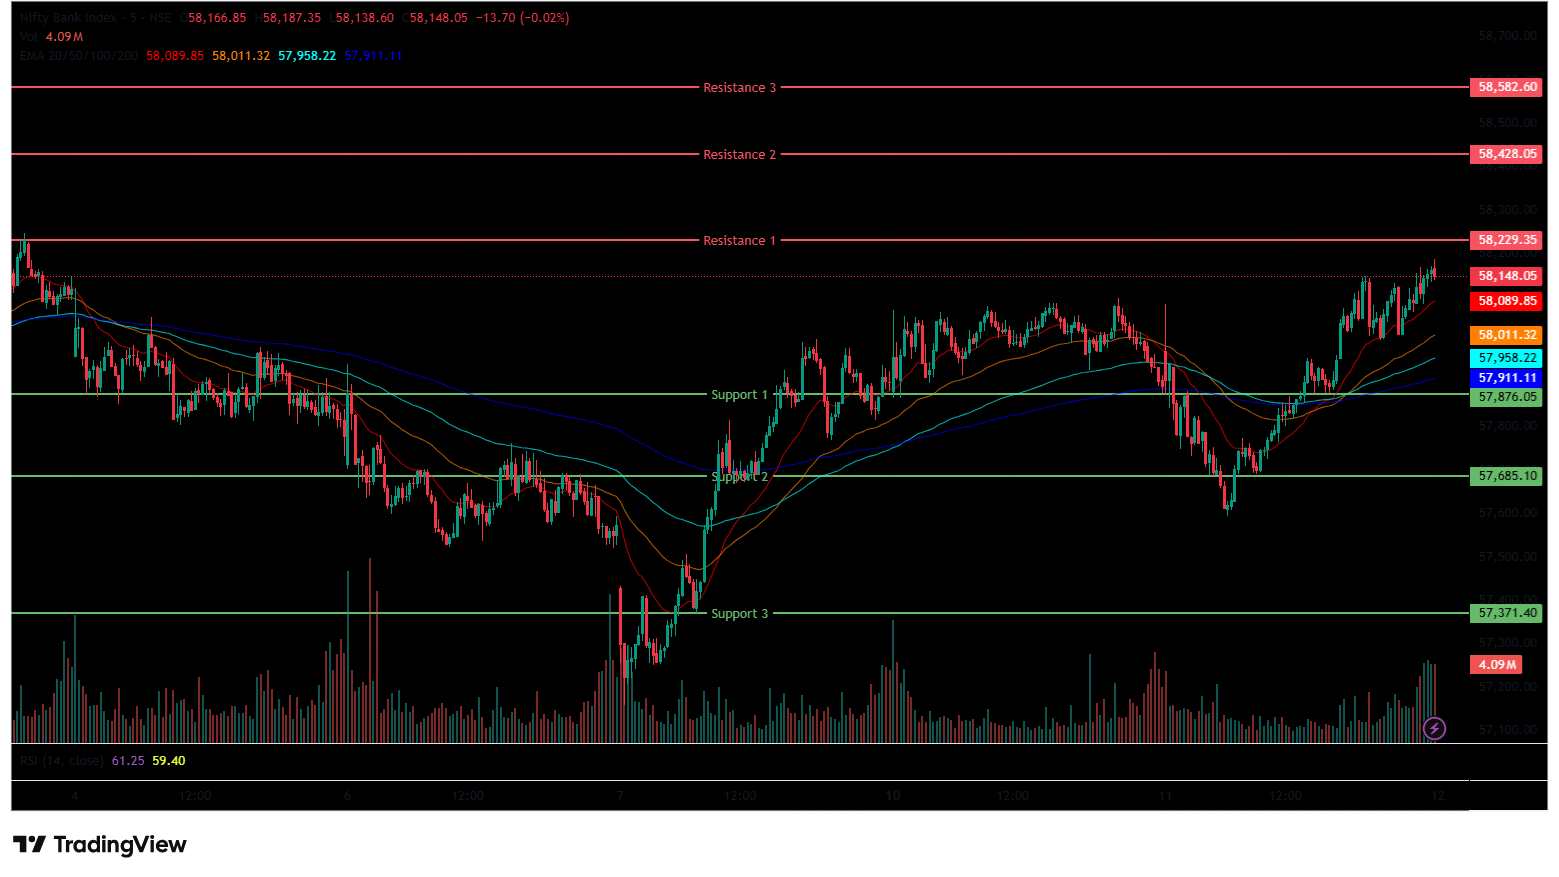
The Bank Nifty Index started the session on a positive note at 57,962.30 on Tuesday, up by 24.75 points from Monday’s closing of 57,937.55. The index started on a bullish note but was dragged down to the 57,594 level, marking its day low. Later, the Index recovered from the day’s low and was trading within the 57,550-58,000 range and was trading above all four EMAs of 20/50/100/200 in the 15-minute time frame in the morning session.
In the afternoon session, the Index hit an intraday high at 58,187 and settled above the 58,100 level. Further, the Index was trading in the range of 57,850-58,200, and ended with gains in green. During the afternoon session, Bank Nifty closed above all four EMAs of 20/50/100/200 in the 15-minute time frame.
The Bank Nifty’s immediate resistance levels are R1 (58,229), R2 (58,428) and R3 (58,583), while immediate support levels are S1 (57,876), S2 (57,685), and S3 (57,371). The Bank Nifty index had peaked at 58,187.35 and made a day’s low at 57,594.25. Finally, it had closed in green at 58,138.15, rising above the 58,100 level, gaining 200.60 points or 0.35%. The Relative Strength Index (RSI) stood at 62.95, below the overbought zone of 70 in the daily time frame, and Bank Nifty closed above all four EMAs of 20/50/100/200 in the daily time frame.
BSE Sensex Chart & Price Action Analysis
(In this analysis, we have used 20/50/100/200 EMAs, where 20 EMA (Red), 50 EMA (Orange), 100 EMA (Light Blue), and 200 EMA (Dark Blue)).
To view other technical reports, click here
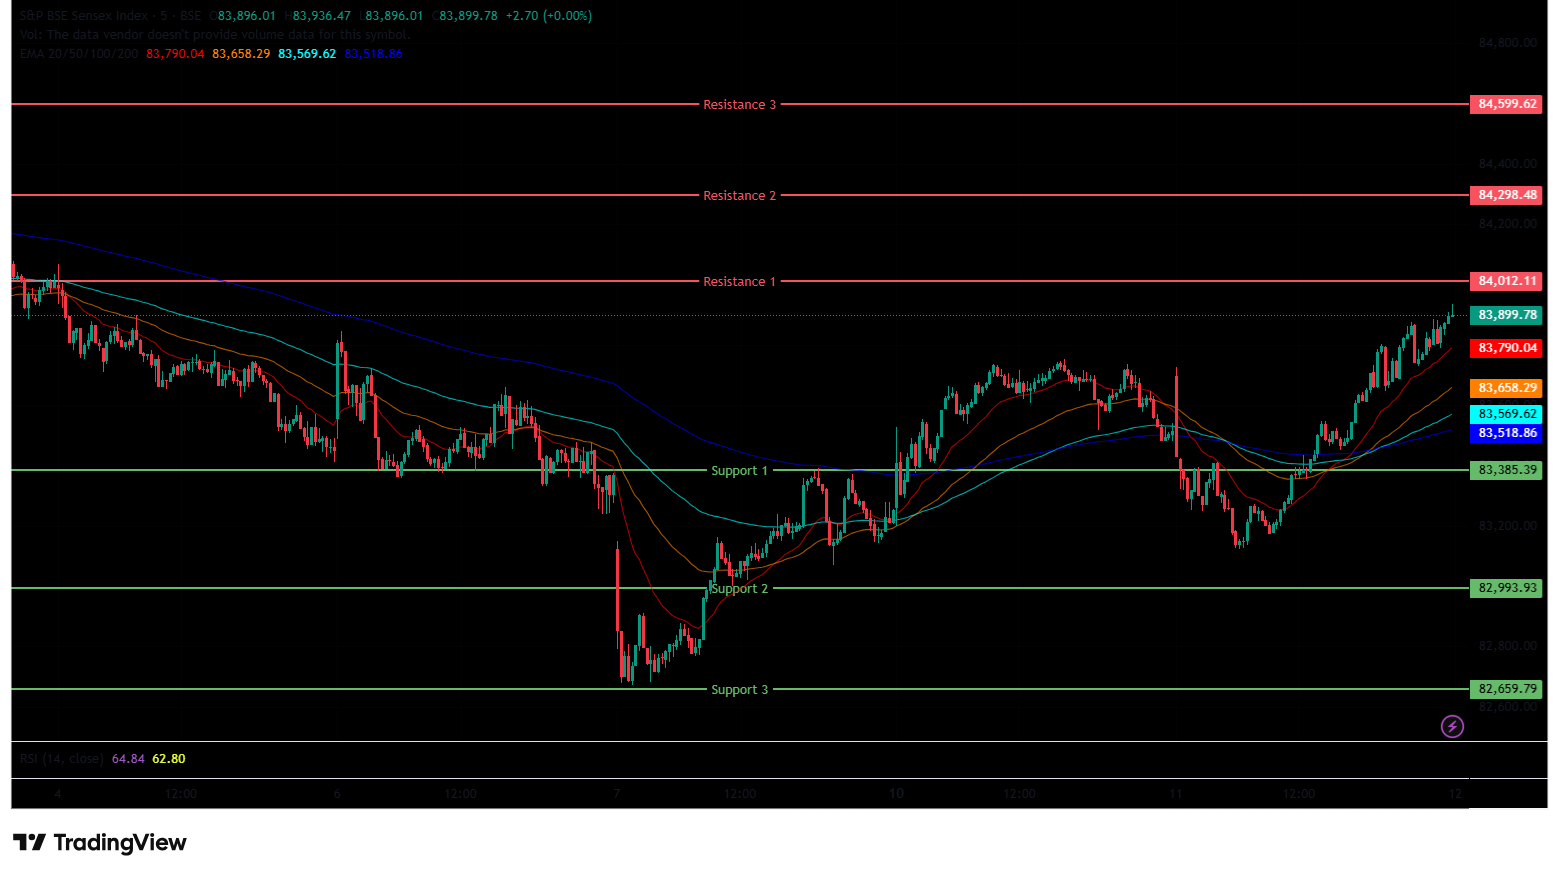
The BSE Sensex Index opened on a positive note at 83,671.52 on Tuesday, up by 136.17 points from Monday’s closing of 83,535.35. The index started its session on a bullish note but was dragged down to the 83,124 level, marking its day low. Later, the Index recovered from the day’s low and was trading within the 83,100-83,500 range. It traded above the EMAs of 20/50 but below the 100/200-day EMAs in the 15-minute time frame in the morning session.
In the afternoon session, the Index further climbed and touched 83,936, marking its day’s high and settled above 83,850. The Index was trading in the 83,450-83,950 range, following a bullish trend and closed above all four EMAs of 20/50/100/200 in the 15-minute time frame. The BSE Sensex immediate resistance levels are R1 (84,012), R2 (84,298) and R3 (84,600), while immediate support levels are S1 (83,385), S2 (82,994), and S3 (82,660).
The BSE Sensex index had peaked at 83,936.47 and made a day’s low at 83,124.03. Finally, it had closed at 83,871.32 in green, gaining 335.97 points or 0.40%. The Relative Strength Index (RSI) stood at 56.38, below the overbought zone of 70 in the daily time frame, and the BSE Sensex closed above all four EMAs of 20/50/100/200 in the daily time frame.
Market Recap on November 11th, 2025
On Tuesday, the Nifty 50 opened slightly higher at 25,617.00, up 42.65 points from its previous close of 25,574.35. The index hit an intraday high of 25,715.80 and closed at 25,694.95, up 120.60 points, or 0.47%. The index closed above all key moving averages (20/50/100/200-day EMAs) on the daily chart. The BSE Sensex followed the same trajectory, opening on a slightly positive trend at 83,671.52, up 136.17 points from the previous close of 83,535.35. It closed at 83,871.32, up 335.97 points, or 0.40%. Both indices showed high momentum, with RSI values for Nifty 50 at 56.07 and Sensex at 56.38, below the overbought threshold of 70.
On Tuesday, indices show a bullish reaction. The Nifty IT index was the major gainer, rising 1.2% or 428.65 points, and standing at 36,116.90. Stocks such as Persistent Systems Ltd rose 2.84%, followed by HCL Technologies Ltd and Coforge Ltd, which gained up to 2.25% on Tuesday. The Nifty Auto index was also among the biggest gainers, rising 1.07% or 288.40 points, and standing at 27,148.25. Stocks such as Bharat Forge Ltd jumped 5.55% on Tuesday. While other auto stocks like Samvardhana Motherson, Ashok Leyland, and Mahindra & Mahindra Ltd also gained up to 2.84%.
Among the Sectoral Losers, the Nifty PSU Bank Index was the biggest loser, falling -0.39%, or -32.75 points, to 8,307.95. PSB stocks like Central Bank of India, UCO Bank, Bank of Maharashtra, and Indian Overseas Bank saw declines of up to -3.31%. The Nifty Realty Index also fell on Tuesday’s trade, ending at 942.60, down -1.55 or -0.16%.
Asian markets had a mixed sentiment on Tuesday. Japan’s Nikkei 225 declined by -270.76 points or -0.53%, closing at 50,641.00. China’s Shanghai Composite decreased by -15.84 points, or -0.40%, to 4,002.76, while Hong Kong’s Hang Seng Index rose by 52.94 points, or 0.2%, to close at 26,702.00. On the other hand, South Korea’s KOSPI continues to rise by 33.15 points or 0.81%, closing at 4,106.39. At 4:49 p.m. IST, U.S. Dow Jones Futures were up, increasing 0.09% or 42.36 points, at 47,413.99.
India VIX
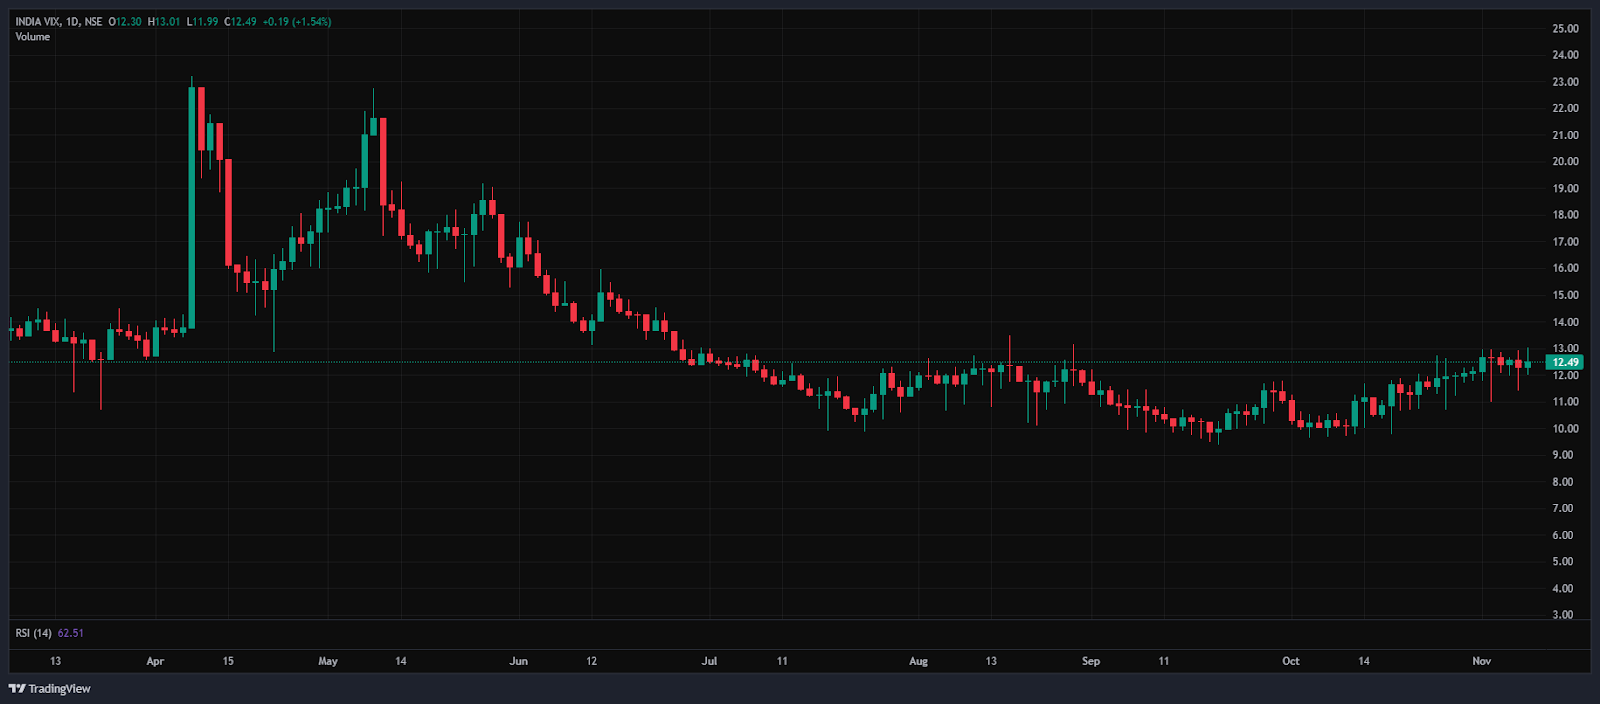
The India VIX increased 0.19 points or 1.54%, from 12.30 to 12.49 during Tuesday’s session. An increase in the India VIX typically indicates higher price volatility in the stock market, suggesting a less stable market environment. However, a stable market environment and minimal volatility are anticipated when the India VIX is below 15.
Trade Setup Summary
The Nifty 50 opened on a positive note at 25,617.00 on Tuesday and ended the session in the green above the 25,650 level at 25,694.95. A break below 25,557 could trigger further selling towards 25,474, while breaking the next resistance level of 25,767 could trigger bullishness towards the 25,875 level.
The Bank Nifty also started the session on a positive note at 57,962.30 and ended the session in the green at 58,138.15, above the 58,100 level. A break below 57,876 could trigger further selling towards 57,685, while breaking the next resistance level of 58,229 could trigger bullishness towards the 58,428 level.
The Sensex opened on a positive note at 83,671.52 and ended the session in the green at 83,871.32, above the 83,850 level. A break below 83,385 could trigger further selling towards 82,994, while breaking the next resistance level of 84,012 could trigger bullishness towards the 84,298 level.
Given the ongoing volatility and mixed sentiments, it’s advisable to avoid aggressive positions and wait for clear directional moves above resistance or below support. Traders should consider these key support and resistance levels when entering long or short positions following the price break from these critical levels. Additionally, traders can combine moving averages to identify more accurate entry and exit points.
Disclaimer

The views and investment tips expressed by investment experts/broking houses/rating agencies on tradebrains.in are their own, and not that of the website or its management. Investing in equities poses a risk of financial losses. Investors must therefore exercise due caution while investing or trading in stocks. Trade Brains Technologies Private Limited or the author are not liable for any losses caused as a result of the decision based on this article. Please consult your investment advisor before investing.
About: Trade Brains Portal is a stock analysis platform. Its trade name is Dailyraven Technologies Private Limited, and its SEBI-registered research analyst registration number is INH000015729.
Investments in securities are subject to market risks. Read all the related documents carefully before investing.
Registration granted by SEBI and certification from NISM in no way guarantee performance of the intermediary or provide any assurance of returns to investors.
