Indian equity markets ended Thursday’s session on a cautious yet resilient note, as both the Nifty 50 and Sensex managed to close with marginal gains after a volatile trading day. The benchmarks opened on a positive note and sustained strength through the session but eventually pared most of their intraday advances due to profit booking and continued selling by foreign institutional investors. Despite the muted close, both indices remained above their key moving averages, reflecting underlying market strength, even as traders maintained a watchful stance ahead of the upcoming Bihar election results.
Sectorally, the markets displayed a mixed trend. The housing and metal indices outperformed, supported by buying interest in select stocks from these segments, while PSU bank and CPSE stocks witnessed selling pressure, dragging down their respective indices. Broader sentiment in Asian markets remained upbeat, with key regional indices posting modest gains, which provided some support to domestic equities amid the prevailing caution.
In this overview, we will analyse the key technical levels and trend directions for Nifty and BSE Sensex to monitor in the upcoming trading sessions. All the charts mentioned below are based on the 15-minute timeframe.
NIFTY 50 Chart & Price Action Analysis
To view other technical reports, click here
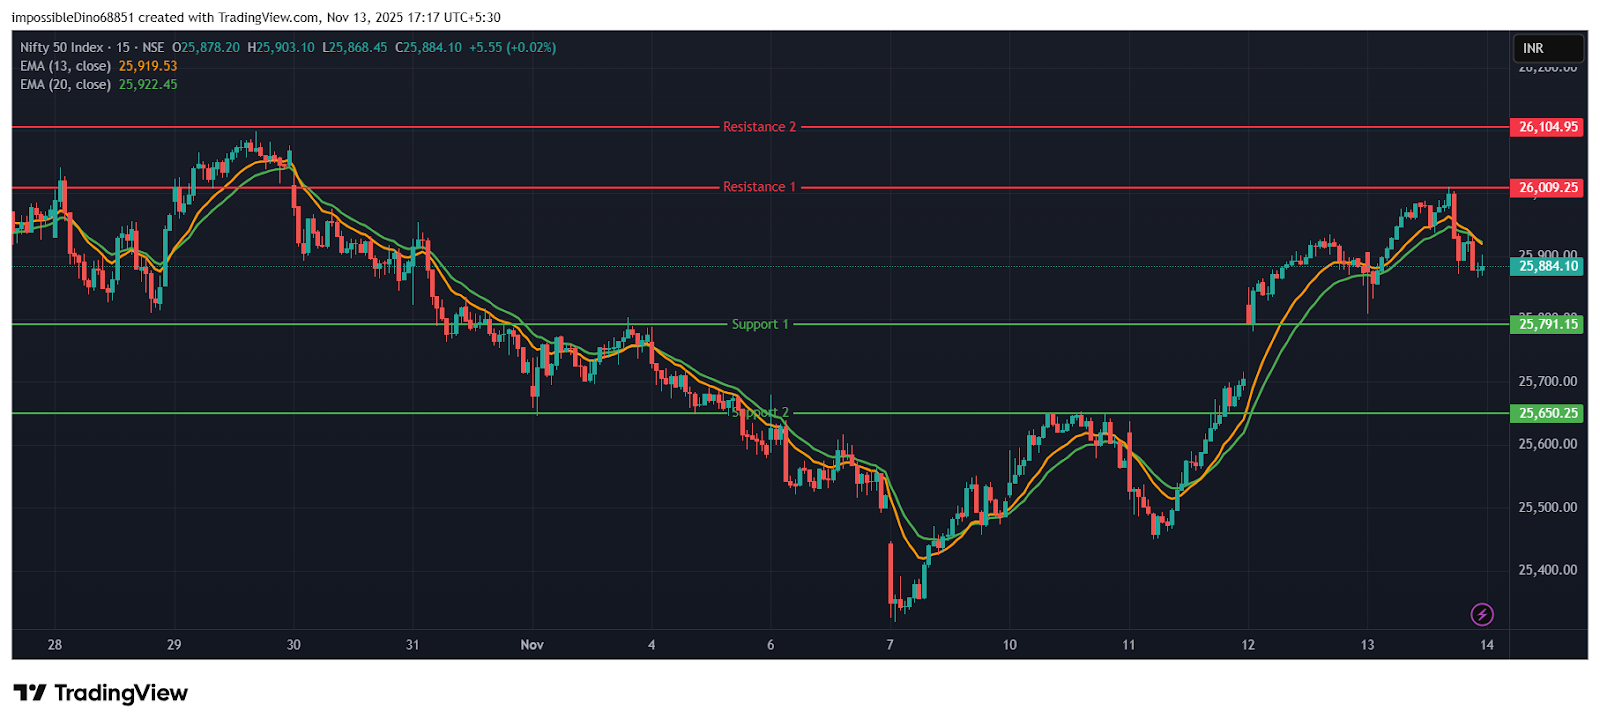
The Nifty 50 Index opened on a positive note at 25,906.10 on Thursday, up by 30.3 points from Wednesday’s closing of 25,875.80. The index opened on a bullish note on Thursday and reached the day’s high at 26,010.70, hovering near the key level of 26,000. The index continued its upward trend in the morning session and was trading within the range of 25,850 and 26,000; however, in the afternoon session, it declined from its day’s high to end the session at its opening level.
The Nifty index had reached a day’s high at 26,010.70 and saw a day’s low at 25,808.40. Finally, it had closed at 25,879.15, on a flatter note but above the 25,850 level, up 3.35 points, or 0.01%. The index’s nearest resistance level is at 26,009.25 (R1), which it has failed to stay above multiple times. The higher resistance level is at 26,104.95 (R2), which is the 52-week high for the index.
On the other hand, the closest support is now at 25,791.15 (S1), which was a previous resistance level but has turned into support. If the index falls below this, the next support level to watch is at 25,650.25 (S2).
Trade Setup:
| Nifty 50 | |
| Resistance 2 | 26,104.95 |
| Resistance 1 | 26,009.25 |
| Closing Price | 25,879.15 |
| Support 1 | 25,791.15 |
| Support 2 | 25,650.25 |
NIFTY 50 Momentum Indicators Analysis
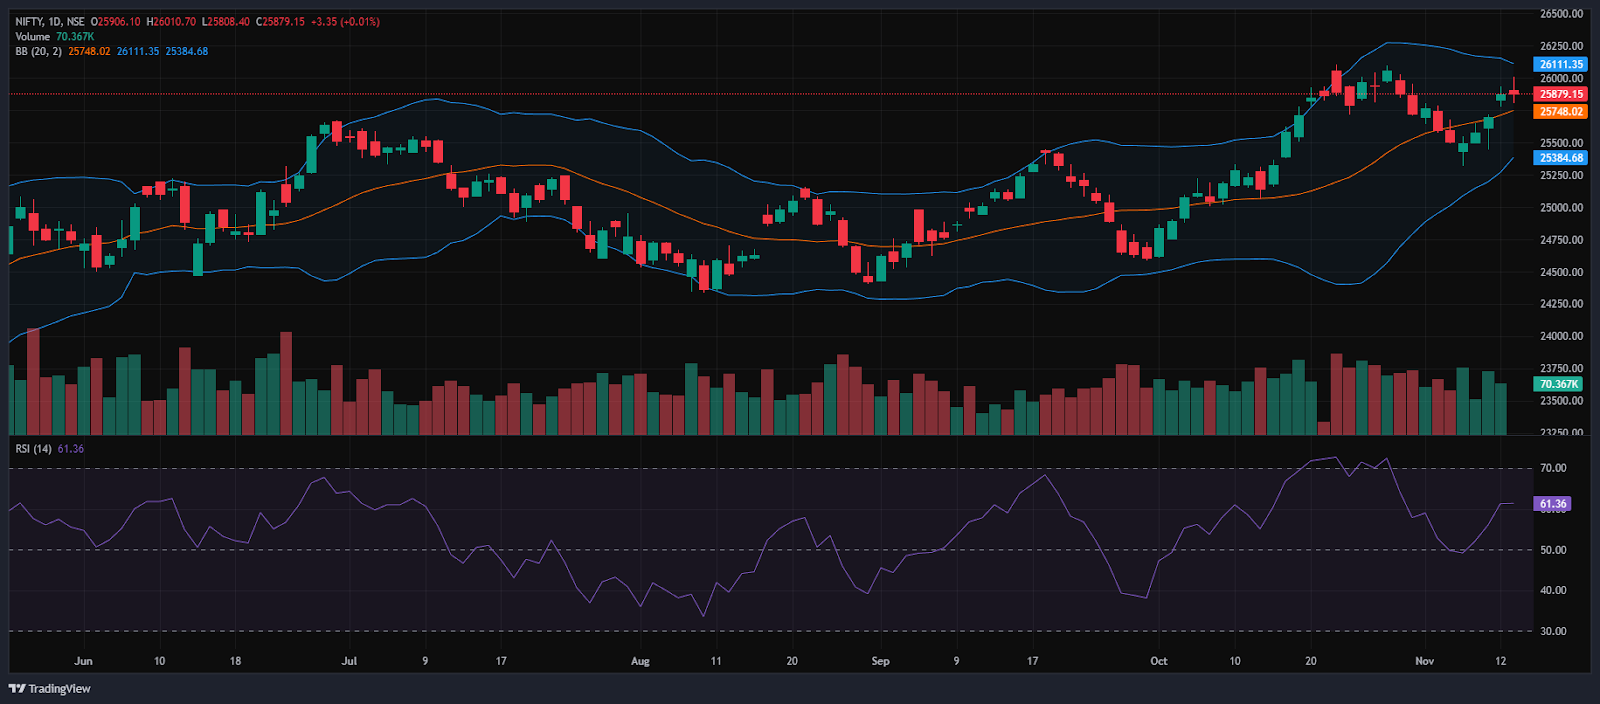
RSI (Daily): The Nifty 50’s RSI stood at 61.32, which is below the overbought zone of 70, indicating bullish sentiment and room to grow higher.
Bollinger Bands (Daily): The index is trading in the upper band of the Bollinger Band range (Simple Moving Average). Its position in the upper range suggests a bullish sentiment, but in Thursday’s session, the Index ended on a flat-bullish note. The index took support near 25,808, and 26,011 acted as a resistance level. A sustained move above the middle band signals a bullish sentiment, while a drop back toward the lower band may reinforce bearish sentiment.
Volume Analysis: Thursday’s trading session had an above-average volume of 373.09 Mn.
Derivatives Data: Options OI indicates strong Put writing at 25,800, followed by 25,700, establishing a strong support zone. On the upside, a significant Call OI buildup at 25,900 and 26,000 suggests a potential supply of resistance. PCR (Put/Call Ratio) stands at 1.06 (>=1), leaning towards neutral sentiment, and the long Buildup indicates that long buyers are entering their positions, which signals a Strong Bullish outlook, thus indicating a neutral to bullish outlook for the next trading session.
Bank Nifty Chart & Price Action Analysis

The Bank Nifty Index opened on a negative note at 58,158.75 on Thursday, down by 115.89 points from Wednesday’s closing of 58,274.65. The index opened on a negative note on Thursday; however, in the morning session, it continued to rally, trading between the 58,200 and 58,600 levels. In the afternoon session, the index, however, continued to decline and traded between the range of 58,380 and 58,600.
The Bank Nifty index had peaked at 58,615.95 and made a day’s low at 58,127.10. Finally, it had closed in green at 58,381.95, rising above the 58,350 level, gaining 107.30 points or 0.18%. The Relative Strength Index (RSI) stood at 61.80, below the overbought zone of 70 in the daily time frame. The index’s nearest resistance levels are at 58,467.10 (R1), which it has failed to stay above multiple times. The higher resistance level is at 58,613.80 (R2), which is near to the 52-week high for the index.
On the other hand, the closest support is now at 58,188.10 (S1), which were previous resistance levels but have turned into support. If the index falls below this, the next support level to watch is at 57,611.5 (S2).
Trade Setup:
| Bank Nifty | |
| Resistance 2 | 58,613.80 |
| Resistance 1 | 58,467.10 |
| Closing Price | 58,381.95 |
| Support 1 | 58,188.10 |
| Support 2 | 57,611.50 |
BSE Sensex Chart & Price Action Analysis

To view other technical reports, click here
The BSE Sensex Index opened on a positive note at 84,525.89 on Thursday, up by 59.38 points from Wednesday’s closing of 84,466.51. The Sensex index also opened on a bullish note, mirroring Nifty 50 on Thursday, and continued its uptrend in the morning session. It traded between the range of 84,253 and 84,850 during the morning session. In the afternoon session, the index peaked at 84,919 and fell from its day’s high and traded between the range of 84,400 and 84,950.
The BSE Sensex index had peaked at 84,919.43 and made a day’s low at 84,253.05. Finally, it had closed at 84,478.67 in green, gaining 12.16 points or 0.014%. The Relative Strength Index (RSI) stood at 61.80, below the overbought zone of 70 in the daily time frame.
The index faces immediate resistance at 84,648.65 (R1) and 84,917.25 (R2), levels it has struggled to sustain above. The next key resistance is at 85,258.17 (R3), near its 52-week high. On the downside, support lies at 84,237.99 (S1) and 83,753.47 (S2), both former resistance levels, with a deeper support at 83,138.97 (S3) if these are breached.
Trade Setup:
| Sensex | |
| Resistance 3 | 85,258.17 |
| Resistance 2 | 84,917.25 |
| Resistance 1 | 84,648.64 |
| Closing Price | 84,478.67 |
| Support 1 | 84,237.99 |
| Support 2 | 83,753.47 |
| Support 3 | 83,138.97 |
Market Recap on November 13th, 2025
On Thursday, the Nifty 50 opened higher at 25,906.1, up 30.3 points from its previous close of 25,875.8. The index hit an intraday high of 26,010.70 and closed at 25,879.15, slightly up 3.35 points, or 0.013%. The index closed above all key moving averages (20/50/100/200-day EMAs) on the daily chart. The BSE Sensex followed the same trajectory, opening on a positive trend at 84,525.89, up 59.38 points from the previous close of 84,466.51.
It closed at 84,478.67, up 12.16 points, or 0.014%. Both indices showed high momentum, with RSI values for Nifty 50 at 61.36 and Sensex at 61.80, below the overbought threshold of 70. Both indices closed on marginal gains today, as the markets witnessed profit booking, FII’s selling for the third consecutive day and caution ahead of the election results in Bihar.
The Nifty Housing index was the major gainer, rising 0.4% or 52.4 points, and standing at 11,877.35. Stocks such as Asian Paints Ltd rose 4%, followed by City Union Bank Ltd and Berger Paints India Ltd, which gained up to 3.3% on Thursday. The Nifty Metal index was also among the biggest gainers, rising 0.4% or 46.05 points, and standing at 10,588.6. Stocks such as Hindustan Zinc Ltd jumped 2.8% on Thursday. While other Metal stocks like Hindalco Industries Ltd, Vedanta Ltd, and Welspun Corp Ltd also gained up to 2.2%.
On the sectoral losers, the Nifty PSU Bank Index was the biggest loser, falling -0.68%, or -56.70 points, to 8,303.05. PSB stocks like Union Bank of India, Bank of India, and Punjab & Sind Bank Ltd saw declines of up to -2.81%. The Nifty CPSE Index also fell on Thursday’s trade, ending at 6,440.60, down -39.00 or -0.6%.
Asian markets had a positive sentiment on Thursday. Japan’s Nikkei 225 gained by 126.69 points or 0.25%, closing at 51,190.00. China’s Shanghai Composite increased by 29.36 points, or 0.73%, to 4,000.14, while Hong Kong’s Hang Seng Index also rose by 148.27 points, or 0.55%, to close at 27,071.00. On the other hand, South Korea’s KOSPI continues to rise by 20.24 points or 0.49%, closing at 4,170.63.
India VIX

The India VIX increased 0.053 points or 0.43%, from 12.11 to 12.16 during Thursday’s session. An increase in the India VIX typically indicates higher price volatility in the stock market, suggesting a less stable market environment. However, a stable market environment and minimal volatility are anticipated when the India VIX is below 15.
Given the ongoing volatility and mixed sentiments, it’s advisable to avoid aggressive positions and wait for clear directional moves above resistance or below support. Traders should consider these key support and resistance levels when entering long or short positions following the price break from these critical levels. Additionally, traders can combine moving averages to identify more accurate entry and exit points.
Disclaimer

The views and investment tips expressed by investment experts/broking houses/rating agencies on tradebrains.in are their own, and not that of the website or its management. Investing in equities poses a risk of financial losses. Investors must therefore exercise due caution while investing or trading in stocks. Trade Brains Technologies Private Limited or the author are not liable for any losses caused as a result of the decision based on this article. Please consult your investment advisor before investing.
About: Trade Brains Portal is a stock analysis platform. Its trade name is Dailyraven Technologies Private Limited, and its SEBI-registered research analyst registration number is INH000015729.
Investments in securities are subject to market risks. Read all the related documents carefully before investing.
Registration granted by SEBI and certification from NISM in no way guarantee performance of the intermediary or provide any assurance of returns to investors.
