India’s equity benchmarks opened the week on a firm note, extending their upward momentum and closing comfortably in positive territory. Both the Nifty 50 and the Sensex maintained strength throughout the session, remaining above key technical support levels and reflecting healthy market sentiment. Technical indicators such as the RSI also suggested sustained bullishness without drifting into overbought conditions.
Sectoral performance further reinforced the optimistic tone, with all major indices finishing higher. Banking, auto, and mid-cap segments led the rally, supported by notable gains in select stocks across these categories. While domestic markets advanced strongly, broader Asian cues were mixed, with some regional indices facing mild pressure even as others managed to post gains. Overall, the market environment signalled resilience and continued investor confidence at the start of the week.
In this overview, we will analyse the key technical levels and trend directions for Nifty and BSE Sensex to monitor in the upcoming trading sessions. All the charts mentioned below are based on the 15-minute timeframe.
NIFTY 50 Chart & Price Action Analysis
To view other technical reports, click here
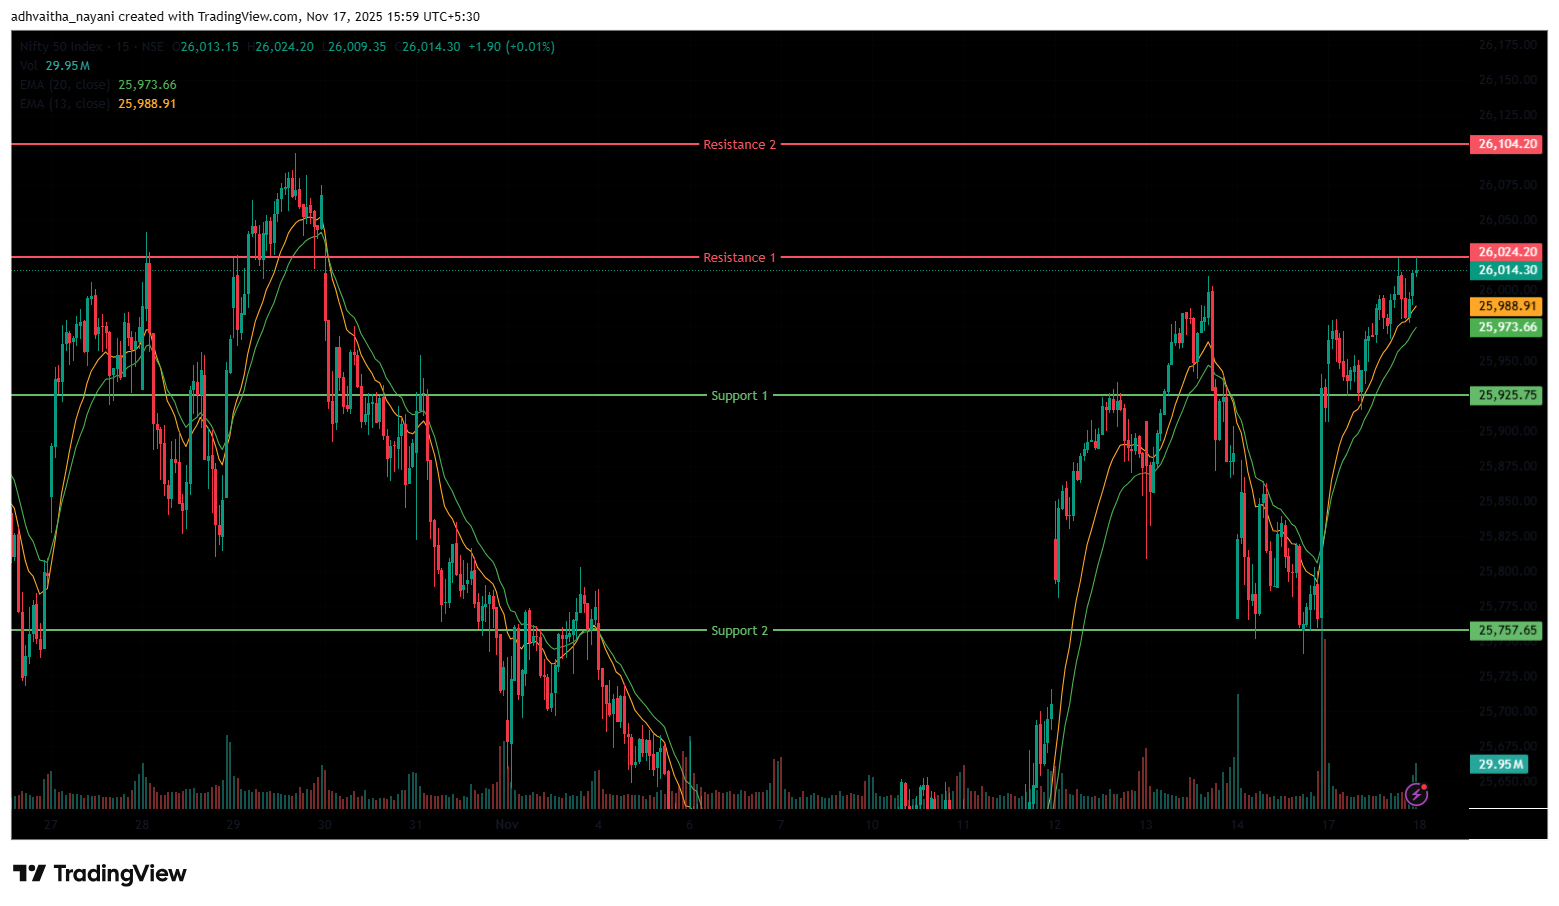
The Nifty 50 Index opened on a positive note at 25,948.20 on Monday, up by 38.15 points from Friday’s closing of 25,910.05. The index opened on a strong note on Monday, hovering near the key level of 25,950. The index formed a range-bound trend in the morning session and was trading within the range of 25,920 and 25,980; however, in the afternoon session, it continued its upward trend from its day’s low and settled above the 26,000 level, ending the session on a Bullish note.
The Nifty index had reached a day’s high at 26,024.20 and saw a day’s low at 25,906.35. Finally, it had closed at 26,013.45, in the green, above the 26,000 level, up 103.40 points, or 0.40%. In the short term, the Index was above the 13/20 day EMA in the daily time frame, indicating an uptrend.
The index’s nearest resistance level is at 26,024.20 (R1), which it has failed to stay above multiple times. The higher resistance level is at 26,104.20 (R2), which is the 52-week high for the index. On the other hand, the closest support is now at 25,925.75 (S1), which was a previous resistance level but has turned into support. If the index falls below this, the next support level to watch is at 25,757.65 (S2).
Trade Setup:
| Nifty 50 | |
| Resistance 2 | 26,104.20 |
| Resistance 1 | 26,024.20 |
| Closing Price | 26,013.45 |
| Support 1 | 25,925.75 |
| Support 2 | 25,757.65 |
NIFTY 50 Momentum Indicators Analysis
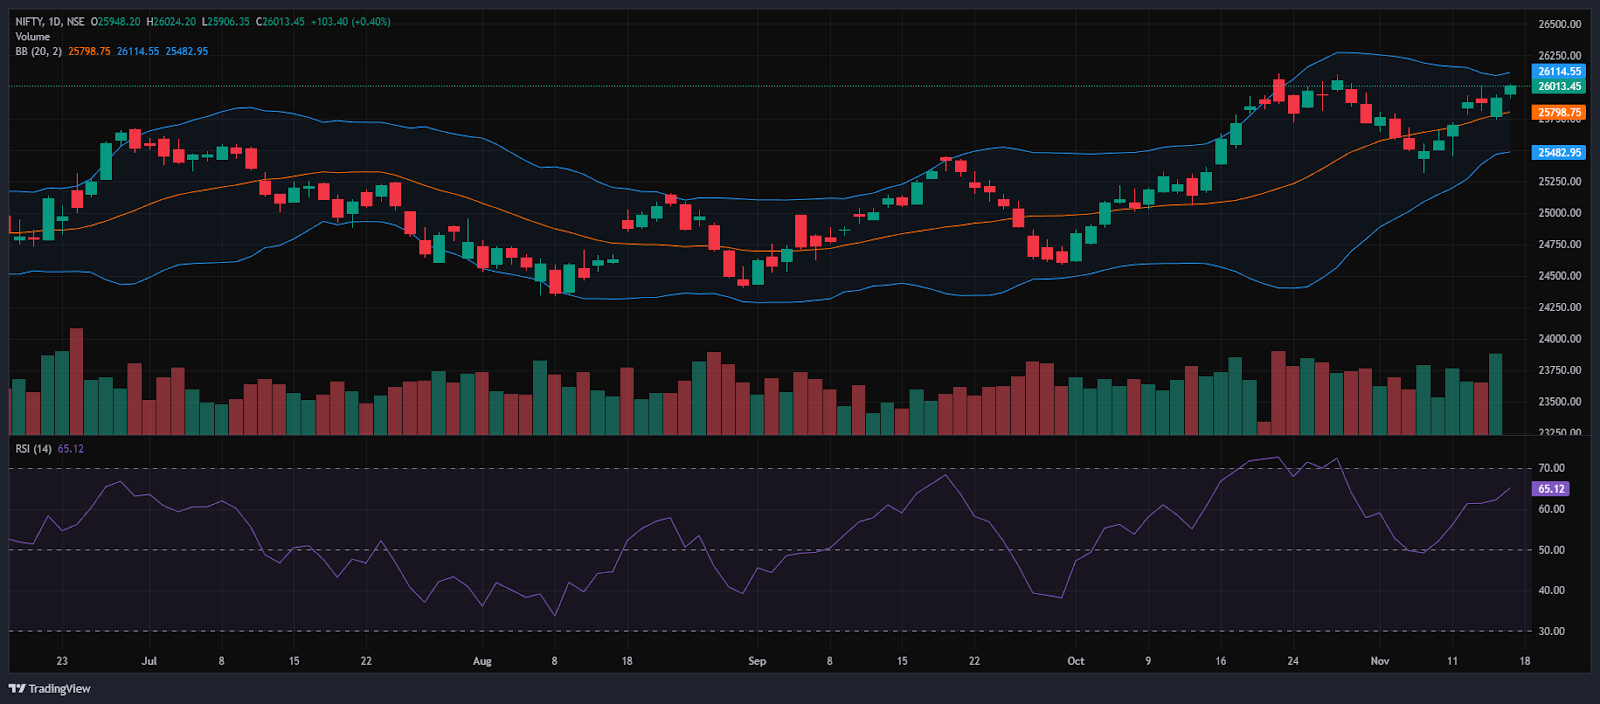
RSI (Daily): The Nifty 50’s RSI stood at 65.12, which is below the overbought zone of 70, indicating bullish sentiment and room to grow higher.
Bollinger Bands (Daily): The index is trading in the upper band of the Bollinger Band range (Simple Moving Average). Its position in the upper range suggests a bullish sentiment, and in Monday’s session, the Index formed a bullish candle with minimal wicks on the upper end and a long wick on the lower end. The close is above the open, confirming upward momentum. The index took support near 25,906, and 26,024 acted as a resistance level. A sustained move above the middle band signals a bullish sentiment, while a drop back toward the lower band may reinforce bearish sentiment.
Volume Analysis: Monday’s trading session had an average volume of 281.77 Mn.
Derivatives Data: Options OI indicates strong Put writing at 26,000, followed by 25,900, establishing a strong support zone. On the upside, a significant Call OI buildup at 26,100 and 26,200 suggests a potential supply of resistance. PCR (Put/Call Ratio) stands at 1.08 (>=1), leaning towards neutral sentiment, and the long Buildup indicates that traders are entering their long positions and it is confirmed when both the price and open interest are increasing, which signals a strong bullish outlook, thus overall indicating a neutral to bullish outlook for the next trading session.
Bank Nifty Chart & Price Action Analysis
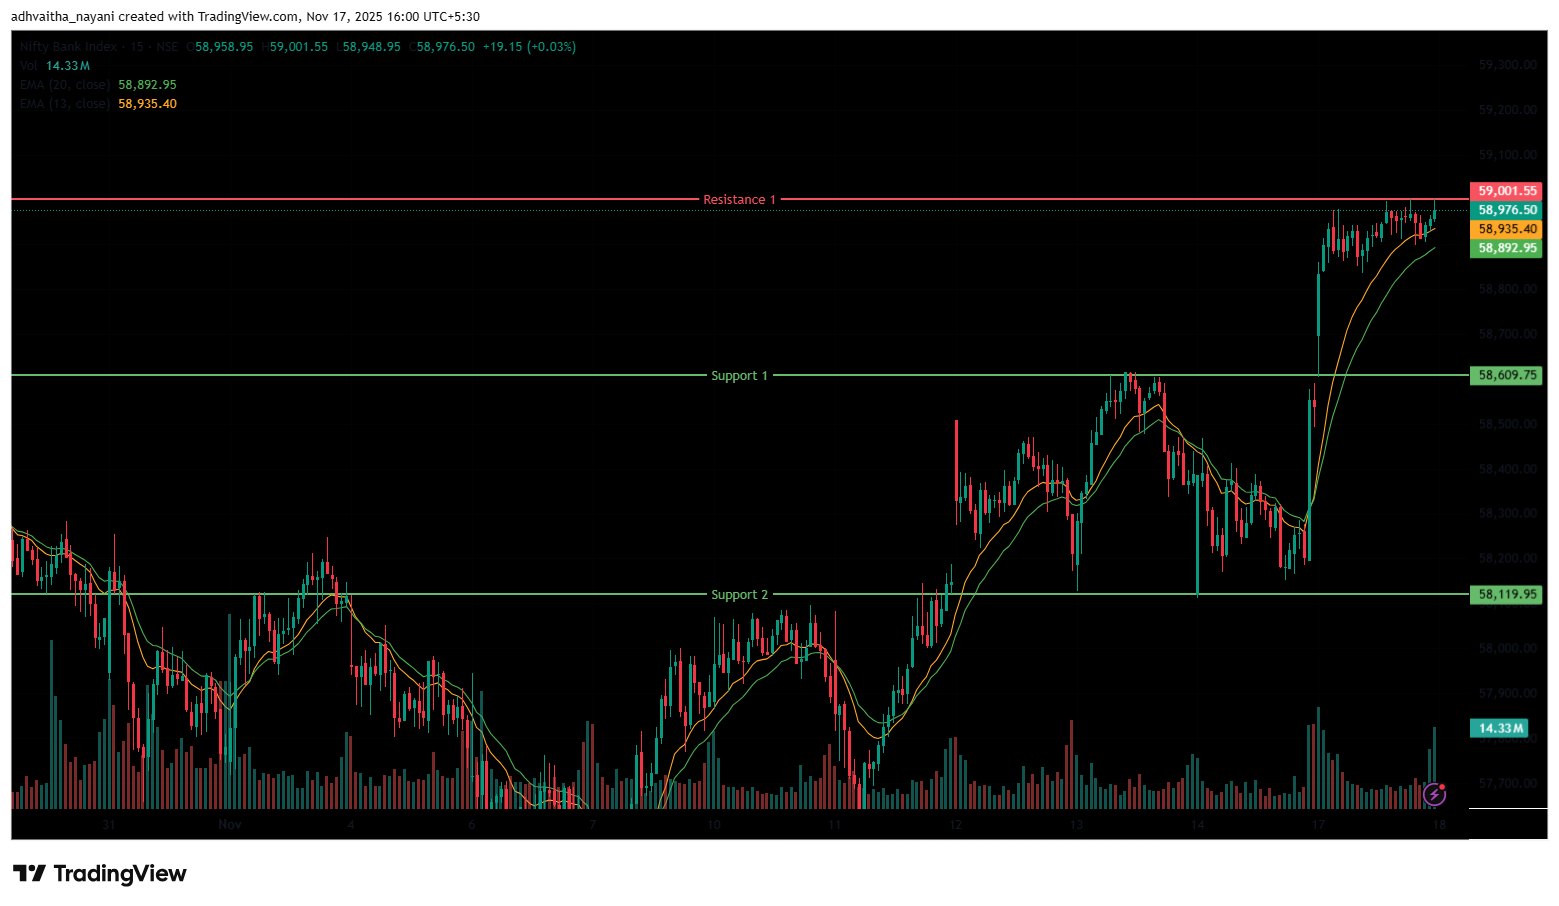
The Bank Nifty Index opened on a positive note at 58,696.30 on Monday, up by 178.75 points from Friday’s closing of 58,517.55. The index opened on an optimistic note but traded in a range-bound manner in the morning session, between the 58,800 and 58,975 levels. In the afternoon session, the index continued to trade near the 59,000 level, marking its day high at 59,001.55 and trading between the range of 58,920 and 59,000.
The Bank Nifty index had peaked at 59,001.55 and made a day’s low at 58,605.30. Finally, it had closed in green at 58,962.70, rising above the 58,950 level, gaining 445.15 points or 0.76%. The Relative Strength Index (RSI) stood at 71.41, entering the overbought zone of 70 in the daily time frame. In the short term, the Index was above the 13/20 day EMA in the daily time frame, indicating an uptrend.
The higher resistance level is at 59,001.55 (R1), which is the 52-week high for the index. On the other hand, the closest support is now at 58,609.75 (S1), which was a previous resistance level but has turned into support. If the index falls below this, the next support level to watch is at 58,119.95 (S2).
Trade Setup:
| Bank Nifty | |
| Resistance 1 | 59,001.55 |
| Closing Price | 58,962.70 |
| Support 1 | 58,609.75 |
| Support 2 | 58,119.95 |
BSE Sensex Chart & Price Action Analysis
To view other technical reports, click here
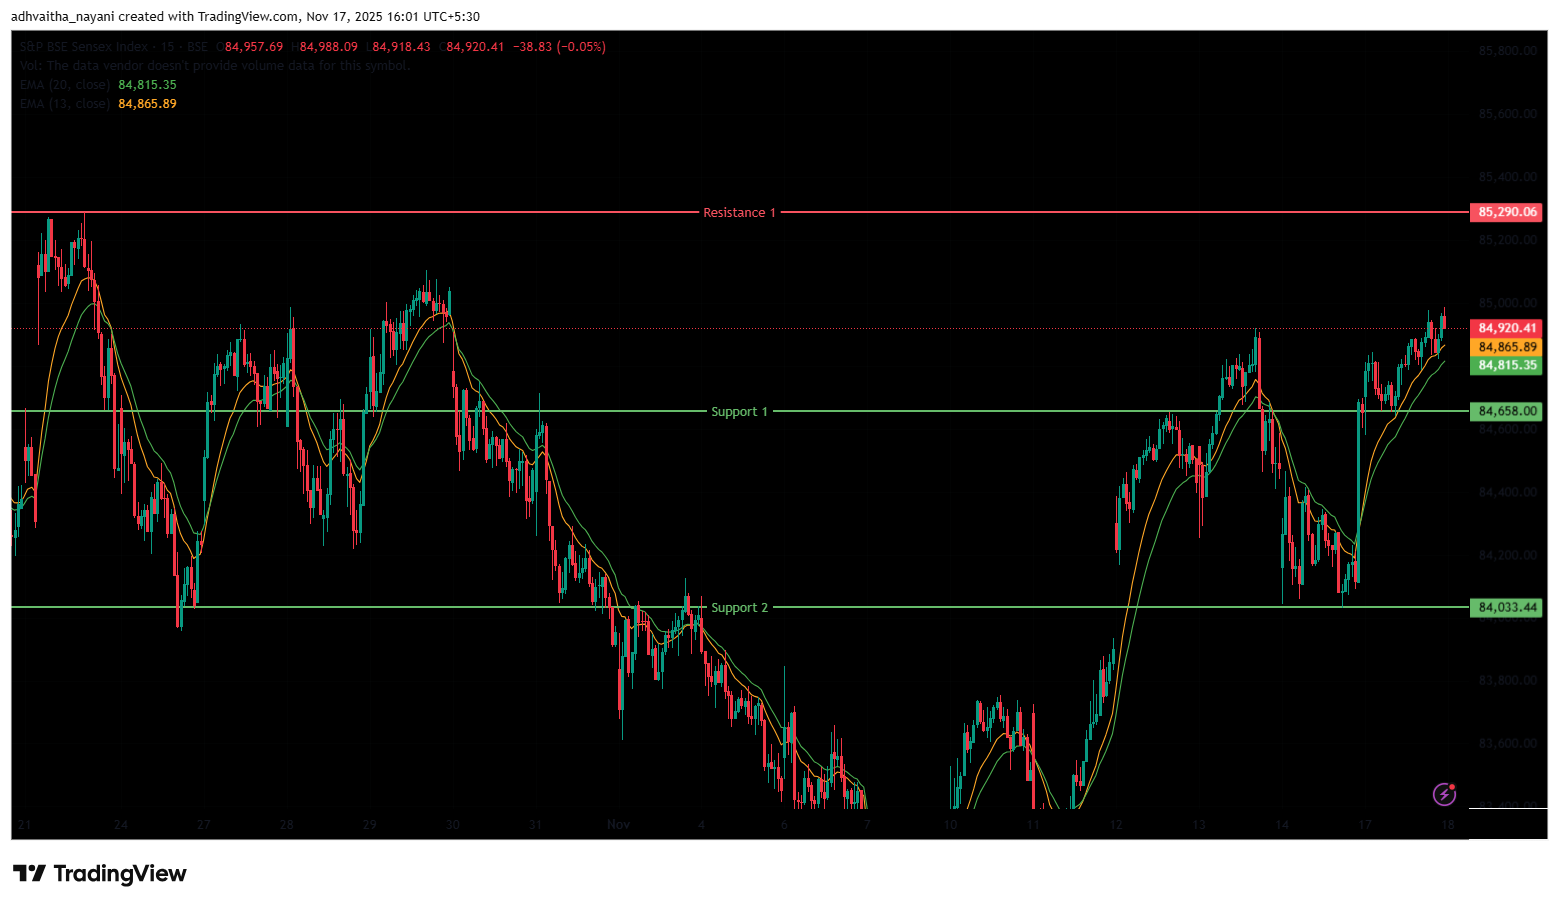
The BSE Sensex Index opened on an optimistic note at 84,700.50 on Monday, up by 137.72 points from Friday’s closing of 84,562.78. The Sensex index opened on a positive note and continued to trade in a similar pattern as the Nifty 50, and was traded between the range of 84,700 and 84,850 during the morning session. In the afternoon session, the index continued to rise and had a day’s high at 84,988.09, near the 85,000 level. The Index was trading between the range of 84,800 and 84,980 in the afternoon session.
The BSE Sensex index had peaked at 84,988.09 and made a day’s low at 84,581.08. Finally, it had closed at 84,950.95 in green, gaining 388.17 points or 0.46%. The Relative Strength Index (RSI) stood at 65.87, below the overbought zone of 70 in the daily time frame. In the short term, the Index was above the 13/20 day EMA in the daily time frame, indicating an uptrend.
The index faces immediate resistance at 85,290.06 (R1), a level it has struggled to sustain above and the 52-week high. On the downside, support lies at 84,658 (S1), a former resistance level which turned into support, and the next stronger support (S2) is at 84,033.44.
Trade Setup:
| Sensex | |
| Resistance 1 | 84,290.06 |
| Closing Price | 84,950.95 |
| Support 1 | 84,658.00 |
| Support 2 | 84,033.44 |
Market Recap on November 17th, 2025
On Monday, the Nifty 50 opened higher at 25,948.20, up slightly by 38.15 points from its previous close of 25,910.05. The index hit an intraday high of 26,024.20 and closed above the 26,000 level at 26,013.45, up 103.40 points, or 0.40%. The index closed above all key moving averages (20/50/100/200-day EMAs) on the daily chart. The BSE Sensex followed the same trajectory, opening on a positive trend at 84,700.50, up 137.72 points from the previous close of 84,562.78. It closed at 84,950.95, up 388.17 points, or 0.46%. Both indices showed high momentum, with RSI values for Nifty 50 at 65.12 and Sensex at 65.87, below the overbought threshold of 70.
On Monday, all indices show a bullish reaction, with no major indices in negative territory. The Nifty PSU Bank index was the major gainer, rising 1.09% or 91.75 points, and standing at 8,491.65. Stocks such as Indian Overseas Bank rose 3.76%, followed by Bank of Maharashtra and Indian Bank, which gained up to 3.28% on Monday.
The Nifty Auto index was also among the biggest gainers, rising 0.85% or 232.85 points, and standing at 27,472. Stocks such as Hero MotoCorp Ltd jumped 4.69% on Monday. While other auto stocks like TVS Motor Company Ltd, Tata Motors Ltd, and Eicher Motors Ltd also gained up to 2.63%. The Nifty Midcap 50 index was also among the top gainers, rising 0.84% or 144.80 points, and standing at 17,444.
Asian markets had a mild negative sentiment on Monday. Japan’s Nikkei 225 declined by -116.53 points or -0.23%, closing at 50,260.00. China’s Shanghai Composite decreased by -18.46 points, or -0.46%, to 3,972.03, while Hong Kong’s Hang Seng Index plummeted by -210.46 points, or -0.80%, to close at 26,362.00. On the other hand, South Korea’s KOSPI continues to rise by 77.68 points or 1.90%, closing at 4,089.25.
India VIX
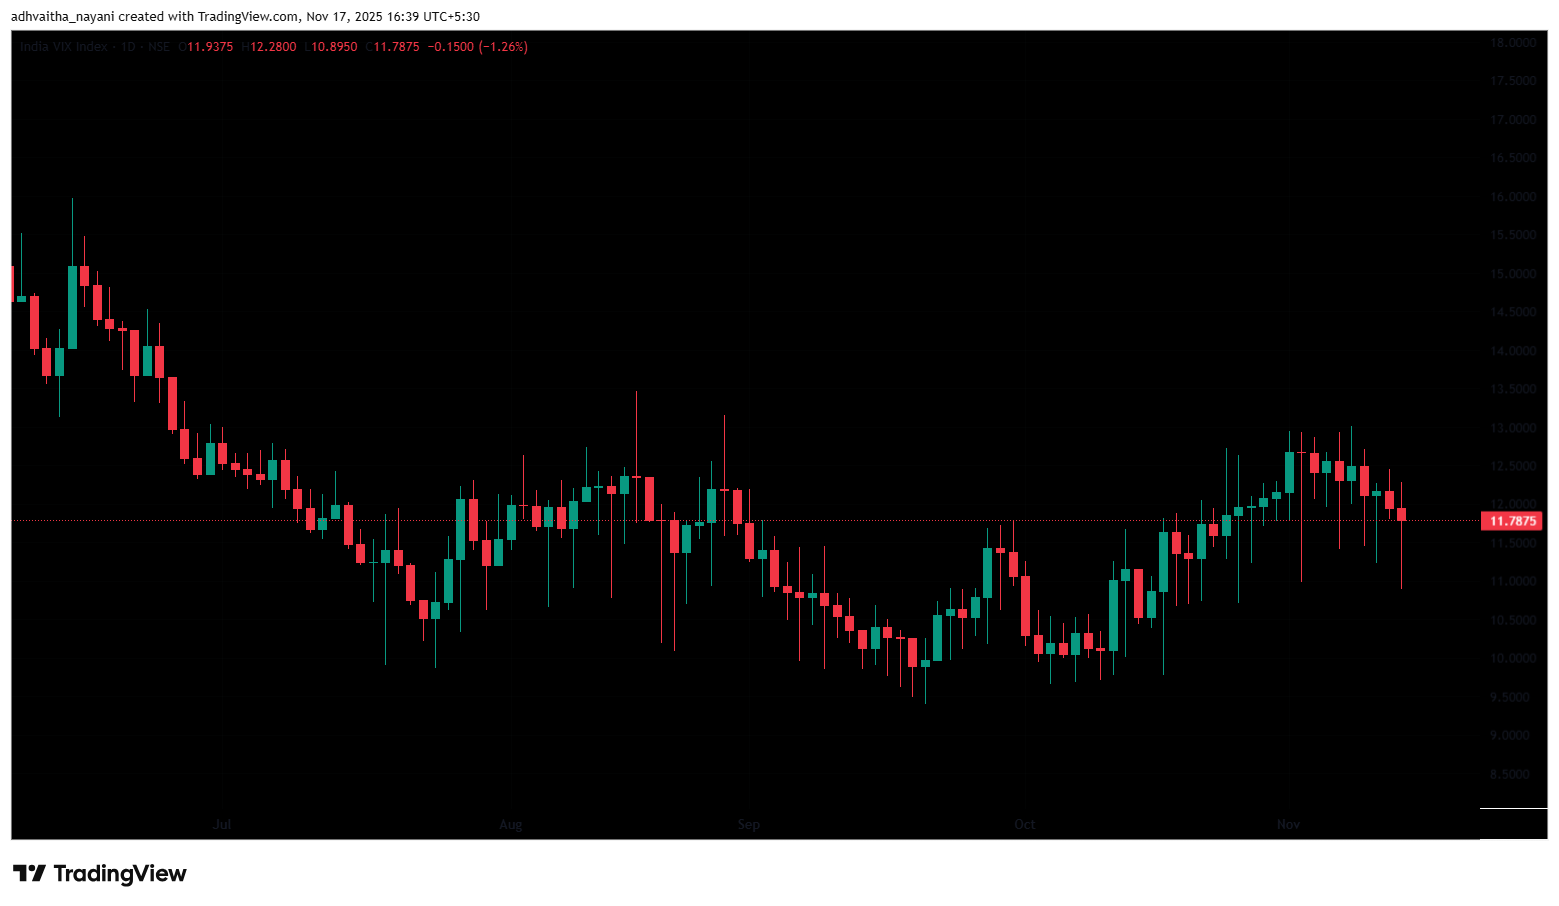
The India VIX decreased 0.15 points or 1.26%, from 11.94 to 11.79 during Monday’s session. A decrease in the India VIX typically indicates lower price volatility in the stock market, suggesting a more stable market environment. However, a stable market environment and minimal volatility are anticipated when the India VIX is below 15.
Given the ongoing volatility and mixed sentiments, it’s advisable to avoid aggressive positions and wait for clear directional moves above resistance or below support. Traders should consider these key support and resistance levels when entering long or short positions following the price break from these critical levels. Additionally, traders can combine moving averages to identify more accurate entry and exit points.
Disclaimer

The views and investment tips expressed by investment experts/broking houses/rating agencies on tradebrains.in are their own, and not that of the website or its management. Investing in equities poses a risk of financial losses. Investors must therefore exercise due caution while investing or trading in stocks. Trade Brains Technologies Private Limited or the author are not liable for any losses caused as a result of the decision based on this article. Please consult your investment advisor before investing.
About: Trade Brains Portal is a stock analysis platform. Its trade name is Dailyraven Technologies Private Limited, and its SEBI-registered research analyst registration number is INH000015729.
Investments in securities are subject to market risks. Read all the related documents carefully before investing.
Registration granted by SEBI and certification from NISM in no way guarantee performance of the intermediary or provide any assurance of returns to investors.
