
Synopsis: Silver crashed 37% in one day from $121/oz high on Jan 30, 2026, after CME margin hikes and Fed chair news triggered leverage liquidation cascade. Now ~$77/oz amid ongoing deficit; analysts see buy opportunity
Silver was on top of the world. Then, almost overnight, it fell off a cliff. In just days, the metal that had been climbing for over a year lost nearly half its value. Traders were stunned. Retail investors panicked. And the mainstream media quickly pointed fingers at the new Fed chair. But that story barely scratches the surface.

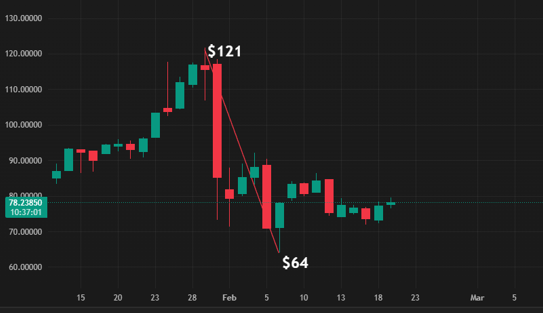
Source: Tradingview
Silver hit an all-time high of $121.785 per ounce on January 29, 2026. It then crashed below $64 by February 6. That single-day drop of up to 35% on January 30 was the steepest in 44 years. Prices eventually steadied around $76–$78 by mid-February. The XAGUSD chart told a brutal story a 278% surge in 12 months, then a collapse that wiped out billions in market value in hours.
Furthermore, fundamentals had not changed. No mines shut down. No solar panel factories stopped buying silver. Industrial demand remained strong. So what actually broke? The answer lies deep inside the market’s structure.

The Bull Run That Built a Powder Keg
Silver’s rise in 2025 was not random. It had real drivers behind it. Industrial demand accounts for roughly 60% of total silver consumption. Solar panels, electric vehicles, AI data centers, and circuit boards all require silver. The world’s shift toward green energy and technology pushed that demand higher every month.
At the same time, supply stayed tight. About 70% of silver comes as a byproduct of mining other metals. That means producers cannot simply ramp up output when prices rise. The market recorded its fifth straight year of supply deficit in 2025. Prices averaged $40.10 per ounce that year more than double prior levels.

However, something else entered the mix. Speculative money flooded in. Hedge funds, retail traders, ETF buyers, and leveraged futures traders all piled on. Geopolitical tensions added fuel. Tariff fears under U.S. policy added more. The gold-to-silver ratio compressed below 50:1, a sign that silver was outpacing even gold. By late January 2026, prices topped $120. The XAGUSD chart looked like a rocket and that was the problem.
Leverage Was the Real Bomb The Fed Story Was Just the Match
On January 30, U.S. President Trump nominated Kevin Warsh as the next Fed chair. Warsh carries a hawkish reputation. Markets read that as fewer rate cuts ahead. The U.S. dollar jumped. Precious metals positions started bleeding. Media outlets ran with this as the explanation for the crash.
But the macro headline was only the trigger. The bomb had already been loaded. That bomb was leverage. The CME Group raised silver futures margin requirements six times in the weeks before the crash. Margins climbed from 9% to as high as 18%, with fixed amounts reaching $32,500 per contract. These hikes forced traders who were fully leveraged into an impossible choice add more cash immediately or sell right now.

Most could not add more. So they sold. That selling pushed prices lower. Lower prices triggered new margin calls. Those calls forced more selling. That selling triggered even more calls. This cycle known as a liquidation cascade turned a correction into a catastrophe. Additionally, the London Metal Exchange went offline that day. HSBC’s systems also went down. Asian markets were already closed. Holiday-reduced liquidity across major markets turned a bad situation into a full collapse.
Paper Market vs. Physical Reality: A Critical Divide
Silver trades in two very different markets, and most people only watch one of them. The paper market futures contracts on exchanges like COMEX, ETFs, and options runs entirely on leverage. A trader in India might control 1 kg of silver exposure while putting up only a fraction of its actual cost as margin. This structure creates enormous profits when prices rise. However, when prices turn, it creates equally enormous forced selling.
The physical market works differently. It deals in real silver bars, coins, industrial supply. Physical silver premiums across Asia were at record highs even as the paper price crashed. The crash did not create new silver supply. It did not destroy industrial demand from EV manufacturers or solar companies. As the XAGUSD chart showed a historic plunge, physical buyers in many markets were actually increasing their purchases.
This pattern is not new. In 1980, margin rule changes caused silver to crash 80%. In 2011, the CME raised margins five times and silver fell nearly 50%. In December 2025, thin holiday trading combined with margin hikes produced another sharp drop. Therefore, the playbook is the same each time. Only the headline excuse changes.
Is This a Buying Opportunity? What Experts Are Saying
Post-crash, analysts at JP Morgan expect silver to average $81 per ounce in 2026. The market remains in deficit for a sixth consecutive year. Supply is expected to grow only 1.5% to 1.05 billion ounces. Demand stays at approximately 1.1 billion ounces supported by AI infrastructure, automotive growth, and physical investment, which rose 20% to 227 million ounces.
As a result, many analysts view the crash as a healthy flush of leverage rather than a fundamental breakdown. Entry points have opened for long-term buyers who believe the structural bull case remains intact. Geopolitical risks, central bank diversification trends, and continued industrial demand all support that case.
That said, risks remain. A renewed hawkish shift from the Fed or new tariff surprises could push prices lower again. Silver’s sensitivity to interest rates and dollar strength limits near-term recovery speed. There is also concern that high silver prices now exceeding 30% of solar panel production costs may accelerate substitution toward copper or cadmium telluride in solar applications, which could erode future demand.
For traders using leveraged futures, the warning is clear. Margin calls do not care about your thesis. Retail traders cannot match the balance sheets of major institutions. In contrast, ETF holders face no daily margin pressure and can ride out volatility. They can add positions at lower levels and let time work in their favor.
The big picture has not changed. Silver’s 40% crash exposed the paper market’s vulnerability to engineered liquidations. However, it did not break the metal’s fundamental value. Deficits continue. Industrial demand grows. Physical markets remain tight. For patient, unleveraged investors, the XAGUSD chart’s brutal correction may ultimately be remembered as one of the better entry points of this decade.
Disclaimer: The views and investment tips expressed by investment experts/broking houses/rating agencies on tradebrains.in are their own, and not that of the website or its management. Investing in equities poses a risk of financial losses. Investors must therefore exercise due caution while investing or trading in stocks. Trade Brains Technologies Private Limited or the author are not liable for any losses caused as a result of the decision based on this article. Please consult your investment advisor before investing.