Synopsis: 3M India Ltd. formed a bullish engulfing pattern on the 1-hour chart, signalling a possible near-term bullish reversal.
The bullish engulfing pattern signals momentum reversal, as buyers overpower sellers after weakness, supporting bullish potential. The bullish candle engulfing the prior bearish one shows a shift in sentiment as buyers regain control.

On Thursday, 3M India Ltd formed a bullish engulfing pattern on the 1-hour chart after a brief corrective phase. The strong green candle was supported by high buying volumes. A sustained move above 29,335 could trigger further upside, while a drop below 29,335 would weaken the bullish outlook.
In a bullish engulfing pattern, targets are usually set near the closest resistance after the reversal. Traders may trail profits as price rises, booking partial or full gains around key resistance levels while monitoring follow-through strength and volume for confirmation or early exhaustion signs.

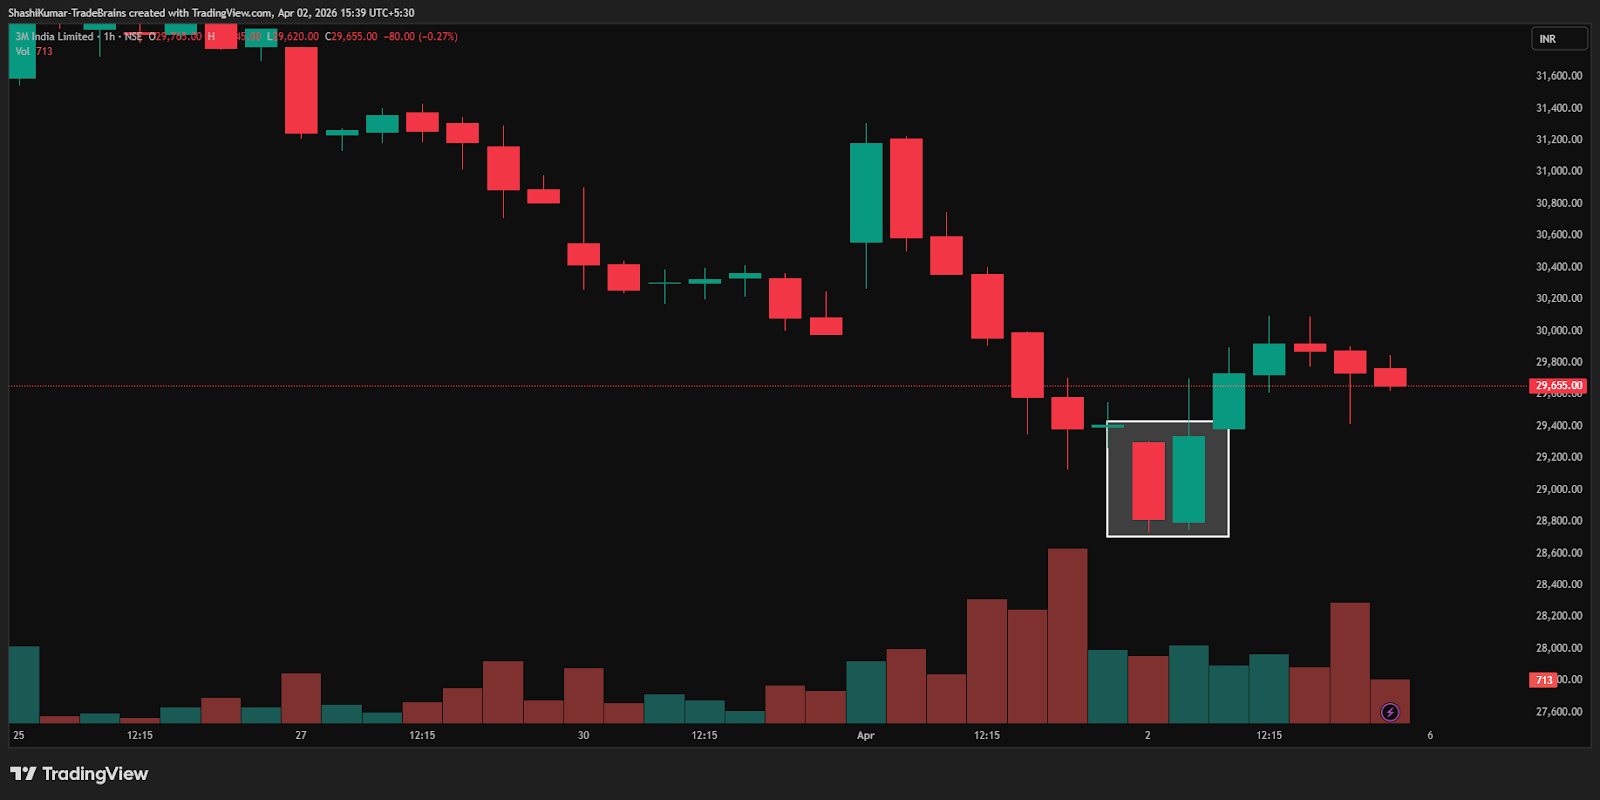
3M India Ltd Chart: 1-hour Timeframe
Implications
The formation of a bullish engulfing pattern points to potential upside for 3M India Ltd . A sustained move above the key 29,335 level, preferably on strong buying volumes would confirm the reversal and reduce the risk of a false signal. Holding above this level would reinforce near-term bullish momentum.
About the stock
Incorporated in 1987, 3M India Limited is a science-based company headquartered in Bengaluru. The company operates three manufacturing facilities, one R&D centre, and two customer technical centres. With a workforce of approximately 1,255 employees, it serves customers across four primary business groups: Safety & Industrial, Transportation & Electronics, Healthcare, and Consumer. The company focuses on local innovation, having filed 173 patents in 2025.

Over the past month, the 3M India Ltd share price has fallen 16.87%, indicating sustained weakness. Over the last six months, the stock marginally edged up 1.78%, while it remains up 3.43% compared to the same period last year.
For more such technical stock ideas, click here to view our research page.
Disclaimer: The views and investment tips expressed by investment experts/broking houses/rating agencies on tradebrains.in are their own, and not that of the website or its management. Investing in equities poses a risk of financial losses. Investors must therefore exercise due caution while investing or trading in stocks. Trade Brains Technologies Private Limited or the author are not liable for any losses caused as a result of the decision based on this article. Please consult your investment advisor before investing.