
Synopsis: Siemens Energy India Ltd’s 1-hour chart shows a descending triangle, hinting at an impending short-term bullish breakout.
A breakout above the resistance trendline of a descending triangle signals strengthening buying momentum and a potential upward move. The chart confirms a bullish breakout above the resistance neckline. Backed by a volume surge, this pattern points to a potential short-term upward move.

On Friday, Siemens Energy India Ltd broke past key resistance at Rs 3,550, successfully turning it into a strong support zone. Closing at Rs 3,606.9 on the daily chart, the stock signals sustained bullish momentum.
Traders usually look for a breakout above the resistance trendline in a descending triangle, setting a price target based on the pattern’s height from the breakout point. Strong volume and momentum serve to confirm this bullish move.

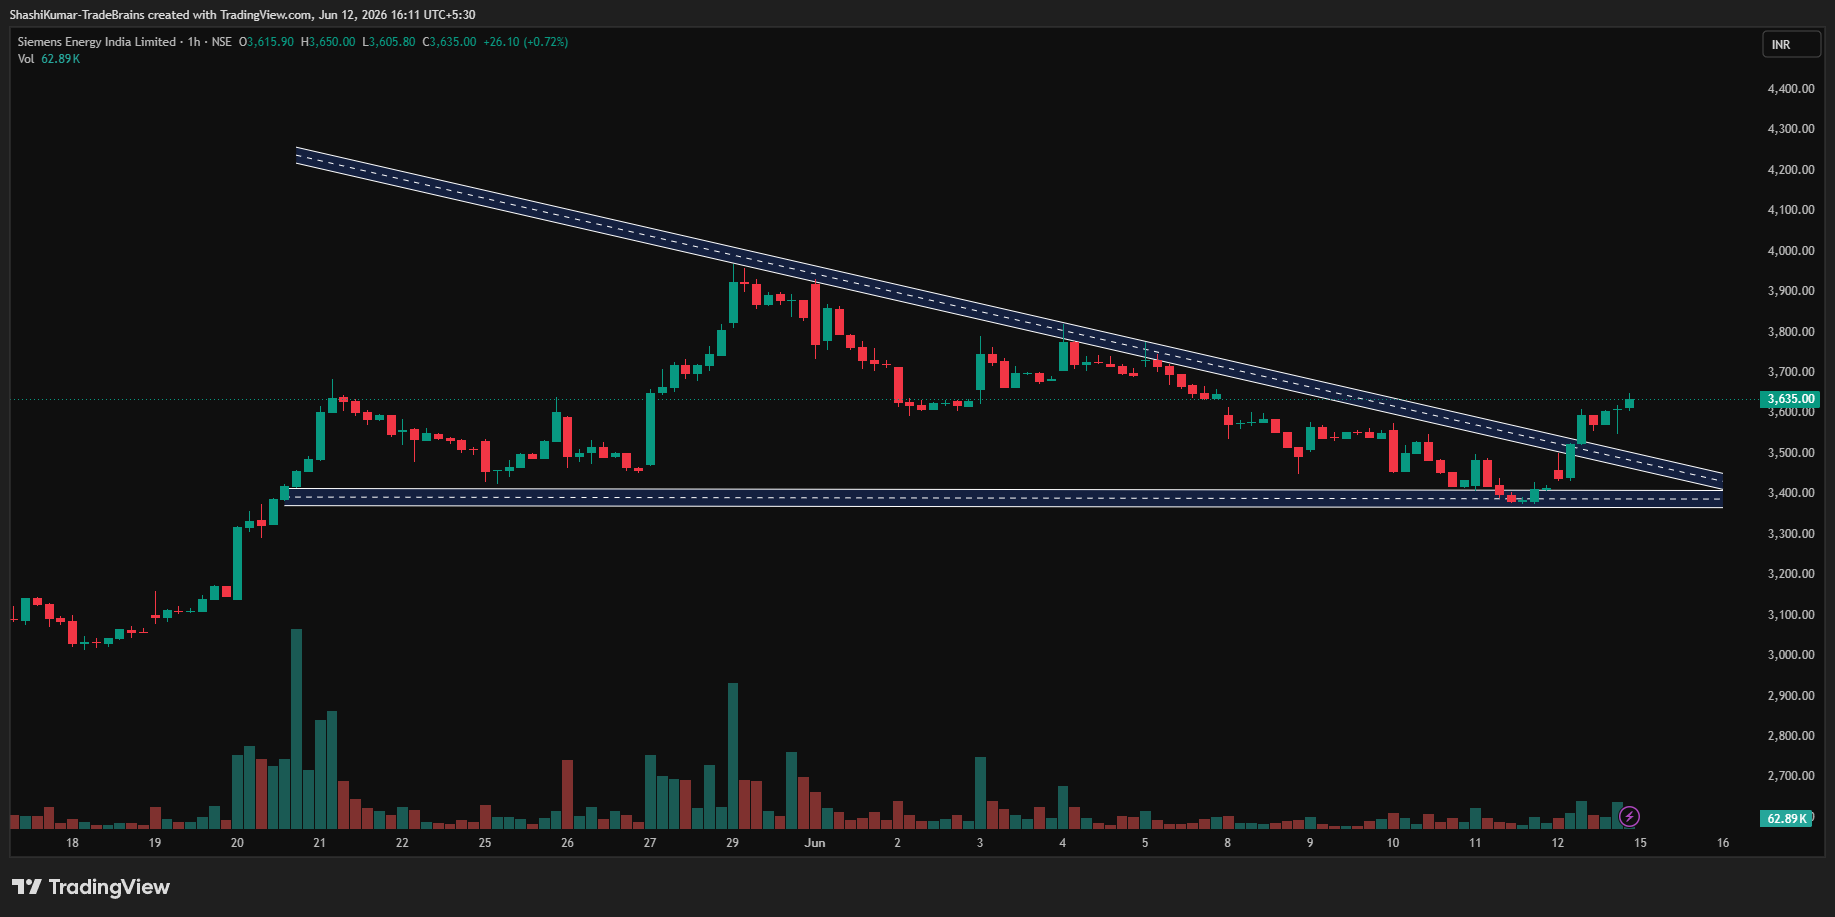
Siemens Energy India Ltd Chart: 1-hour Timeframe
Indicator Confirmation
- RSI: The daily RSI indicates buying pressure, as it rose from 49.24 in the previous trading session to 57.03 on Tuesday.
- Price Volume Trend: The Price Volume Indicator confirms the uptrend, accompanied by an increase in buying volume in the daily time frame.
Implications
A breakout from the descending triangle pattern indicates growing upward momentum. If the price holds above the Rs 3,550 support floor on robust trading volume, it will likely reinforce the stock’s short-term bullish trajectory.
About the stock
Siemens Energy India Limited is a pureplay energy company that serves customers across the entire energy value chain, including power generation and transmission. The company boasts a significant infrastructure footprint across India with eight factories, four engineering/R&D centres, six sales offices and four service offices. Its technology plays a vital role in national infrastructure, supporting roughly 55% of India’s large steam turbines, 25% of its gas turbines, and 30% of its HVDC transmission capacity. In the last month, Siemens Energy India Ltd climbed 18.73%. The equity has jumped 25.38% during the prior six months and has risen 32.65% year-over-year. For more such technical stock ideas, clickhereto view our research page.

Disclaimer: The views and investment tips expressed by investment experts/broking houses/rating agencies on tradebrains.in are their own, and not that of the website or its management. Investing in equities poses a risk of financial losses. Investors must therefore exercise due caution while investing or trading in stocks. Trade Brains Technologies Private Limited or the author are not liable for any losses caused as a result of the decision based on this article. Please consult your investment advisor before investing.