
Synopsis: Gallantt Ispat Ltd has broken out of a descending channel on the 4-hour chart, signalling a short-term bullish trend.
The descending channel pattern reflects a short-term downtrend, with prices moving between parallel downward-sloping support and resistance levels. A decisive breakout above the upper boundary signals a bullish reversal. Gallantt Ispat Ltd, after a phase of controlled decline in recent sessions, has formed a descending channel breakout.

On Wednesday, Gallantt Ispat Ltd sustained itself above the key Rs 675 resistance level after breaking the neckline on June 16th. Closing at Rs 713.2, the stock’s volume-backed breakout indicates emerging near-term bullish momentum.
For an upside breakout from a descending channel, targets are usually set at nearby resistance levels. Traders may book profits here while watching for further strength or reversal signals.

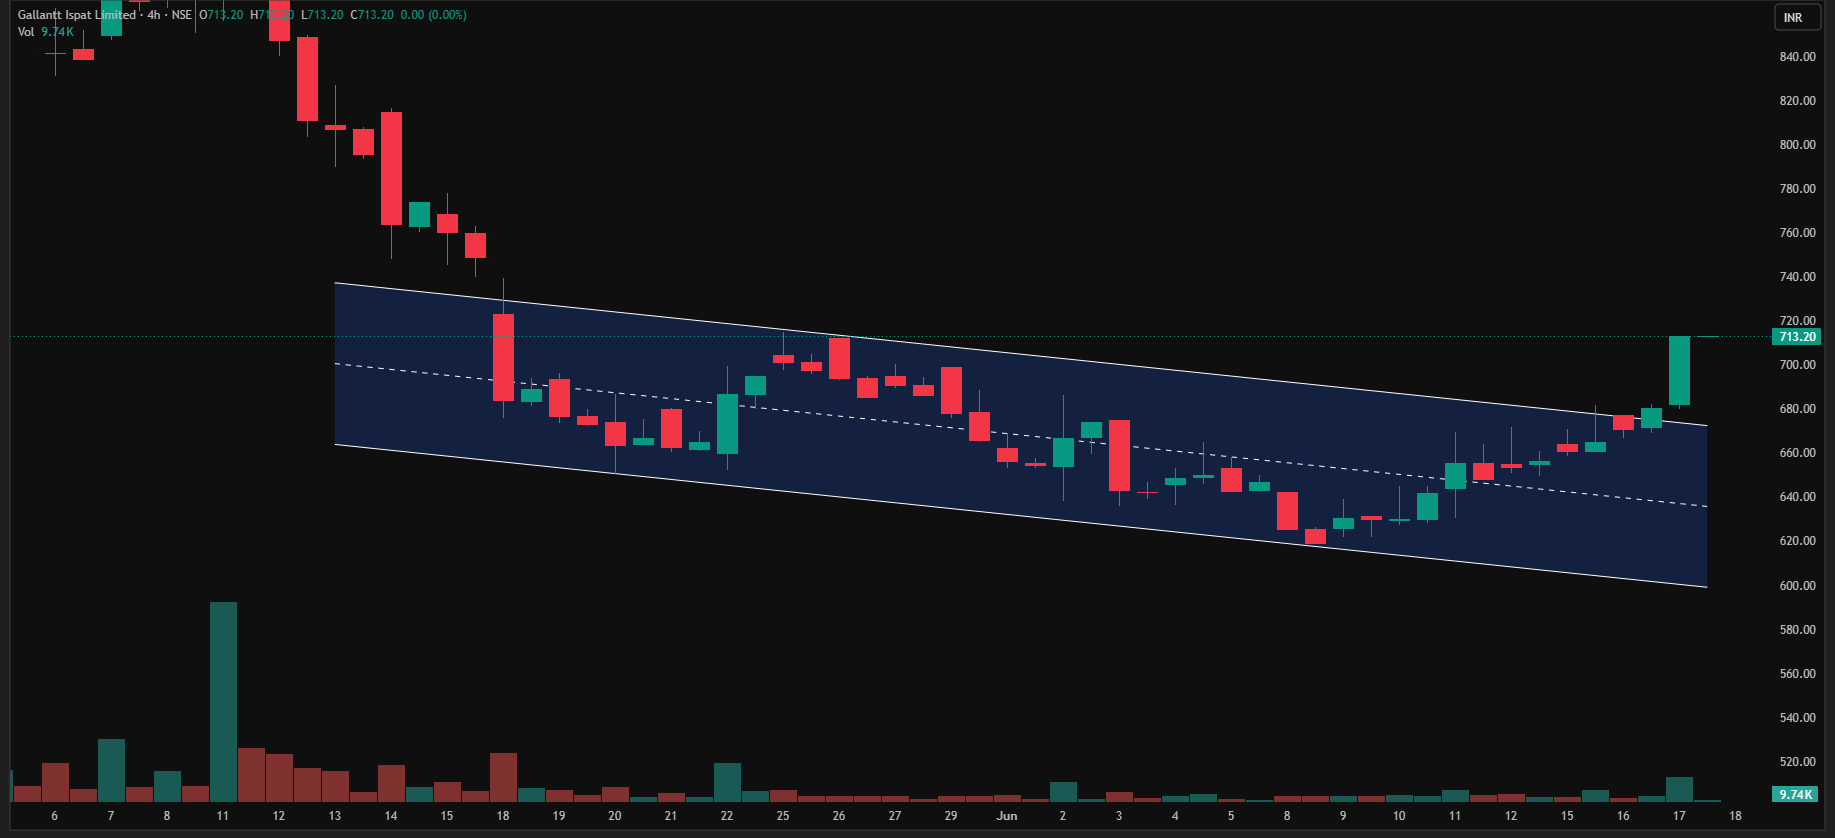
Gallantt Ispat Ltd Chart: 4-hour Timeframe
Indicator Confirmation
- RSI: The daily RSI indicates bullish momentum, as it rose from 47.99 in the previous trading session to 55.67 on Wednesday.
- MACD: On the daily time frame, the blue MACD line was above the orange signal line, with the histogram turning green, indicating bullish momentum.
- Moving Averages: On the daily time frame, the 5-day moving average was above the 9-day moving average, further confirming a bullish trend.
- Price Volume Trend: The Price Volume Indicator confirms the uptrend, accompanied by a sharp increase in buying volume in the daily time frame.
Implications
A breakout from the descending channel suggests upside potential. A sustained close above Rs 675 with strong volume would confirm it and lower false-breakout risk. This level now acts as immediate support, and holding above it keeps the short-term trend bullish.
About the stock
Gallantt Ispat Limited is Uttar Pradesh’s largest rebar producer, holding a 25% market share in its addressable geographies. The company operates an integrated steel manufacturing business across two units: Gorakhpur (UP) at 6 lakh MTPA and Kutch (Gujarat) at 4 lakh MTPA, totalling 1.0 MTPA of finished steel capacity backed by 129 MW of captive power. It is backward integrated with a 792 KTPA pellet manufacturing capacity and has secured iron ore mine blocks in Uttar Pradesh and Rajasthan.

Over the past month, Gallantt Ispat Ltd shares gained 3.45%. The stock has surged 37.98% over the past six months and delivered a strong 60.09% gain over the past year. For more such technical stock ideas, click hereto view our research page.
Disclaimer: The views and investment tips expressed by investment experts/broking houses/rating agencies on tradebrains.in are their own, and not that of the website or its management. Investing in equities poses a risk of financial losses. Investors must therefore exercise due caution while investing or trading in stocks. Trade Brains Technologies Private Limited or the author are not liable for any losses caused as a result of the decision based on this article. Please consult your investment advisor before investing.