
Synopsis: Mahanagar Gas Ltd has developed a symmetrical triangle on the daily chart, signalling a potential near-term bullish breakout.
A symmetrical triangle forms when price consolidates within converging highs and lows. A breakout above the upper trendline, preferably on increased volume, indicates a potential bullish move. The chart shows that the symmetrical triangle has broken above the neckline, with price now trading higher.

On 16th June 2026, Mahanagar Gas Ltd moved above the symmetrical triangle’s neckline and has sustained it to date. On 22nd June, the stock further surged 3%, continuing the bullish bias, and ended at the Rs 1,245 level. A decisive move above the Rs 1,160 level could drive further gains, while a drop below this level may signal a weakening outlook.
For a symmetrical triangle, targets are set either at immediate resistance levels or by projecting the triangle’s height from the breakout point. Traders monitor volume and momentum for confirmation and often trail profits as the price moves in the breakout direction.

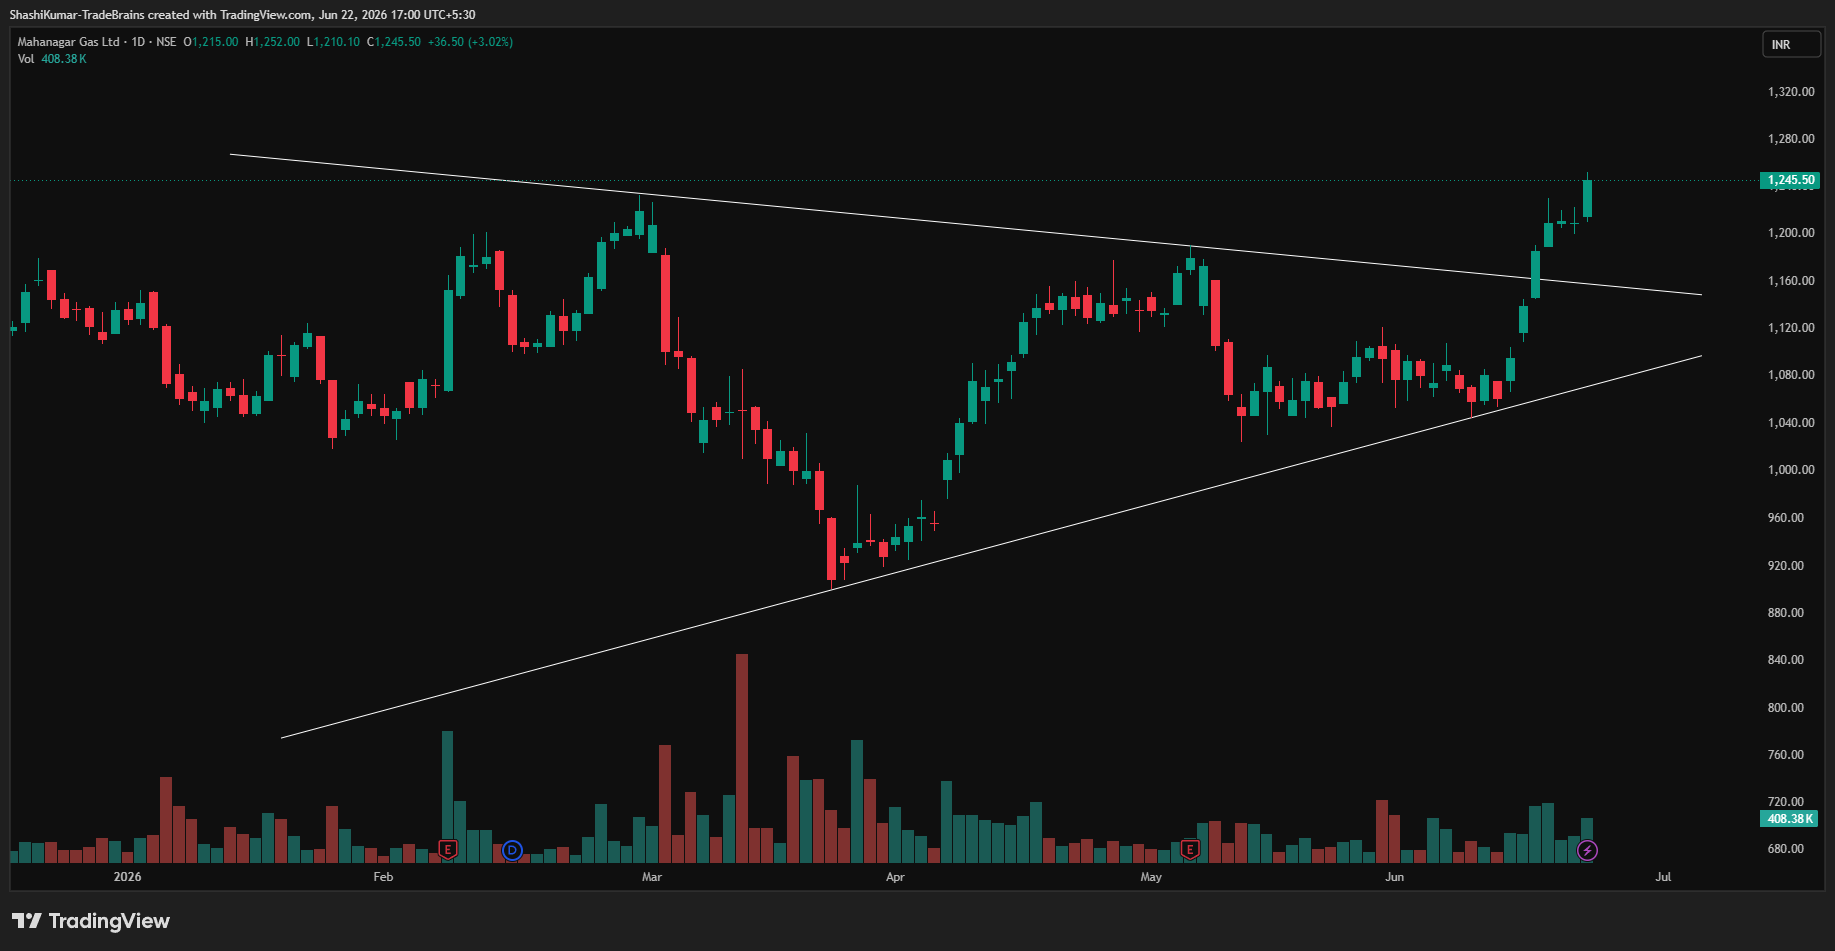
Mahanagar Gas Ltd Chart: Daily Timeframe
Indicator Confirmation
- RSI: The daily RSI shows bullish momentum, as it rose from 69.11 in the last trading session to 73.16 on Monday and stays in the overbought zone.
- Moving Averages: On the daily time frame, the 5-day moving average was above the 9-day moving average, further confirming a bullish trend.
- MACD: On the daily time frame, the blue MACD line was above the orange signal line, with the histogram turning green, indicating bullish momentum.
Implications
The symmetrical triangle breakout signals potential upside, with holding above Rs 1,162 on strong volume likely to reinforce near-term bullish momentum.
About the stock
Incorporated on May 8, 1995, Mahanagar Gas Limited (MGL) is one of India’s leading natural gas distribution companies. Promoted by GAIL (India) Limited, a Maharatna Government of India enterprise, MGL specialises in the distribution of both compressed natural gas (CNG) and piped natural gas (PNG).

Over the past month, Mahanagar Gas Ltd has gained 18.37%, with a six-month gain of 7.57%. But the stock remains down 10.78% compared to its level a year ago. For more such technical stock ideas, clickhereto view our research page.
Disclaimer: The views and investment tips expressed by investment experts/broking houses/rating agencies on tradebrains.in are their own, and not that of the website or its management. Investing in equities poses a risk of financial losses. Investors must therefore exercise due caution while investing or trading in stocks. Trade Brains Technologies Private Limited or the author are not liable for any losses caused as a result of the decision based on this article. Please consult your investment advisor before investing.