
A bullish hammer is a candlestick pattern used in technical analysis that signals a potential reversal from a downtrend to an uptrend. It typically forms at the bottom of a downtrend and is recognized by its distinct shape

The Distinct shape for the Candle is a small body near the top of the price range and a long lower shadow, which should be at least twice the length of the body.
This pattern shows that although sellers managed to push prices lower during the trading session, buyers regained control and drove the price back up near the opening price.

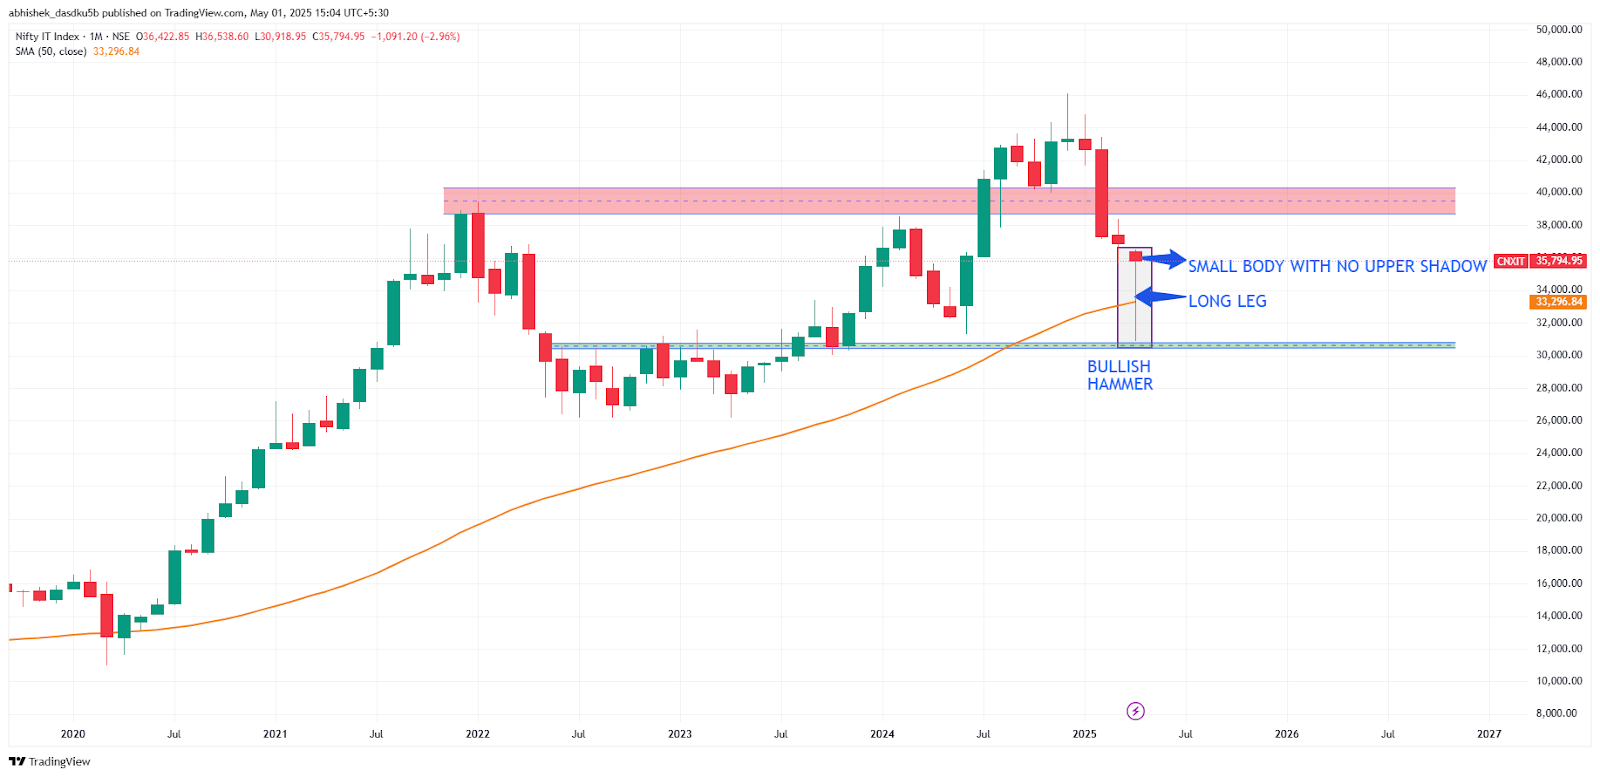
This is the Monthly chart of the NIFTY IT Index. After significant volatility and the initial fall in the month of April, the Index had fallen to a major support of 30,500 to 30,800 and made a low of 30919, The major support level will also act as support if the Index falls again. On the Upside major resistance level is from 38,700 to 40,300 levels
About NIFTY IT Index
The Nifty IT index is a sectoral index in the Indian stock market that tracks the performance of the information technology (IT) sector. The Index includes companies that are primarily engaged in the business of software development, IT Consulting, IT services, and technology solutions

The Index consists of 10 companies, which are Infosys, Tata Consultancy Services, HCL Tech, Tech Mahindra, Wipro, Persistent Systems, Coforge, LTIMindtree, Mphasis, and Oracle Financial Services Software.
Written By Abhishek Das
Disclaimer

The views and investment tips expressed by investment experts/broking houses/rating agencies on tradebrains.in are their own, and not that of the website or its management. Investing in equities poses a risk of financial losses. Investors must therefore exercise due caution while investing or trading in stocks. Dailyraven Technologies or the author are not liable for any losses caused as a result of the decision based on this article. Please consult your investment advisor before investing.

