![]()
![]()
Amidst global uncertainty, the Nifty and Sensex had experienced a decline on Wednesday. The Sensex began trading at 81,314.62 vs. its previous close of 81,583.30, while the Nifty opened at 24,788.35 vs. its previous close of 24,853.40, both of which were lower than their prior closes. The day has seen a continuation of the negative trend, with the Sensex down -0.19 percent and the Nifty down -0.22 percent.
The NIFTY BANK index saw a brief uptick, and it closed on a positive note at 55,828.75. The index has changed by +0.21 percent, or +114.60 points, showing positive movement due to increases in volumes. The shares of AU Small Finance Bank and IndusInd Bank continue to rise, reflecting this optimistic mood.

Both the Nifty Smallcap and Nifty Midcap indexes have had difficulties. The IT stocks, which were the major gainer of the Tuesday’s session, fell today. Stocks in the auto and real estate sectors both saw some increases. Furthermore, shares of BSE Ltd., which had dropped more than 5% in the beginning, somewhat rebounded and were now trading at a deficit of more than 1.19%. The GIFT Nifty is trading down, indicating another negative start; therefore, it did not show any signs of improvement. The Nifty gave back some of its gains on Tuesday after a robust start to the week on Monday, but it was still able to defend key levels on the downside.
Asian markets ended the day with mixed results, and the US markets also closed the day down due to global uncertainties. The US Federal Reserve’s two-day meeting, whose results will be announced on June 18, 2025, is another event that investors are watching very carefully.
In this overview, we will analyze the key technical levels and trend directions for Nifty, Bank Nifty, and BSE Sensex to monitor in the upcoming trading sessions. All the charts mentioned below are based on the 5-minute timeframe.
NIFTY 50 Chart & Price Action Analysis
(In this analysis, we have used 20/50/100/200 EMAs, where 20 EMA (Red), 50 EMA (Orange), 100 EMA (Light Blue), 200 EMA (Dark Blue)).
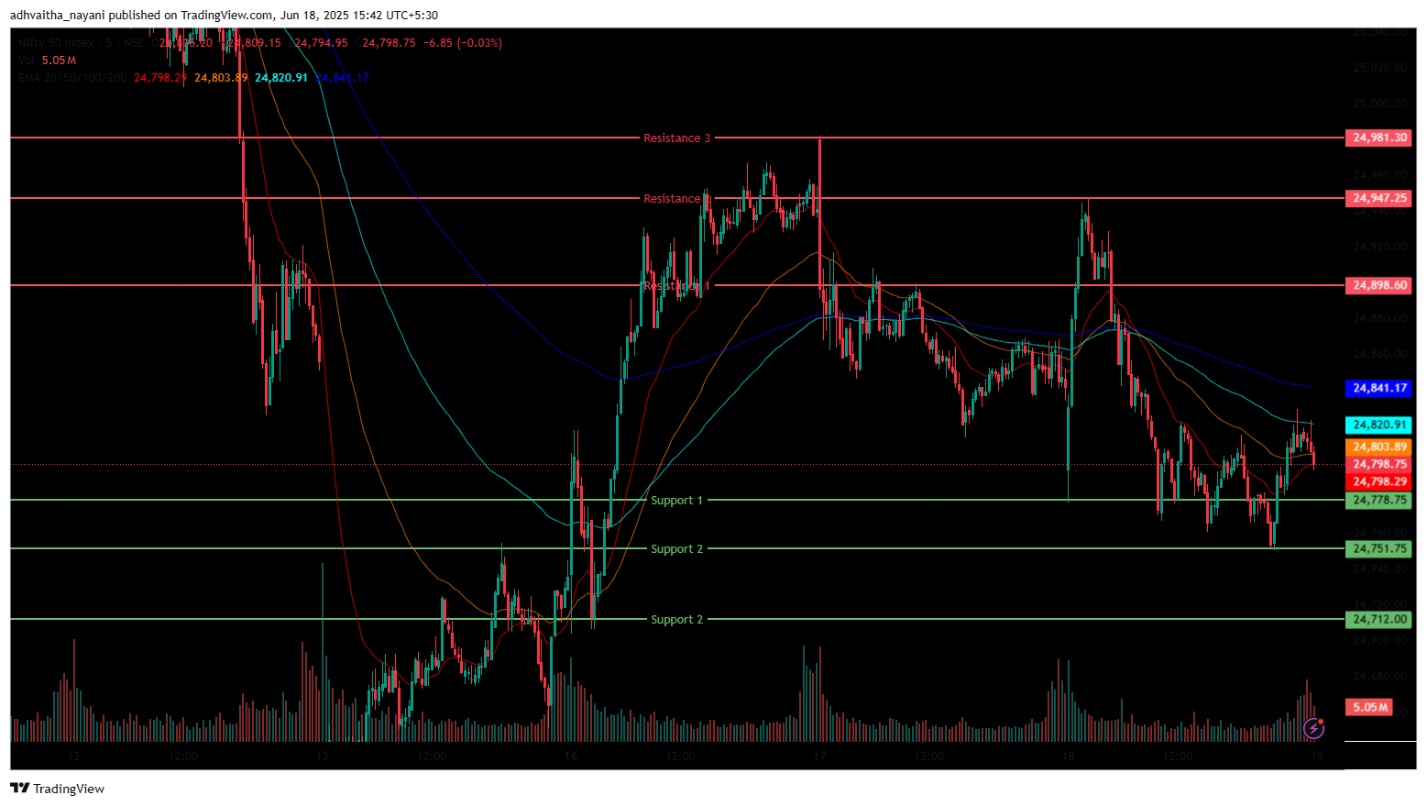
The Nifty 50 Index opened on a negative note at 24,788.35 on Wednesday, down by 65.05 points from Tuesday’s closing of 24,853.40. It was trading slightly below the opening level, around the 24,782.30 range, in the morning session and had remained below all four 20/50/100/200-day EMAs. In the afternoon session, the Nifty Index had reached above the day’s low at 24,798.75 and broke the 20-day EMAs but stayed below the 50/100/200-day EMAs in the 15-minute time frame.
Nifty’s immediate resistance levels are R1 (24,899), R2 (24,947), and R3 (24,981), while immediate support levels are S1 (24,779), S2 (24,752), and S3 (24,712). The Nifty index reached a day’s high at 24,947.55, just below the 25,000 mark, and saw a day’s low at 24,750.45. Finally, it had closed at 24,812.05, down in the red, losing -41.35 points or -0.17%. The Relative Strength Index (RSI) stood at 52.17 (well below the overbought zone of 70) in the daily time frame, and Nifty 50 closed above all four 20/50/100/200 EMAs.
Bank Nifty Chart & Price Action Analysis
(In this analysis, we have used 20/50/100/200 EMAs, where 20 EMA (Red), 50 EMA (Orange), 100 EMA (Light Blue), 200 EMA (Dark Blue)).
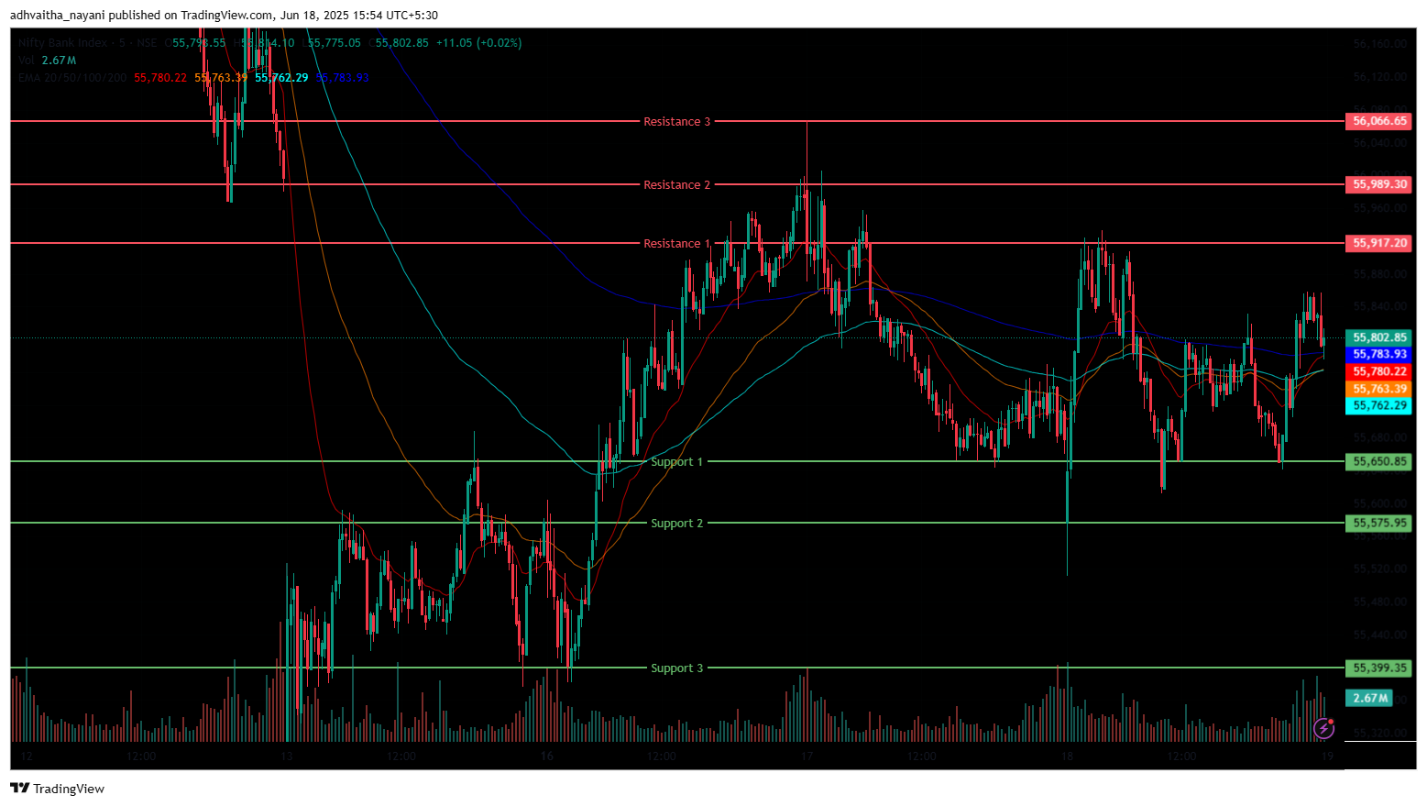
The Bank Nifty Index also opened lower at 55,544.95 on Wednesday, below the previous day’s closing price of 55,714.15. It was trading above the opening level at the 55,747.75 range in the morning session and remained closer to the 20/50-day EMAs. While in the afternoon session, Bank Nifty had rebounded and closed at 55,828.75 and was below 100/200-day EMAs but above 20/50-day EMAs in the 15-minute time frame.
Bank Nifty immediate resistance levels are R1 (55,917), R2 (55,989), and R3 (56,067), while immediate support levels are S1 (55,651), S2 (55,756), and S3 (54,399). The Bank Nifty index peaked at 55,933.60 and had a day’s low at 55,511.80. The Bank Nifty closed in green, up by +114.60 points or 0.21%. The Relative Strength Index (RSI) stood at 53.79 (well below the overbought zone of 70) in the daily time frame, and Bank Nifty closed above all four 20/50/100/200 EMAs in the daily time frame.
BSE Sensex Chart & Price Action Analysis
(In this analysis, we have used 20/50/100/200 EMAs, where 20 EMA (Red), 50 EMA (Orange), 100 EMA (Light Blue), 200 EMA (Dark Blue)).
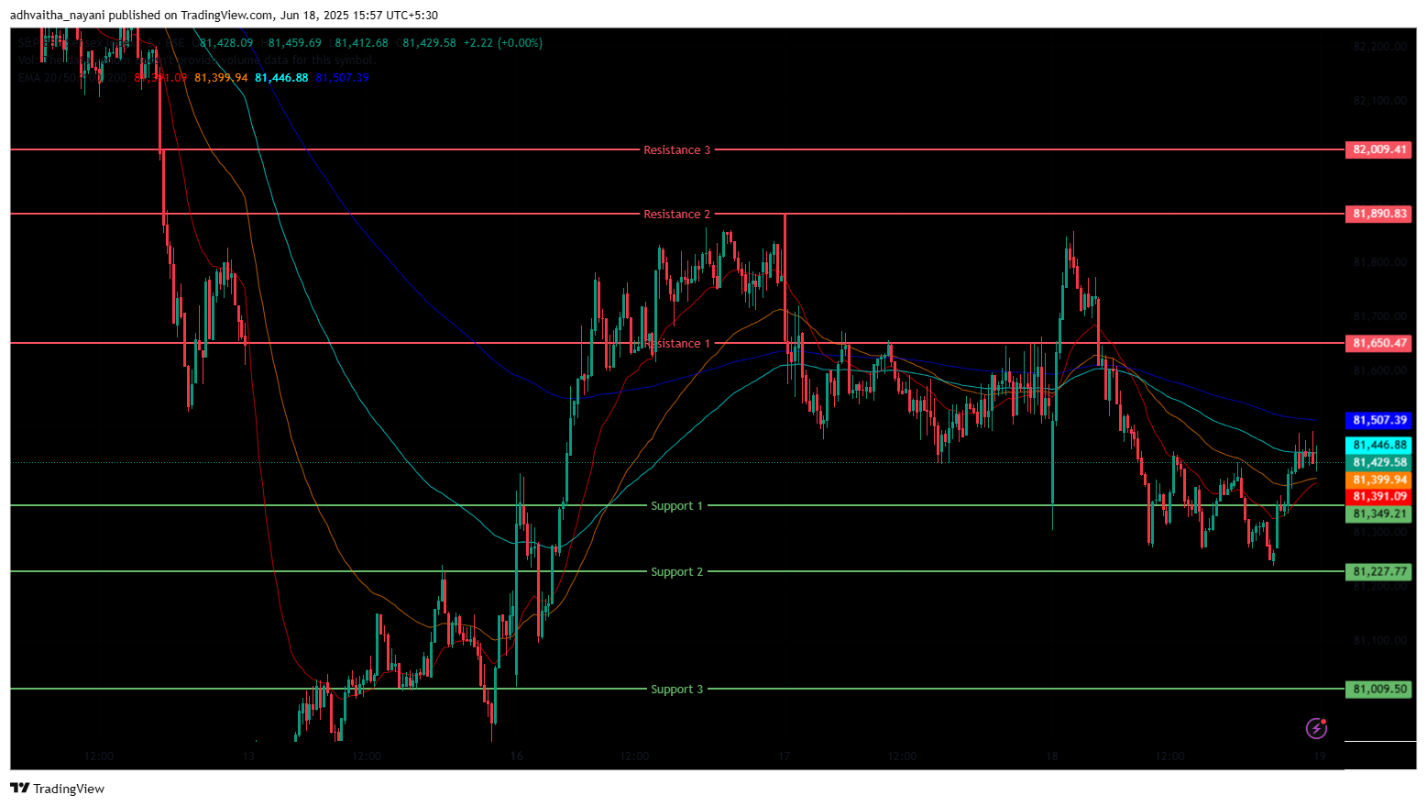
The BSE Sensex Index, on Wednesday, opened at 81,314.62, which was below the previous day’s closing price of 81,583.30. It was trading slightly above the opening level at 81,338.79 in the morning session and remained below in all four 20/50/100/200-day EMAs. In the afternoon session, the BSE Sensex had rebounded and closed above the 81,444.66 level from the day’s low, below the 50/100/200 EMAs, and remained above the 20 EMAs in the 15-minute time frame.
BSE Sensex immediate resistance levels are R1 (81,650), R2 (81,891), and R3 (82,009), while immediate support levels are S1 (81,349), S2 (81,228), and S3 (81,010). The BSE Sensex index peaked at 81,858.97 and had a day’s low at 81,237.01. Finally, it had slightly rebounded from the day’s low to close at 81,444.66, down by -138.64 points or -0.17%. The Relative Strength Index (RSI) stood at 51.21 (well below the overbought zone of 70) in the daily time frame, and BSE Sensex closed above all 50/100/200 EMAs but below the 20-day EMAs in the daily time frame.
Market Recap June 18th, 2025
Indian markets opened on a weak note and remained under pressure throughout Wednesday’s session, weighed down by persistent geopolitical tensions that kept investors on edge. Caution also prevailed ahead of the US Federal Reserve’s interest rate decision. The Nifty 50 began the day at 24,788 and touched an intraday high of 24,947.5 before closing at 24,812, down 41.35 points or 0.17%. It ended below the 20-day EMA, but remained above the 50/100/200-day EMAs on the daily chart, with an RSI of 52.17. The BSE Sensex followed a similar trajectory, opening at 81,314.62 and reaching an intraday high of 81,859. It ended the session at 81,444.6, down 138.6 points or 0.17%, with an RSI of 51.2, also closing below the 20-day EMA but holding above the longer-term EMAs.
On the sectoral front, the Nifty Consumer Durable Index led the gains, closing at 36,992, up 290 points or 0.79%. Stocks like Whirlpool of India, Amber Enterprises, Titan Company, and Kalyan Jewellers rose as much as 3%, lifting the index. The Nifty Private Bank Index also saw gains, adding 109 points or 0.39% to finish at 27,776. IndusInd Bank was the top performer in the sector, rising up to 6% following a “buy” upgrade from global brokerage firm Nomura. Other private banks like RBL Bank, Bandhan Bank, and Federal Bank gained up to 5%. Meanwhile, the Nifty IT Index was among the major laggards, closing at 39,030, down -325 points or -0.83%. Heavyweights such as TCS, LTI Mindtree, HCL Technologies, and Oracle Financial Services fell by up to 2%, dragging the index lower.
Asian markets were mixed as escalating tensions between Iran and Israel kept sentiment in check. Investor anxiety rose amid reports that the US President is considering a military strike on Iran, having urged Iranian leader Ayatollah Ali Khamenei to surrender, raising fears of deeper US involvement in the conflict. The Hang Seng in Hong Kong dropped -1.12% or -269.61 points to 23,710.69. In contrast, South Korea’s Kospi gained 0.74% or 21.89 points to close at 2,972.19. Japan’s Nikkei 225 advanced 348.41 points or 0.9%, settling at 38,885.15. The Shenzhen Index rose 24.16 points or 0.24% to 10,175.59, while Shanghai’s Composite Index ended nearly flat at 3,388.81, up just 1.40 points or 0.04%.
In the US markets, Dow Jones Futures were up 76 points or 0.2% at 42,632, as investors widely expect the Fed to hold interest rates steady in its upcoming policy announcement.
India VIX
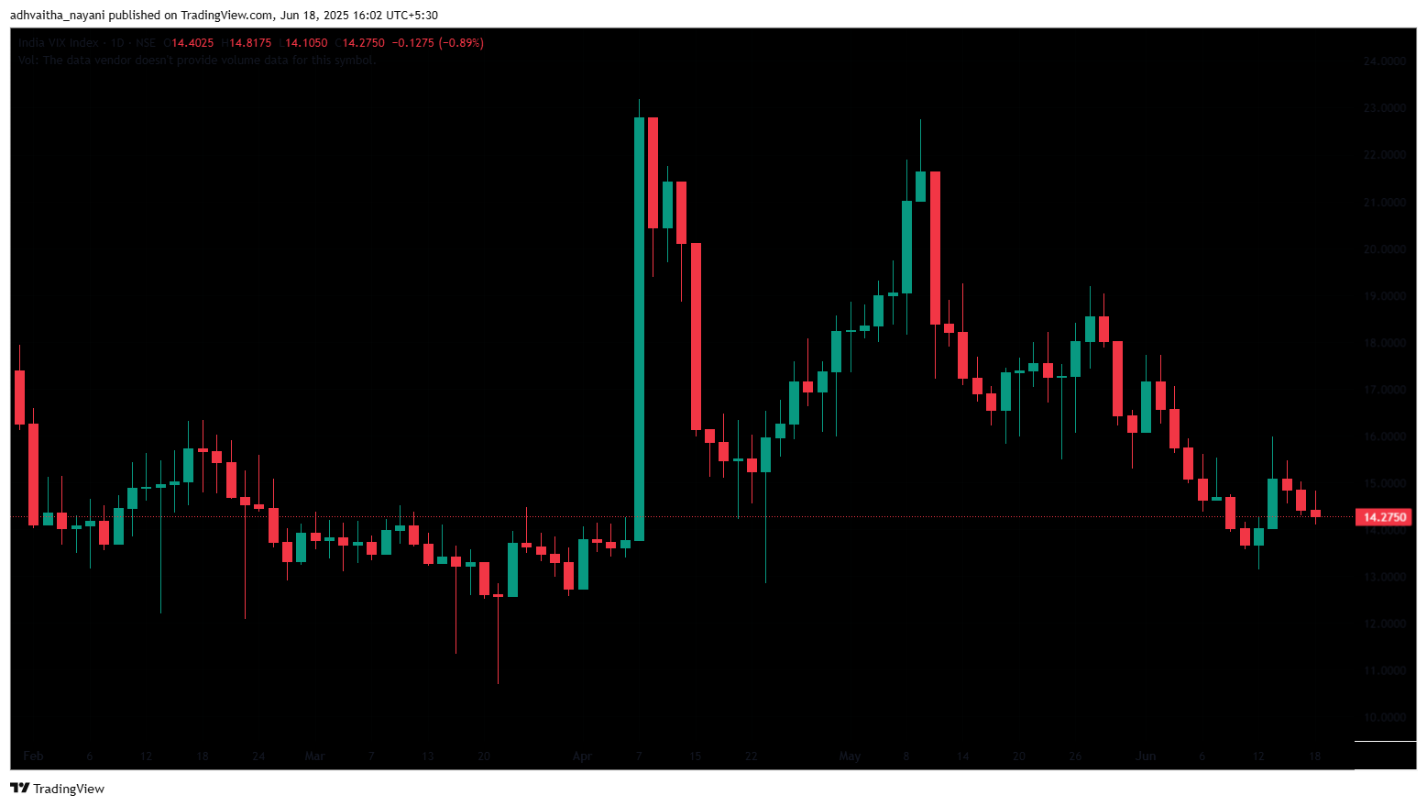
The India VIX decreased from 14.40 to 14.28. The index continued to ease from the recent high of 15.98, which was marked on Friday, thus indicating lessened market volatility.
Trade Setup Summary:
Nifty showed a Mild bearish bias early but found support and closed above all key EMAs. Short setups may be limited unless it breaks below immediate supports. The key resistance and support levels to look for in Thursday’s session are R1 (24,899), R2 (24,947), and R3 (24,981), while the immediate support levels are S1 (24,779), S2 (24,752), and S3 (24,712).
Bank Nifty showed a positive momentum and closed above all EMAs. Short setups are less favored unless it breaks below immediate supports. The key resistance and support levels to look for in the next session are R1 (55,917), R2 (55,989), and R3 (56,067), while immediate support levels are S1 (55,651), S2 (55,756), and S3 (54,399).
Sensex showed mildly negative, but with some support at lower levels. Short setups may be considered if it fails to hold above key supports. The key resistance and support levels to look for in the next session are R1 (81,650), R2 (81,891), and R3 (82,009), while immediate support levels are S1 (81,349), S2 (81,228), and S3 (81,010).
Traders should consider these key support and resistance levels to enter long or short positions following the price break from the key levels. Also, traders can combine moving averages for more accurate entry and exit points.
Disclaimer

The views and investment tips expressed by investment experts/broking houses/rating agencies on tradebrains.in are their own, and not that of the website or its management. Investing in equities poses a risk of financial losses. Investors must therefore exercise due caution while investing or trading in stocks. Trade Brains Technologies Private Limited or the author are not liable for any losses caused as a result of the decision based on this article. Please consult your investment advisor before investing.
About: Trade Brains Portal is a stock analysis platform. Its trade name is Dailyraven Technologies Private Limited, and its SEBI-registered research analyst registration number is INH000015729.
Investments in securities are subject to market risks. Read all the related documents carefully before investing.
Registration granted by SEBI and certification from NISM in no way guarantee performance of the intermediary or provide any assurance of returns to investors.
