
![]()
![]()
Indian stock markets opened on a positive note, continuing their upward momentum from the previous session. The Nifty 50 and Sensex both recorded strong gains, reflecting investor confidence. This rally was largely supported by easing geopolitical tensions and strong participation from domestic institutional investors, which helped lift market sentiment.
Most sectoral indices ended in the green, with metal, oil & gas, and infrastructure stocks leading the gains. Companies in these sectors saw notable buying interest, driven by positive global cues and strong fundamentals. However, a few sectors like media and realty lagged behind, mainly due to profit booking and weak performance from some major players.

Global markets presented a mixed picture. While Japan’s Nikkei showed significant strength, some Asian markets, such as Hong Kong and South Korea, saw declines. Investors globally appeared cautious, but selective markets benefited from local factors and economic optimism.
In this overview, we will analyze the key technical levels and trend directions for Nifty and BSE Sensex to monitor in the upcoming trading sessions. All the charts mentioned below are based on the 5-minute timeframe.
NIFTY 50 Chart & Price Action Analysis
(In this analysis, we have used 20/50/100/200 EMAs, where 20 EMA (Red), 50 EMA (Orange), 100 EMA (Light Blue), 200 EMA (Dark Blue)).
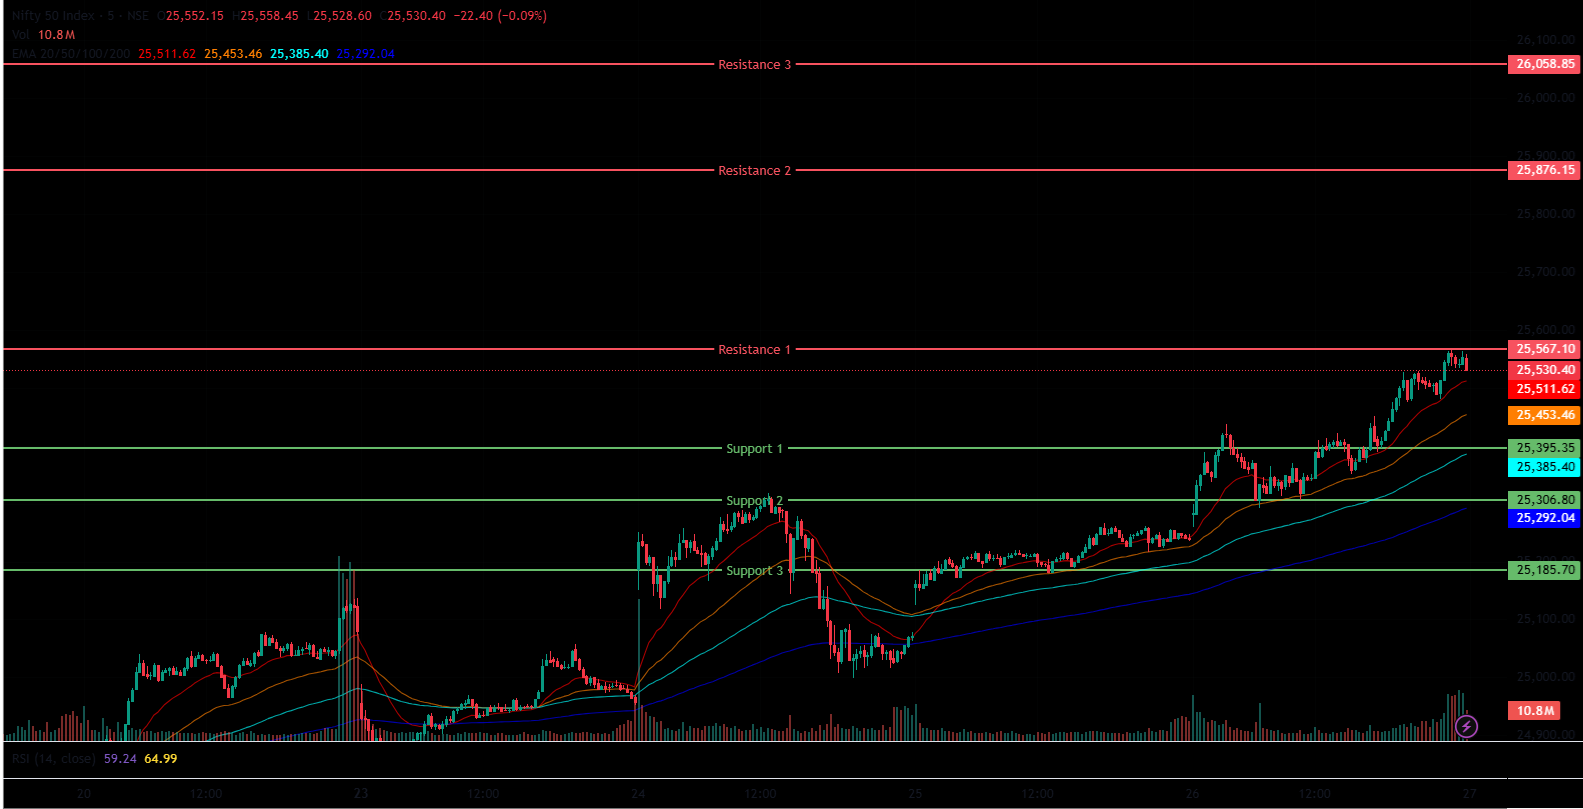
The Nifty 50 Index opened on a positive note at 25,268.95 on Thursday, up by 24.2 points from Wednesday’s closing of 25,244.75. The Nifty Index traded in the green in the morning session, sustaining above the 25,400 level. It was trading above the opening level, slightly consolidating around the 25,400 range, and was above all four 20/50/100/200 EMAs in the 15-minute time frame in the morning session. In the afternoon session, the Nifty Index reached its day’s high at 25,565.30 and closed at 25,549, and stayed above all four 20/50/100/200 EMAs in the 15-minute time frame.
Nifty’s immediate resistance levels are R1 (25,567), R2 (25,876), and R3 (26,059), while immediate support levels are S1 (25,395), S2 (25,307), and S3 (25,186).
The Nifty index had reached a day’s high at 25,565.30, closed above the 25,500 mark, and saw a day’s low at 25,259.90. Finally, it had closed at 25,549, gaining +304.25 points or 1.21%. The Relative Strength Index (RSI) stood at 66.33 (below the overbought zone of 70) in the daily time frame, and Nifty 50 closed above the four 20/50/100/200 EMAs in the daily time frame.
Bank Nifty Chart & Price Action Analysis
(In this analysis, we have used 20/50/100/200 EMAs, where 20 EMA (Red), 50 EMA (Orange), 100 EMA (Light Blue), 200 EMA (Dark Blue)).
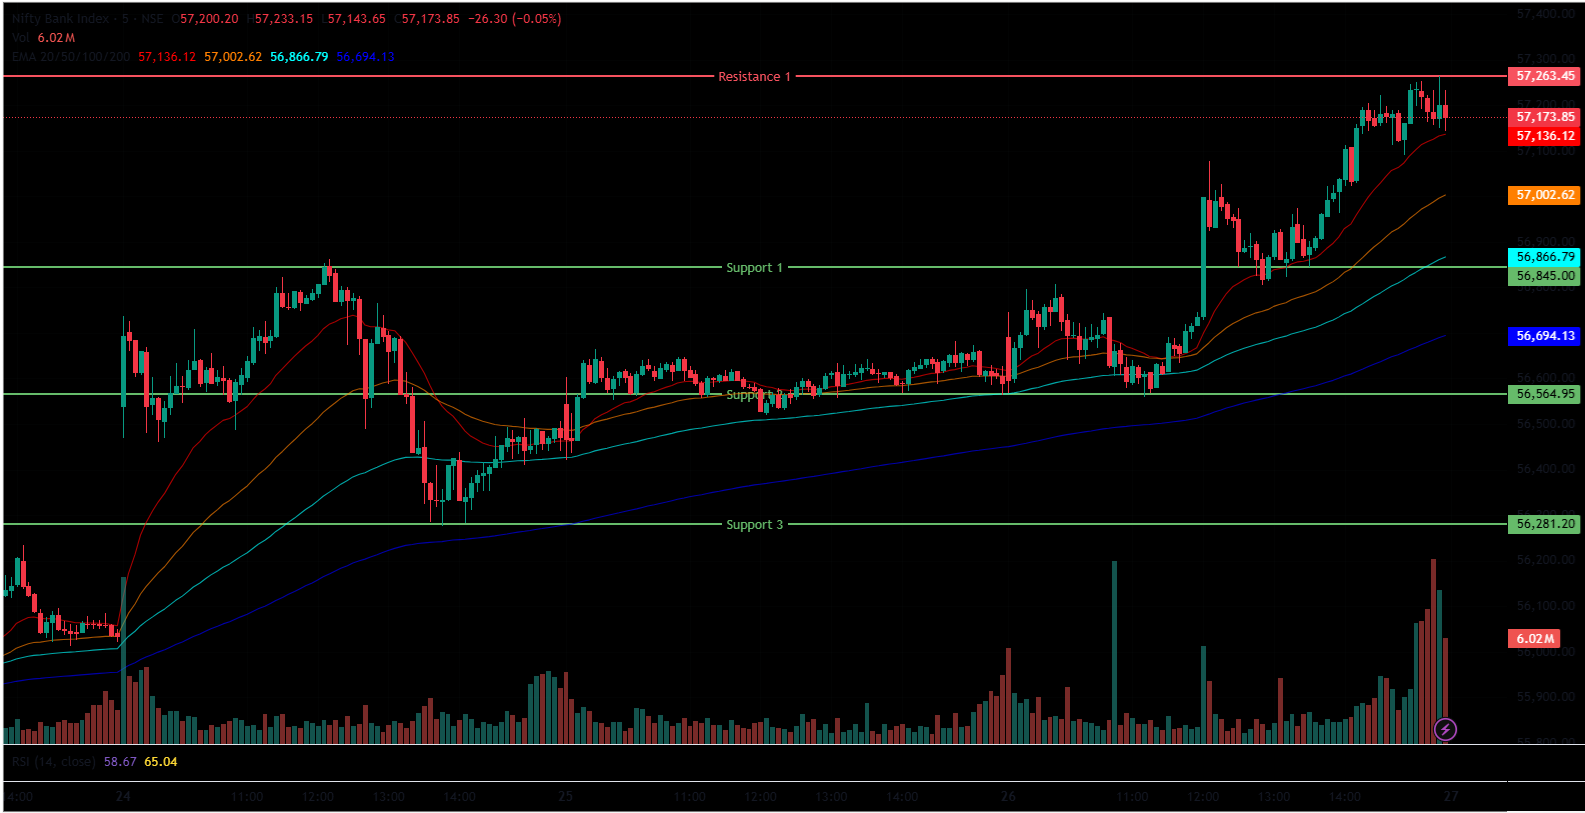
The Bank Nifty Index also followed the same bullish trend, opening at 56,693.55. It was trading above the opening level at the 56,850 level in the morning session, in green and above all four 20/50/100/200 EMAs in the 15-minute time frame. In the afternoon session, the Bank Nifty reached its all-time high at 57,263.45 and closed around 82,755 while staying above all 20/50/100/200-day EMAs in the 15-minute time frame.
Bank Nifty immediate resistance levels are R1 (57,263), while immediate support levels are S1 (56,845), S2 (56,565), and S3 (56,281).
The Bank Nifty index had peaked at 57,263.45, reached its all-time high level, and had a day’s low at 56,558.35. Finally, it had closed at 57,206.70, up by +585.55 points or 1.03%. The Relative Strength Index (RSI) stood at 65.54 (below the overbought zone of 70) in the daily time frame, and Bank Nifty was above the 20/50/100/200 EMAs in the daily time frame.
BSE Sensex Chart & Price Action Analysis
(In this analysis, we have used 20/50/100/200 EMAs, where 20 EMA (Red), 50 EMA (Orange), 100 EMA (Light Blue), 200 EMA (Dark Blue)).
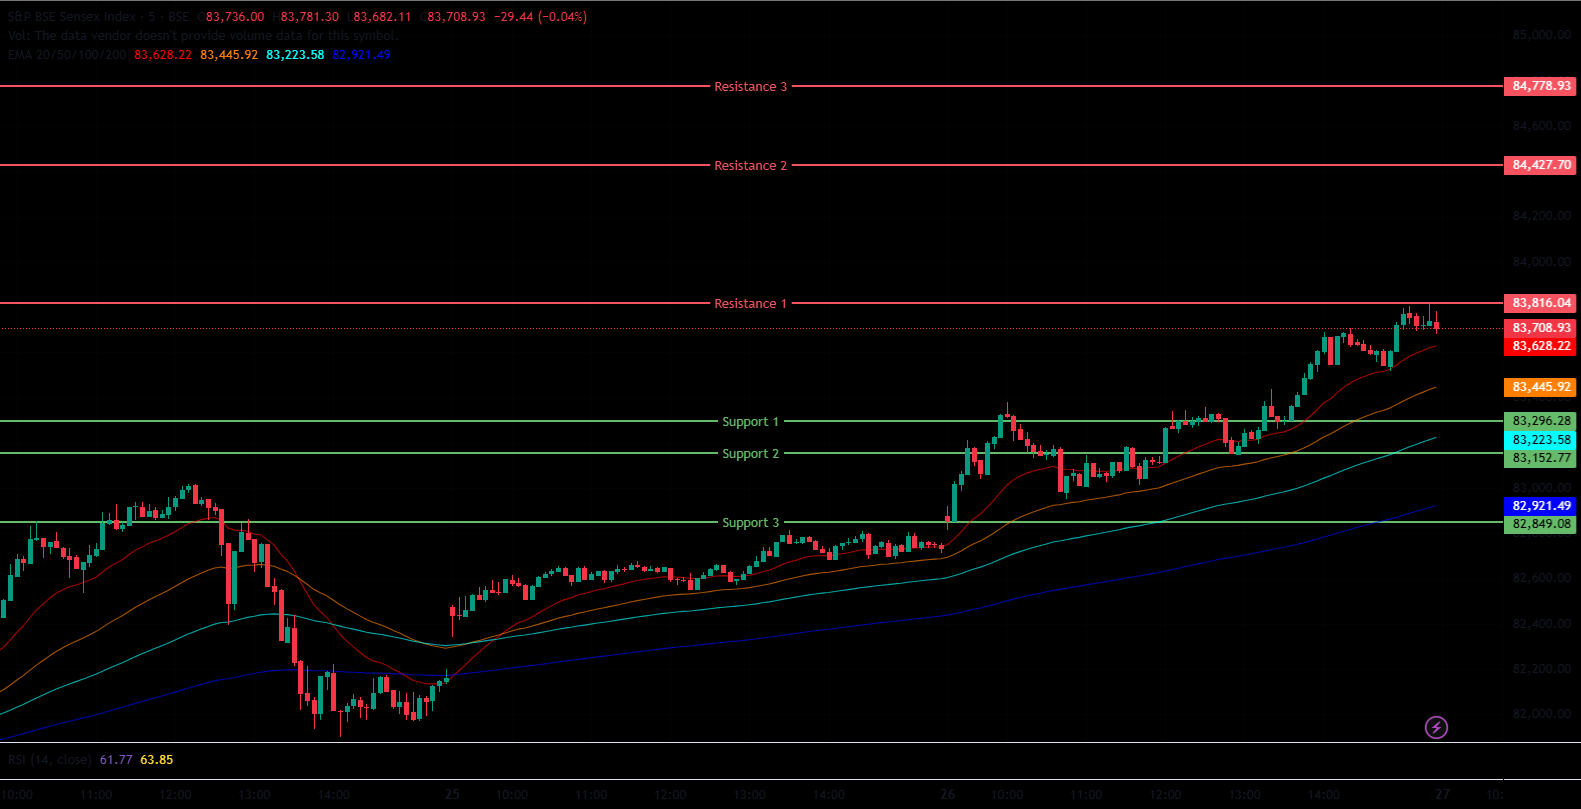
The BSE Sensex Index followed the same optimistic trend, opening at 82,882.92. It was trading above the opening level at the 83,300 level in the morning session, in green and above all four 20/50/100/200 EMAs in the 15-minute time frame. In the afternoon session, the BSE Sensex reached its day’s high at 83,812.09 and closed around 83,755.87 while staying above all 20/50/100/200-day EMAs in the 15-minute time frame. BSE Sensex immediate resistance levels are R1 (83,816), R2 (84,428), and R3 (84,779), while immediate support levels are S1 (83,296), S2 (83,153), and S3 (82,849).
The BSE Sensex index had peaked at 83,812.09 and had a day’s low at 82,816.26. Finally, it had closed at 83,755.87, up by +1000 points or 1.21%. The Relative Strength Index (RSI) stood at 65.33 (below the overbought zone of 70) in the daily time frame, and BSE Sensex was above the 20/50/100/200 EMAs in the daily time frame.
Market Recap June 26th, 2025
The Nifty 50 began the day with a gap-up opening at 25,268.95, marking an increase of 23.25 points or 0.09%, from the previous day’s closing level of 25,244.75. On Thursday, the index gained 304.25 points or 1.21%, reaching a day-high of 25,565.30 in the morning and closing at 25,549. The Relative Strength Index (RSI) stood at 66.33, still below the overbought threshold of 70, and the Nifty closed above all four key exponential moving averages: 20, 50, 100, and 200-day EMAs on the daily chart.
The Sensex also closed on a strong note at 83,755.87, rising by 1,000.36 points or 1.21%, with its RSI at 65.39. The upward momentum in the markets was primarily driven by the easing of geopolitical tensions between Israel and Iran in the Middle East. Additionally, the dollar index touched a three-year low of 97, and strong domestic institutional investor demand further supported the rally.
Most indices ended in the green on Thursday. The Nifty Metal Index was among the top performers, closing at 9,544.55 with a gain of 215.35 points or 2.31%. This rise was supported by stocks such as Hindustan Copper, which jumped 4.96%, while SAIL and Jindal Steel gained over 3%. Other contributors included Vedanta, Jindal Stainless, and NALCO, which rose by up to 3%.
The Nifty Oil and Gas Index also advanced, climbing 213.5 points or 1.86% to close at 11,695.90. Top performers in this segment included Aegis Logistics, Bharat Petroleum, and IOCL, each increasing by more than 3%. The Nifty Infrastructure Index ended at 9,355.80. up by 150.30 points, or 1.63%, with major gainers like Shree Cement, BPCL, and IOCL rising over 3%.
In contrast, the Nifty Media Index declined by 19.30 points or 1.09%, to settle at 1,743.85. The drop was mainly attributed to profit booking in Network 18 Media and losses in other key players such as Zee Entertainment, DB Corp, and Tips Music, which fell up to 3%. Another lagging sector was the Nifty Realty Index, which ended at 1,009.50, down by 10.15 points or 1.00%.
Globally, Hong Kong’s Hang Seng Index dropped by 149.27 points or 0.61%, to 24,325.40. South Korea’s Kospi declined by 28.69 points or 0.92%, to close at 3,079.56. Japan’s Nikkei 225 rose sharply by 642.51 points or 1.65%, closing at 39,584.58 and reaching a five-month high. On the mainland, China’s Shanghai Composite Index ended the session at 3,448.45, down by 7.52 points or 0.22%, while the Shenzhen Index lost 50.25 points or 0.48%, to close at 10,343.48.
India VIX
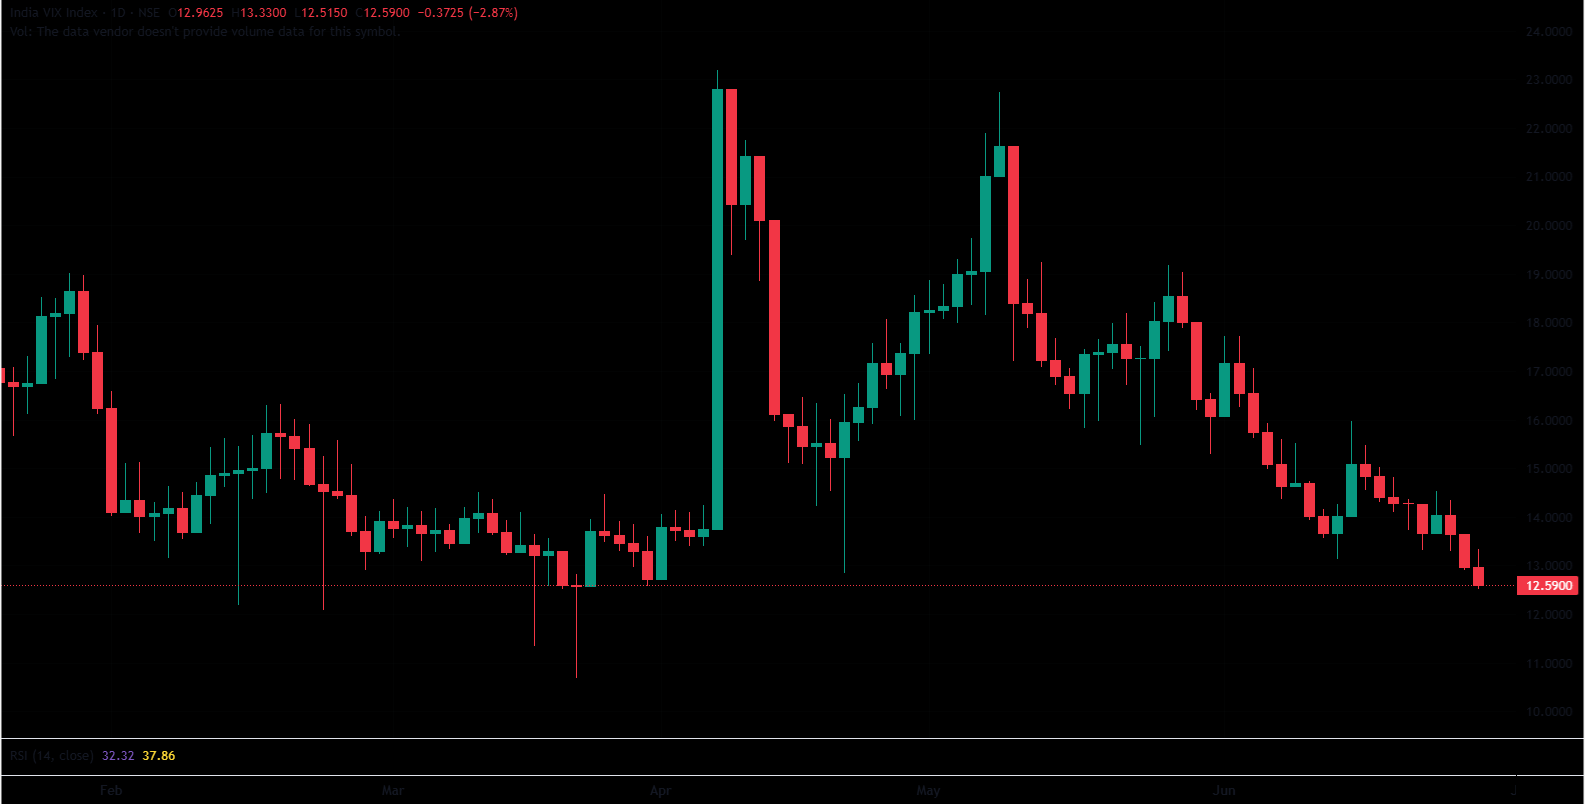
The India VIX decreased from 12.96 to 12.59 on Thursday, down by -0.37 points or -2.87%. This frequently results in more stable markets and possibly a more favorable environment for investments. It’s important to keep in mind, though, that the India VIX represents expected volatility rather than market direction.
Trade Setup Summary
The Nifty 50 opened on a positive note on Thursday and maintained its uptick throughout the morning session, sustaining above the 25,400 mark, and closed at 25,549.00, peaking at 25,565.30. A break below 25,395 could trigger further selling towards 25,307, while a break above 25,567 could trigger bullishness towards 25,876.
Bank Nifty opened on a similar trend, closing on a positive note and sustaining above the 57,200 level, peaking at 57,263.45, an all-time high. A break below 56,845 could trigger further selling towards 56,565, while the next resistance level of 57,263 could lead to new all-time high levels.
Sensex opened on a similar trend, closing on a positive note and sustaining above the 83,750 level, peaking at 83,812.09. A break below 83,296 could trigger further selling towards 83,153, while breaking the next resistance level of 83,816 could lead towards the 84,428 level.
Given the ongoing volatility and mixed sentiments, it’s advisable to avoid aggressive positions and wait for clear directional moves above resistance or below support. Traders should consider these key support and resistance levels when entering long or short positions following the price break from these critical levels. Additionally, traders can combine moving averages to identify more accurate entry and exit points.
Disclaimer

The views and investment tips expressed by investment experts/broking houses/rating agencies on tradebrains.in are their own, and not that of the website or its management. Investing in equities poses a risk of financial losses. Investors must therefore exercise due caution while investing or trading in stocks. Trade Brains Technologies Private Limited or the author are not liable for any losses caused as a result of the decision based on this article. Please consult your investment advisor before investing.
About: Trade Brains Portal is a stock analysis platform. Its trade name is Dailyraven Technologies Private Limited, and its SEBI-registered research analyst registration number is INH000015729.
Investments in securities are subject to market risks. Read all the related documents carefully before investing.
Registration granted by SEBI and certification from NISM in no way guarantee performance of the intermediary or provide any assurance of returns to investors.
