
On Tuesday, Indian equity markets opened on a steady note and maintained a positive bias throughout the day, closing marginally higher. Both the Nifty 50, Bank Nifty and BSE Sensex ended the session in the green, supported by strong technical positioning as they remained above key moving averages. Investor sentiment was buoyed by renewed interest in select IPOs, consistent macroeconomic strength, and overall stability across major sectors. The Relative Strength Index (RSI) for indices stayed below the overbought zone, suggesting that the upward momentum may have more room to continue.
Most sectoral indices ended with gains, led by public sector banks, oil and gas, and infrastructure stocks. Buying interest was seen in key names across these sectors, helping lift the broader market mood. However, weakness was evident in the media and FMCG segments, where stocks faced selling pressure and underperformed the broader indices. Global cues were mixed, with gains in some Asian markets offset by losses in others, while U.S. futures pointed to a slightly weaker start, reflecting cautious investor sentiment.
In this overview, we will analyze the key technical levels and trend directions for Nifty and BSE Sensex to monitor in the upcoming trading sessions. All the charts mentioned below are based on the 5-minute timeframe.
NIFTY 50 Chart & Price Action Analysis
(In this analysis, we have used 20/50/100/200 EMAs, where 20 EMA (Red), 50 EMA (Orange), 100 EMA (Light Blue), 200 EMA (Dark Blue)).
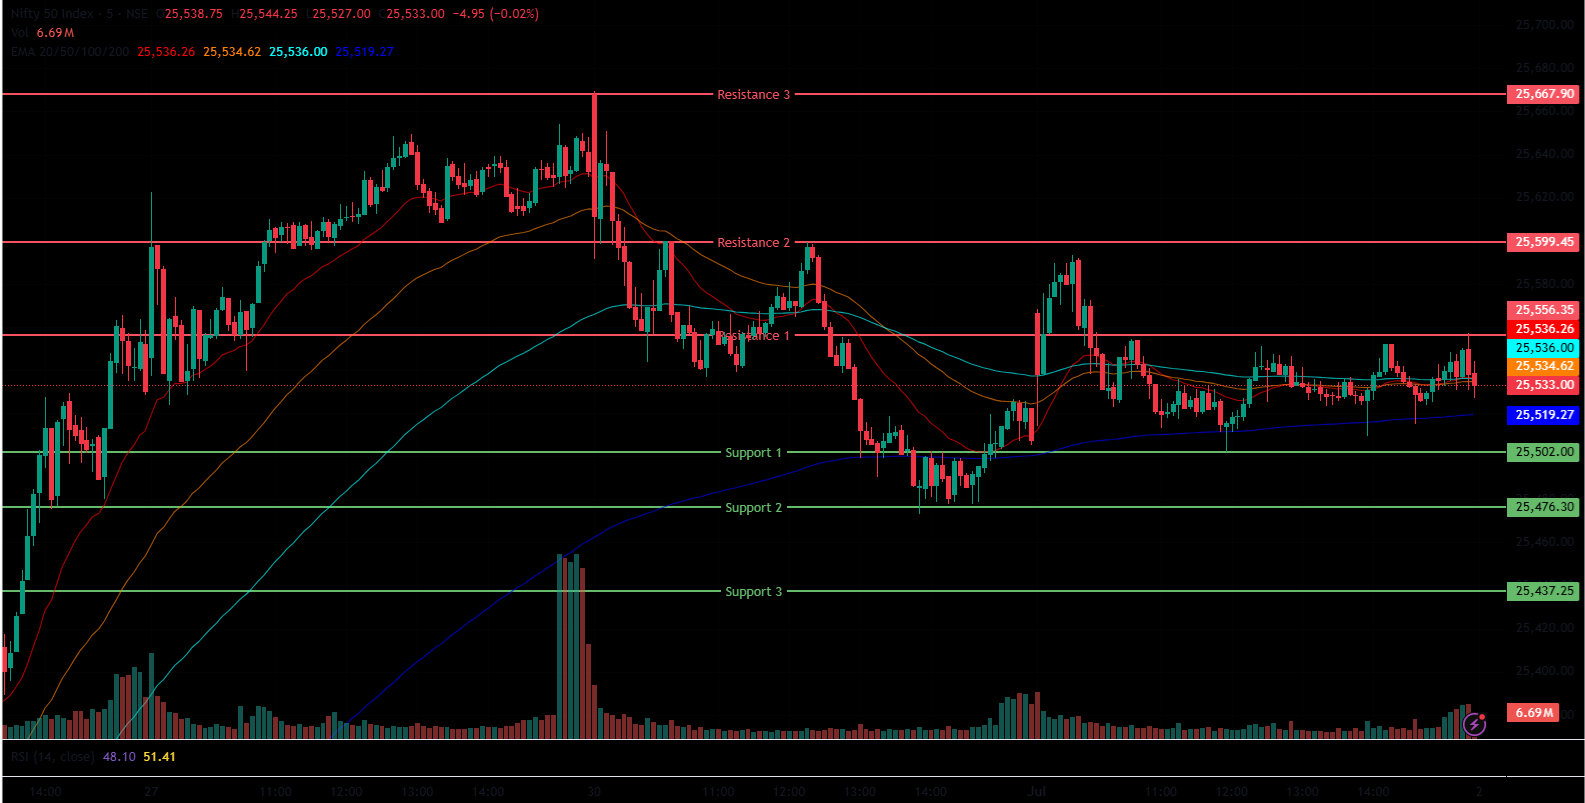
The Nifty 50 Index opened on a slightly positive note at 25,551.35 on Tuesday, up by 34.3 points from Monday’s closing of 25,517.05. The Nifty Index traded in the red in the morning session, slightly consolidating around the 25,538 level and made a day’s low at 25,502. It was trading below the opening level, slightly declining to the 25,500 range from 25,550, and was above all four 20/50/100/200 EMAs in the 15-minute time frame in the morning session. In the afternoon session, the Nifty Index rebounded from day’s low and consolidated at the 25,515-25,552 range, and closed at 25,541.80. It stayed above all four 20/50/100/200 EMAs in the 15-minute time frame. Nifty’s immediate resistance levels are R1 (25,556), R2 (25,599), and R3 (25,668), while immediate support levels are S1 (25,502), S2 (25,476), and S3 (25,437).
The Nifty index had reached a day’s high at 25,593.40, but closed in green below the 25,550 mark, and saw a day’s low at 25,501.80. Finally, it had closed above the day’s low at 25,541.80, gaining 24.75 points or 0.097%. The Relative Strength Index (RSI) stood at 64.29 (below the overbought zone of 70) in the daily time frame, and Nifty 50 closed above the four 20/50/100/200 EMAs in the daily time frame.
Bank Nifty Chart & Price Action Analysis
(In this analysis, we have used 20/50/100/200 EMAs, where 20 EMA (Red), 50 EMA (Orange), 100 EMA (Light Blue), 200 EMA (Dark Blue)).
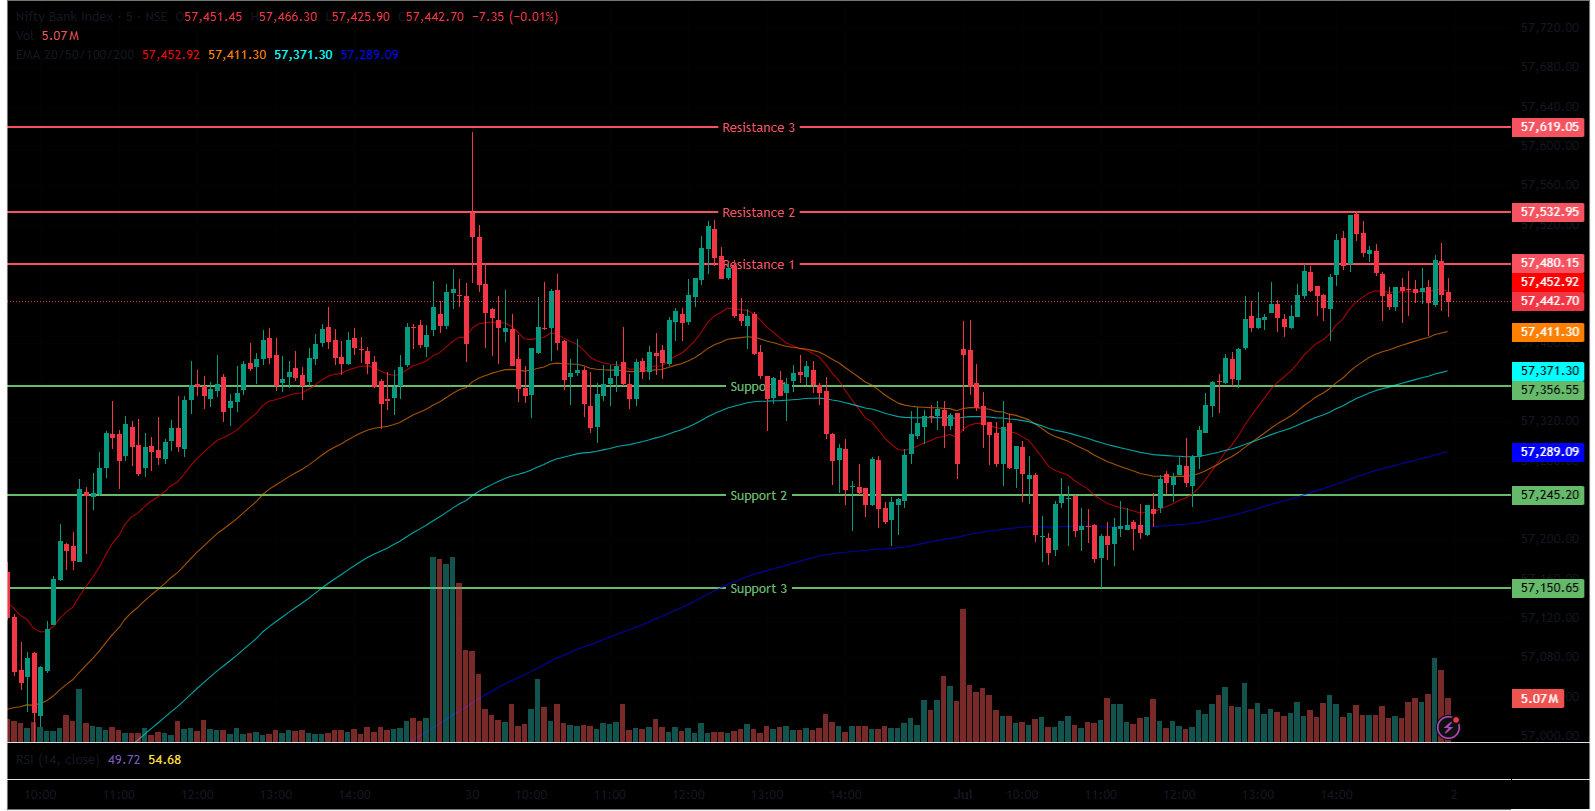
The Bank Nifty Index also followed a similar trend, opening at 57,375.80 on Tuesday, up by 63.05 points from Monday’s closing of 57,312.75. It was trading above the opening level at the 57,364 level in the morning session, in green, was above all four 20/50/100/200 EMAs in the 15-minute time frame. In the afternoon session, the Bank Nifty continued to rally higher reaching its day’s high at 57,533.85 and closed around 57,459.45 while staying above all four 20/50/100/200-day EMAs in the 15-minute time frame.
Bank Nifty immediate resistance levels are R1 (57,480), R2 (57,533), and R3 (57,619), while immediate support levels are S1 (57,357), S2 (57,245), and S3 (57,151). The Bank Nifty index had peaked at 57,533.85 and had a day’s low at 57,150.35. Finally, it closed at 57,459.45, up by 146.7 points or 0.26%. The Relative Strength Index (RSI) stood at 66.51 (below the overbought zone of 70) in the daily time frame, and Bank Nifty was above the 20/50/100/200 EMAs in the daily time frame.
BSE Sensex Chart & Price Action Analysis
(In this analysis, we have used 20/50/100/200 EMAs, where 20 EMA (Red), 50 EMA (Orange), 100 EMA (Light Blue), 200 EMA (Dark Blue)).
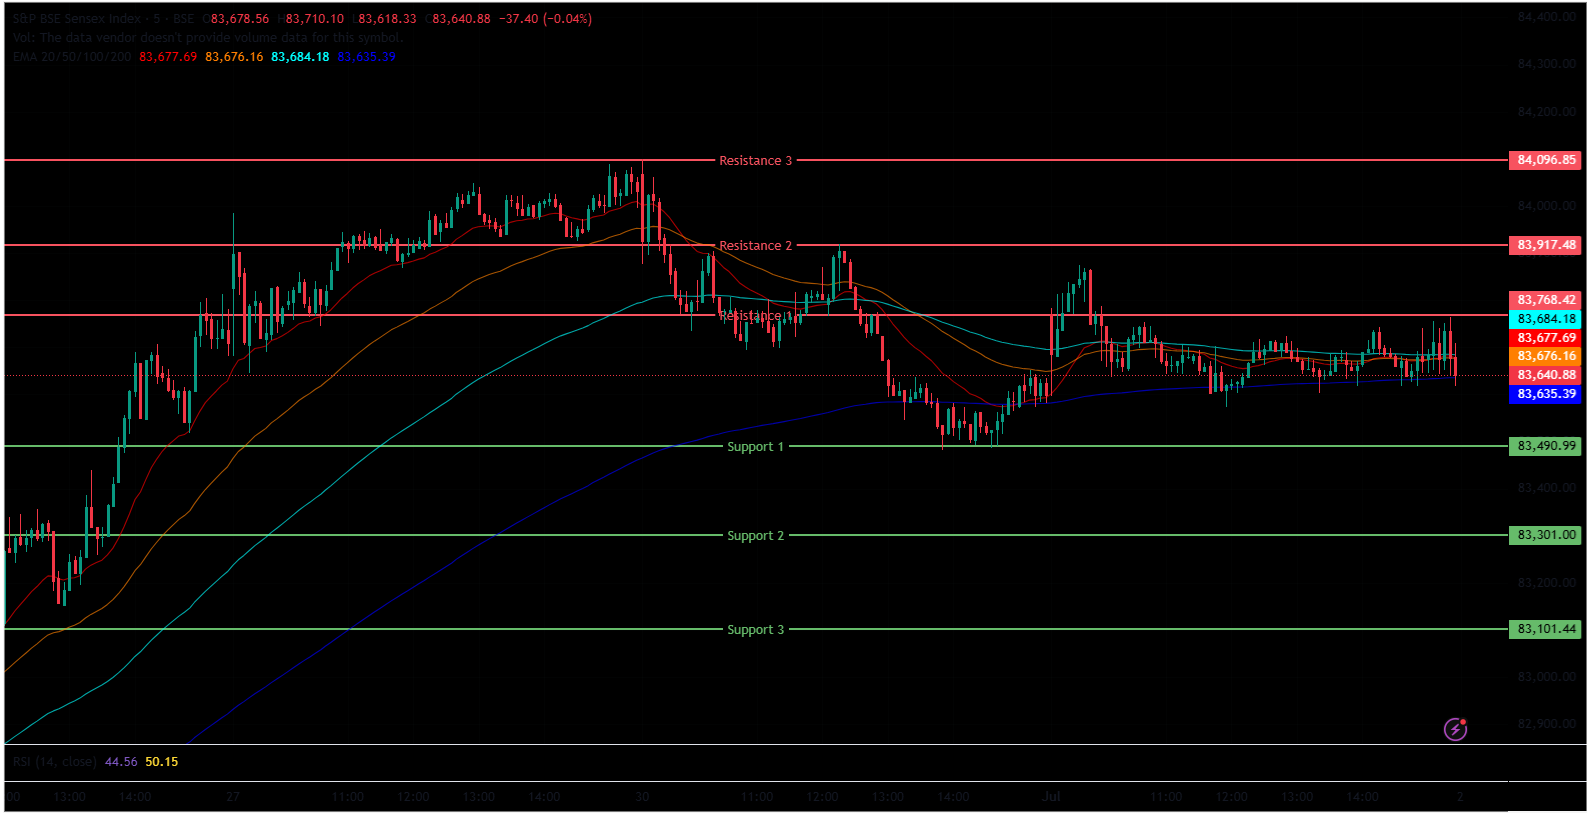
The BSE Sensex Index followed the same trend, opening at 83,685.66 on Tuesday, up by 79.2 points from Monday’s closing of 83,606.46. It was trading above the opening level at 83,693 range in the morning session, in green, and above all 20/50/100/200 EMAs in the 15-minute time and made a day’s low at 83,573. In the afternoon session, the BSE Sensex consolidated in range between 83,618-83,733 and closed around 83,697.29 while staying above 100/200 EMAs but below the 20/50 EMAs in the 15-minute time frame.
BSE Sensex immediate resistance levels are R1 (83,768), R2 (83,918), and R3 (84,097), while immediate support levels are S1 (83,491), S2 (83,301), and S3 (83,101). The BSE Sensex index had peaked at 83,874.29 and had a day’s low at 83,572.51. Finally, it closed at 83,697.29, up by 91 points or 0.11%. The Relative Strength Index (RSI) stood at 63.03 (below the overbought zone of 70) in the daily time frame, and BSE Sensex was above all four 20/50/100/200 EMAs in the daily time frame.
Market Recap July 01, 2025
On Tuesday, the Nifty 50 opened flat at 25,551.35 and stayed in positive territory throughout the session, ending with a modest gain of 24.75 points, or 0.10%, at 25,541.80. The Relative Strength Index (RSI) stood at 64.29, comfortably below the overbought mark of 70. The index also closed above all its key moving averages the 20-, 50-, 100-, and 200-day EMAs on the daily chart. A similar trajectory was seen in the BSE Sensex, which opened at 83,685.66 and hit an intraday high of 83,874.29. It closed the day at 83,697.29, gaining 90.83 points, or 0.11%, with an RSI of 63.03, and remained above all key EMAs. The session was largely driven by renewed investor interest in select IPOs, sectoral movements, and strong macroeconomic indicators.
Most sectoral indices ended in the green. The Nifty PSU Bank Index extended its winning streak to a sixth consecutive session, rising 51.20 points, or 0.71%, to close at 7,253.0. The rally was supported by gains in Indian Overseas Bank, which surged 2.5%, while Punjab National Bank and Bank of Maharashtra added over 2%. Other contributors included Bank of India, Central Bank of India, and UCO Bank, which rose by up to 2.5%.
The Nifty Oil & Gas Index also saw gains, rising 57.80 points, or 0.49%, to end at 11,858.75, led by Reliance Industries and GSPL, both of which advanced more than 1.5%. Similarly, the Nifty Infra Index climbed 41.90 points, or 0.45%, to close at 9,451.25. Key contributors included Apollo Hospitals, which jumped over 3%, along with Siemens Ltd and Reliance Industries, which gained 2.20% and 1.85%, respectively.
On the flip side, the Nifty Media Index was one of the biggest laggards, slipping 23.05 points, or 1.31%, to settle at 1,731. Declines in Zee Entertainment, Network 18 Media, DB Corp, and Saregama India each falling up to 3% weighed on the index. The Nifty FMCG Index also closed lower by 380.95 points, or 0.69%, at 54,502, dragged down by losses in Nestle India, United Spirits, Britannia Industries, and Radico Khaitan, all of which declined around 2.2%.
Asian markets presented a mixed picture. South Korea’s Kospi edged up 0.58%, or 17.95 points, to 3,089.65. Japan’s Nikkei 225 fell sharply by 501 points, or 1.24%, to 39,986, while the Shanghai Composite Index gained 13.32 points, or 0.39%, closing at 3,457.75. As of 4:30 p.m., Dow Jones Futures were trading 44 points lower, down 0.10%, at 44,050.
India VIX
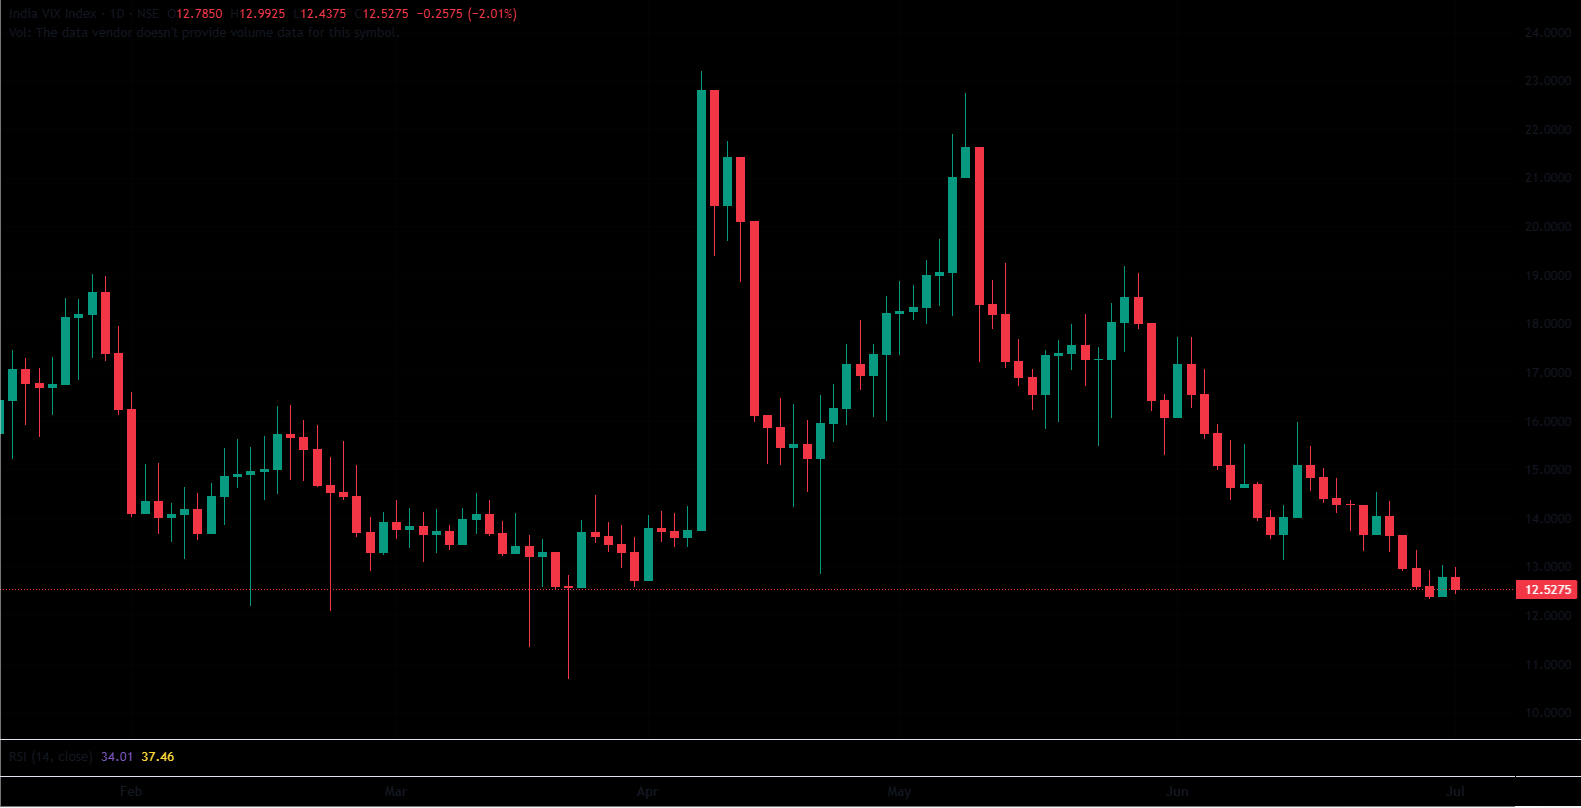
The India VIX decreased from 12.78 to 12.53 on Tuesday, down by 0.26 points or 2.01%. The decrease in the index shows an ease in market volatility.
Trade Setup Summary
The Nifty 50 opened on a positive note on Tuesday but consolidated in a range throughout the morning to afternoon session, trading in the 25,515-25,552 range, and closed at 25,541.80, peaking at 25,593.40. A break below 25,502 could trigger further selling towards 25,476, while a break above 25,556 could trigger bullishness towards 25,599.
Bank Nifty opened on a similar trend, closing on a positive note and breaking above the 57,400 level. A break below 57,357 could trigger further selling towards 57,245, while a break above 57,480 could trigger bullishness towards 57,533.
Sensex opened on a similar trend, closing on a positive note, and was above the 83,600 level. A break below 83,491 could trigger further selling towards 83,301, while breaking the next resistance level of 83,768 could lead towards the 83,918 level.
Given the ongoing volatility and mixed sentiments, it’s advisable to avoid aggressive positions and wait for clear directional moves above resistance or below support. Traders should consider these key support and resistance levels when entering long or short positions following the price break from these critical levels. Additionally, traders can combine moving averages to identify more accurate entry and exit points.
Disclaimer

The views and investment tips expressed by investment experts/broking houses/rating agencies on tradebrains.in are their own, and not that of the website or its management. Investing in equities poses a risk of financial losses. Investors must therefore exercise due caution while investing or trading in stocks. Trade Brains Technologies Private Limited or the author are not liable for any losses caused as a result of the decision based on this article. Please consult your investment advisor before investing.
About: Trade Brains Portal is a stock analysis platform. Its trade name is Dailyraven Technologies Private Limited, and its SEBI-registered research analyst registration number is INH000015729.
Investments in securities are subject to market risks. Read all the related documents carefully before investing.
Registration granted by SEBI and certification from NISM in no way guarantee performance of the intermediary or provide any assurance of returns to investors.
