The market responded in a bullish way on Tuesday. Indicating ongoing positive momentum, the Nifty 50 and BSE Sensex both finished higher, trading above all significant exponential moving averages. Improved retail confidence raised investor mood, although prudence persisted because of the expected results of the India-US trade pact.
Due to robust stock-specific gains, the Realty and CPSE indexes performed better sectorally. On the other hand, the healthcare and consumer durables industries saw pressure to sell, with the former failing as a result of key firms’ underwhelming profits. Asian markets closed primarily in the green, reflecting this upbeat outlook. Futures in the US market stayed mostly unchanged, reflecting a wait-and-watch sentiment.
In this overview, we will analyse the key technical levels and trend directions for Nifty and BSE Sensex to monitor in the upcoming trading sessions. All the charts mentioned below are based on the 5-minute timeframe.
Nifty 50
(In this analysis, we have used 20/50/100/200 EMAs, where 20 EMA (Red), 50 EMA (Orange), 100 EMA (Light Blue), and 200 EMA (Dark Blue)).
To view other technical reports, click here
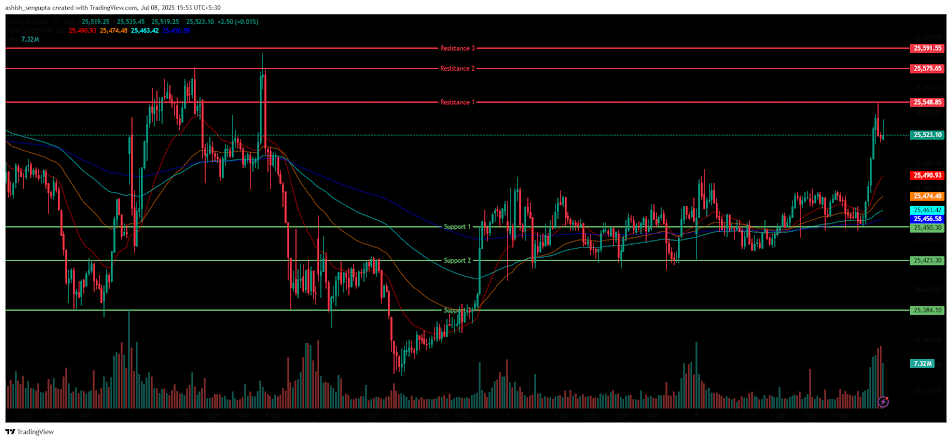
The Nifty 50 Index opened in red at 25,427.85 on Tuesday, down 33.45 points from Monday’s closing of 25,461.30. The Nifty Index was volatile in the morning session and was trading in the range of 25,430 and 25,476. It was consolidating around the opening level of 25,468 and was above all four 20/50/100/200 EMAs in the 15-minute time frame in the morning session. In the afternoon session, the Nifty Index was volatile and picked up the momentum and rebounded from its day’s low of 25,424.15 and closed in green at 25,522.50. During the afternoon session, it closed above all four EMAs (20/50/100/200 EMAs) in the 15-minute time frame in the afternoon session.
Nifty’s immediate resistance levels are R1 (25,548.85), R2 (25,575.65), and R3 (25,591.55), while immediate support levels are S1 (25,450.30), S2 (25,423.30), and S3 (25,384.10). The Nifty index had reached a day’s high at 25,548.05, closed in green above the 25,500 level, and saw a day’s low at 25,424.15.
Finally, it had closed above the opening level at 25,522.50, gaining 61.20 points or 0.24%. The Relative Strength Index (RSI) stood at 62.53 (below the overbought zone of 70) in the daily time frame, and Nifty 50 closed above the four 20/50/100/200 EMAs in the daily time frame.
Bank Nifty
(In this analysis, we have used 20/50/100/200 EMAs, where 20 EMA (Red), 50 EMA (Orange), 100 EMA (Light Blue), and 200 EMA (Dark Blue)).
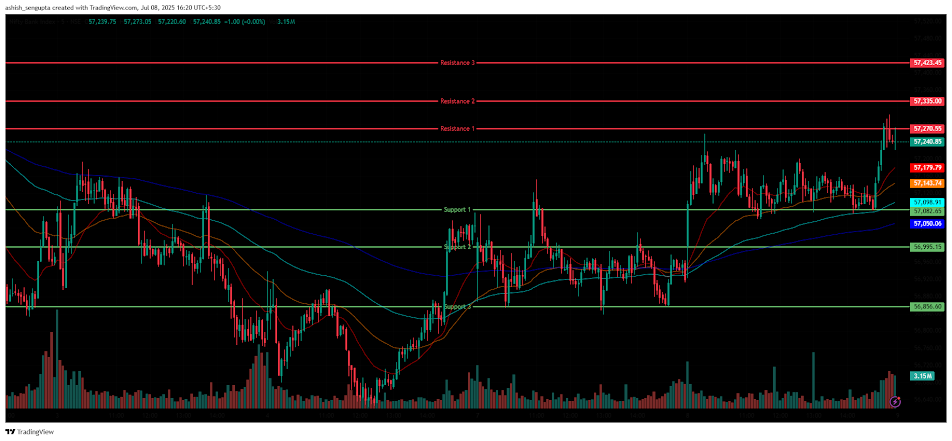
The Bank Nifty Index also followed a similar trend as the Nifty 50, opening at 56,942.55 on Tuesday, down by 6.65 points from Monday’s closing of 56,949.20. It was trading between the range of 57,100 and 57,200 levels in the morning session, indicating volatility, and was above all four 20/50/100/200 EMAs in the 15-minute time frame. In the afternoon session, the Bank Nifty broke the 57,200 level above and rallied up and made its day’s high of 57,303.30 and closed above the 57,200 mark, around 57,256.30. During the afternoon session, it closed above all four EMAs of 20/50/100/200 in the 15-minute time frame in the afternoon session.
Bank Nifty immediate resistance levels are R1 (57,270.55), R2 (57,335), and R3 (57,423.45), while immediate support levels are S1 (57,082.65), S2 (56,995.15), and S3 (56,856.60). The Bank Nifty index had peaked at 57,303.30 and made a day’s low at 56,923.05. Finally, it closed in green at 57,256.30, gaining 307.10 points or 0.54%. The Relative Strength Index (RSI) stood at 61.14 (below the overbought zone of 70) in the daily time frame, and Bank Nifty was above the four 20/50/100/200 EMAs in the daily time frame.
Sensex
(In this analysis, we have used 20/50/100/200 EMAs, where 20 EMA (Red), 50 EMA (Orange), 100 EMA (Light Blue), and 200 EMA (Dark Blue)).
To view other technical reports, click here
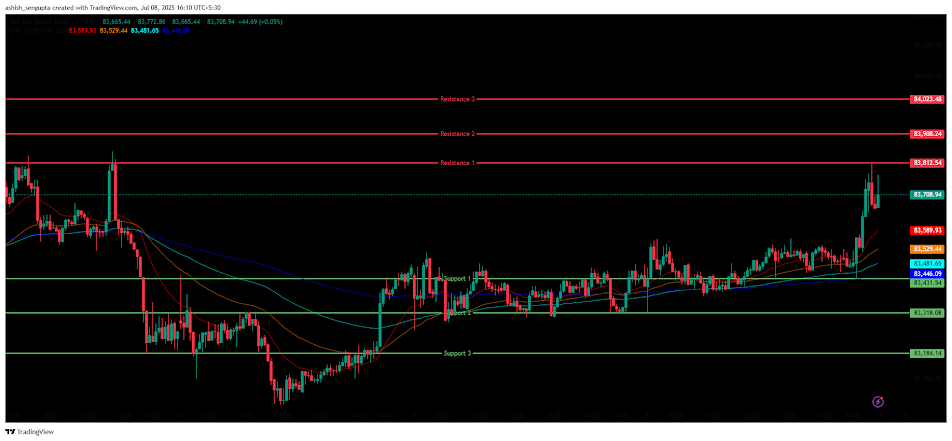
The BSE Sensex Index followed the same trend, opening on a negative note at 83,387.03 on Tuesday, down by 55.47 points from Monday’s closing of 83,442.50. The Index was volatile in the morning session and was trading in the range of 83400 and 83500. It was consolidating near the opening level of 83,492 and was trading above all four 20/50/100/200 EMAs in the 15-minute time frame in the morning session. In the afternoon session, the Sensex Index gradually picked up the momentum and broke the 83,700 mark, bounced back from its day’s low of 83,320.95 and closed in green at 83,712.51. During the afternoon session, it traded above all four EMAs of 20/50/100/200 in the 15-minute time frame in the afternoon session.
BSE Sensex immediate resistance levels are R1 (83,812.54), R2 (83,908.24), and R3 (84,023.48), while immediate support levels are S1 (83,446.09), S2 (83,431.54), and S3 (83,184.14). The BSE Sensex index had peaked at 83,812.31 and finally, it closed at 83,712.51, up by 270.01 points or 0.32%. The Relative Strength Index (RSI) stood at 61.97 (slightly above the overbought zone of 70) in the daily time frame, and the BSE Sensex was above all four 20/50/100/200 EMAs in the daily time frame.
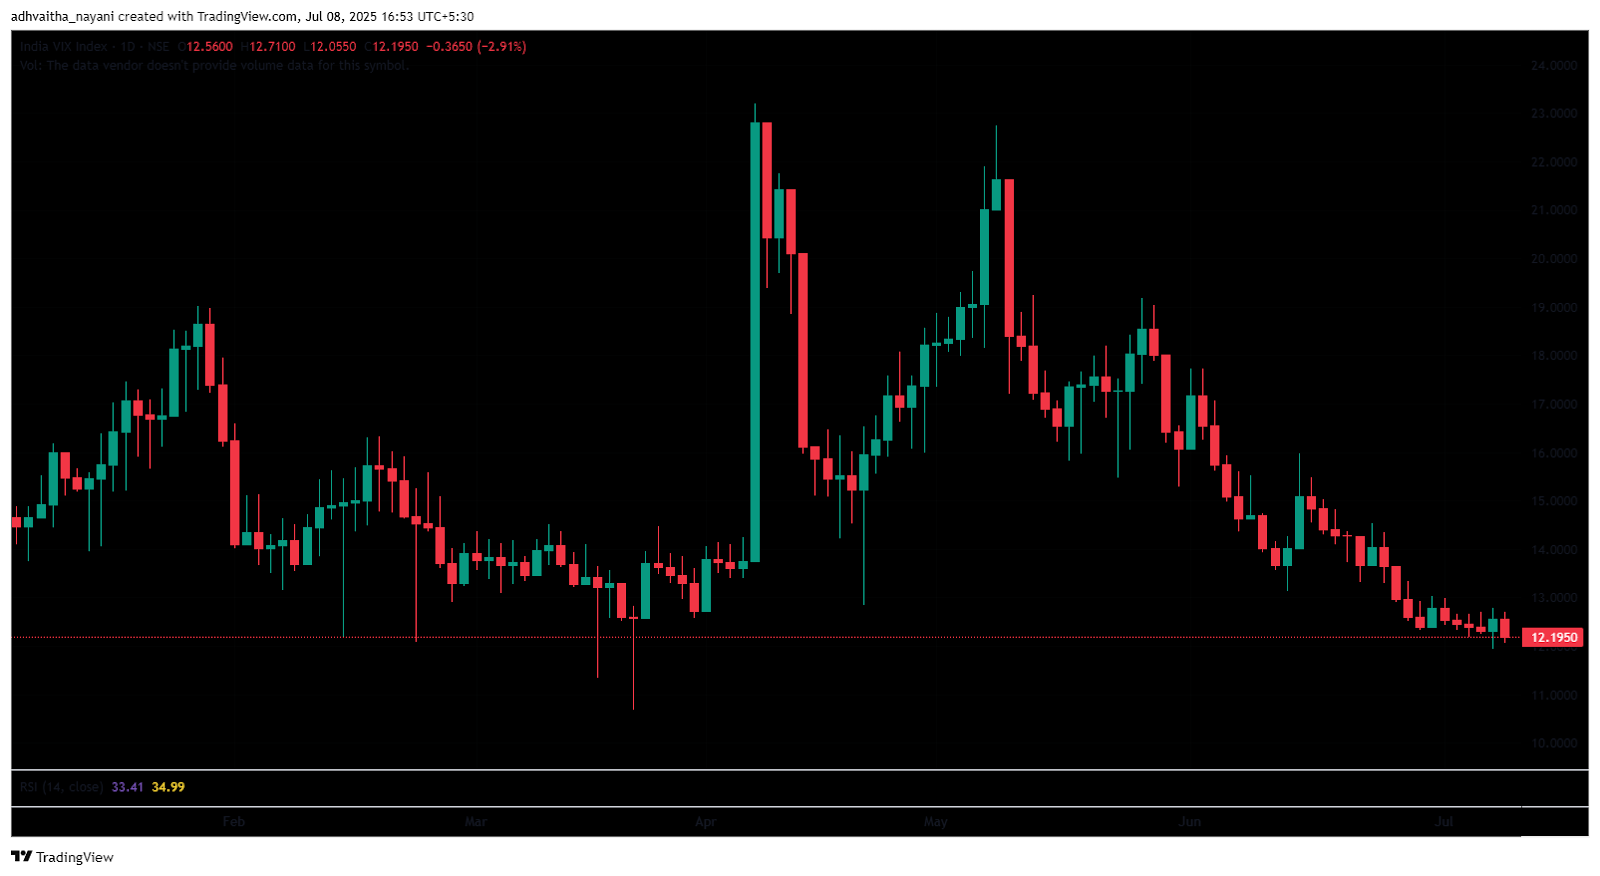
India VIX
The India VIX decreased from 12.56 to 12.20 on Tuesday, down by -0.37 points or -2.91%. The wide decrease in the VIX index shows reduced expected volatility.
Market Recap 8th July 2025
The Nifty 50 ended the day up 61.20 points, or 0.24%, after starting above the EMA on Tuesday at 25,427.85, rising to the day’s high of 25,548.05, and ending at 25,522.50. The BSE Sensex opened at 83,387.03, showing an upward trend, and closed at 83,712.51, up 270.01 points, or 0.32%. With the Nifty 50 RSI at 62.53 and the BSE Sensex RSI at 61.97 (far below the overbought threshold of 70), both indexes were trading above all four EMAs (20/50/100/200). Although sceptical about the anticipated outcomes of the India-US trade agreement, both benchmark indexes recorded moderate increases powered by a rise in retail investor confidence.
On Tuesday, the indicators gave conflicting indications. Nifty Realty was the biggest sector gainer, closing at 982.35, up 0.99% or 9.60 points. Prestige Estate Projects, Phoenix Mills, and Brigade Enterprises all reported gains of above 1.5%.
The Nifty CPSE index rose 59.60 points, or 0.91%, to close at 6,636.90, with gains of over 1% in equities such as Bharat Electronics Ltd., NTPC, and NHPC. Conversely, the Nifty Consumer Durable index finished at 38,248.80, down -895.50 points, or -2.29%. The underperformance of Titan Company Ltd’s jewellery division compared to its projections was the primary cause of the company’s more than 6% decrease. Other stocks, including Whirlpool of India Ltd., PG Electroplast, and Crompton Greaves Consumer Electricals Ltd., all witnessed declines of more than 2%, which contributed to the index’s decline. Furthermore, the Nifty Health Index ended the day at 14,588, down -131.30 points, or -0.89%. On Tuesday, stocks of companies including Dr. Reddy Laboratories, Aurobindo Pharma, Lupin, and Granules India dropped more than 2%.
Tuesday saw a largely positive finish for Asian markets. The South Korean Kospi index increased by 1.78%, or 55.48 points, to end at 3,114.95, while the Hong Kong Hang Seng index increased by 1.08%, or 260.24 points, to conclude at 24,148.07. At 39,688.81, Japan’s Nikkei 225 finished the day up by 101.13 points, or 0.25%. At 3,473.13, the Shanghai index finished the day up by 24.35 points, or 0.70%. The US Dow Jones Futures ended Tuesday’s trading day at 44,416.46, up 11.09 points, or 0.03%, at 5:00 PM.
Trade Setup Summary
The Nifty 50 opened in red on Tuesday but was volatile in the morning session, but rebounded later in the afternoon session, and closed on a positive note at 25,522.50, peaking at 25,548.05. A break below 25,450.30 could trigger further selling towards 25,423.30, while a break above 25,548.85 could trigger bullishness towards 25,575.65.
Bank Nifty opened on a similar trend, opening in red and ending at 57,256.30, above the 57,000 mark. A break below 57,082.65 could trigger further selling towards 56,995.15, while a break above 57,270.55 could trigger bullishness towards 57,335.
Sensex opened on a similar trend, opening on a negative note, and ended above the 83,700 level at 83,712.51. A break below 83,446.09 could trigger further selling towards 83,431.54, while breaking the next resistance level of 83,812.54 could lead towards the 83,908.24 level.
Given the ongoing volatility and mixed sentiments, it’s advisable to avoid aggressive positions and wait for clear directional moves above resistance or below support. Traders should consider these key support and resistance levels when entering long or short positions following the price break from these critical levels. Additionally, traders can combine moving averages to identify more accurate entry and exit points.
Disclaimer

The views and investment tips expressed by investment experts/broking houses/rating agencies on tradebrains.in are their own, and not that of the website or its management. Investing in equities poses a risk of financial losses. Investors must therefore exercise due caution while investing or trading in stocks. Trade Brains Technologies Private Limited or the author are not liable for any losses caused as a result of the decision based on this article. Please consult your investment advisor before investing.
About: Trade Brains Portal is a stock analysis platform. Its trade name is Dailyraven Technologies Private Limited, and its SEBI-registered research analyst registration number is INH000015729.
Investments in securities are subject to market risks. Read all the related documents carefully before investing.
Registration granted by SEBI and certification from NISM in no way guarantee performance of the intermediary or provide any assurance of returns to investors.
