
Following a volatile day, worries about the impending earnings season, trade tariffs, and possible trade agreement announcements between the US and India caused the Indian equities markets to conclude down. The benchmark indexes declined as a result of selling pressure seen in the metal, oil and gas, and IT sectors.
The FMCG industry enjoyed increases, helped by strong results from a few companies, although the overall market remained weak. On the other hand, sector-specific pressures like news pertaining to tariffs caused real estate and metal stocks to fall. With some indices finishing in the red and others rising, Asian markets had a mixed finish. At the closure of the Indian market, US futures had a little upward trend.
In this overview, we will analyse the key technical levels and trend directions for Nifty and BSE Sensex to monitor in the upcoming trading sessions. All the charts mentioned below are based on the 5-minute timeframe.
Nifty 50
(In this analysis, we have used 20/50/100/200 EMAs, where 20 EMA (Red), 50 EMA (Orange), 100 EMA (Light Blue), and 200 EMA (Dark Blue)).
To view other technical reports, click here
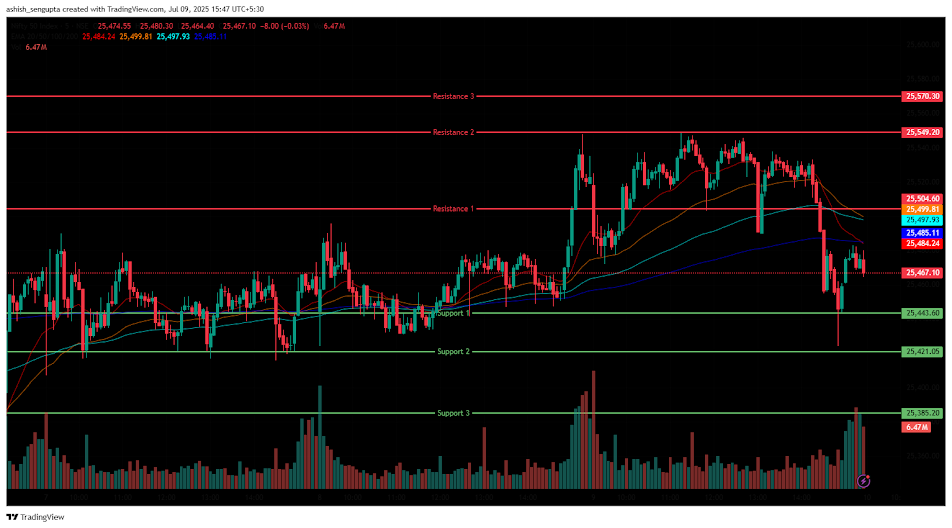
The Nifty 50 Index opened in red at 25,514.60 on Wednesday, down 7.9 points from Tuesday’s closing of 25,522.50. The Nifty Index was volatile in the morning session and was trading in the range of 25,480 and 25,540. It was consolidating around the opening level of 25,532 and was above all four 20/50/100/200 EMAs in the 15-minute time frame in the morning session. In the afternoon session, the Nifty Index was volatile and dragged down, losing its momentum, and rebounded from its day’s low of 25,424.35 and closed in red at 25,476.10. During the afternoon session, it closed below EMAs (20/50/100 EMAs) and remained only above the 200 EMA in the 15-minute time frame in the afternoon session.
Nifty’s immediate resistance levels are R1 (25,504.60), R2 (25,549.20), and R3 (25,570.30), while immediate support levels are S1 (25,443.60), S2 (25,421.05), and S3 (25,385.20).
The Nifty index had reached a day’s high at 25,548.70, closed in red below the 25,500 level, and saw a day’s low at 25,424.35. It had closed below the opening level at 25,476.10, losing -46.40 points or -0.18%. The Relative Strength Index (RSI) stood at 60.61 (below the overbought zone of 70) in the daily time frame, and Nifty 50 closed above the four 20/50/100/200 EMAs in the daily time frame.
Bank Nifty
(In this analysis, we have used 20/50/100/200 EMAs, where 20 EMA (Red), 50 EMA (Orange), 100 EMA (Light Blue), and 200 EMA (Dark Blue)).
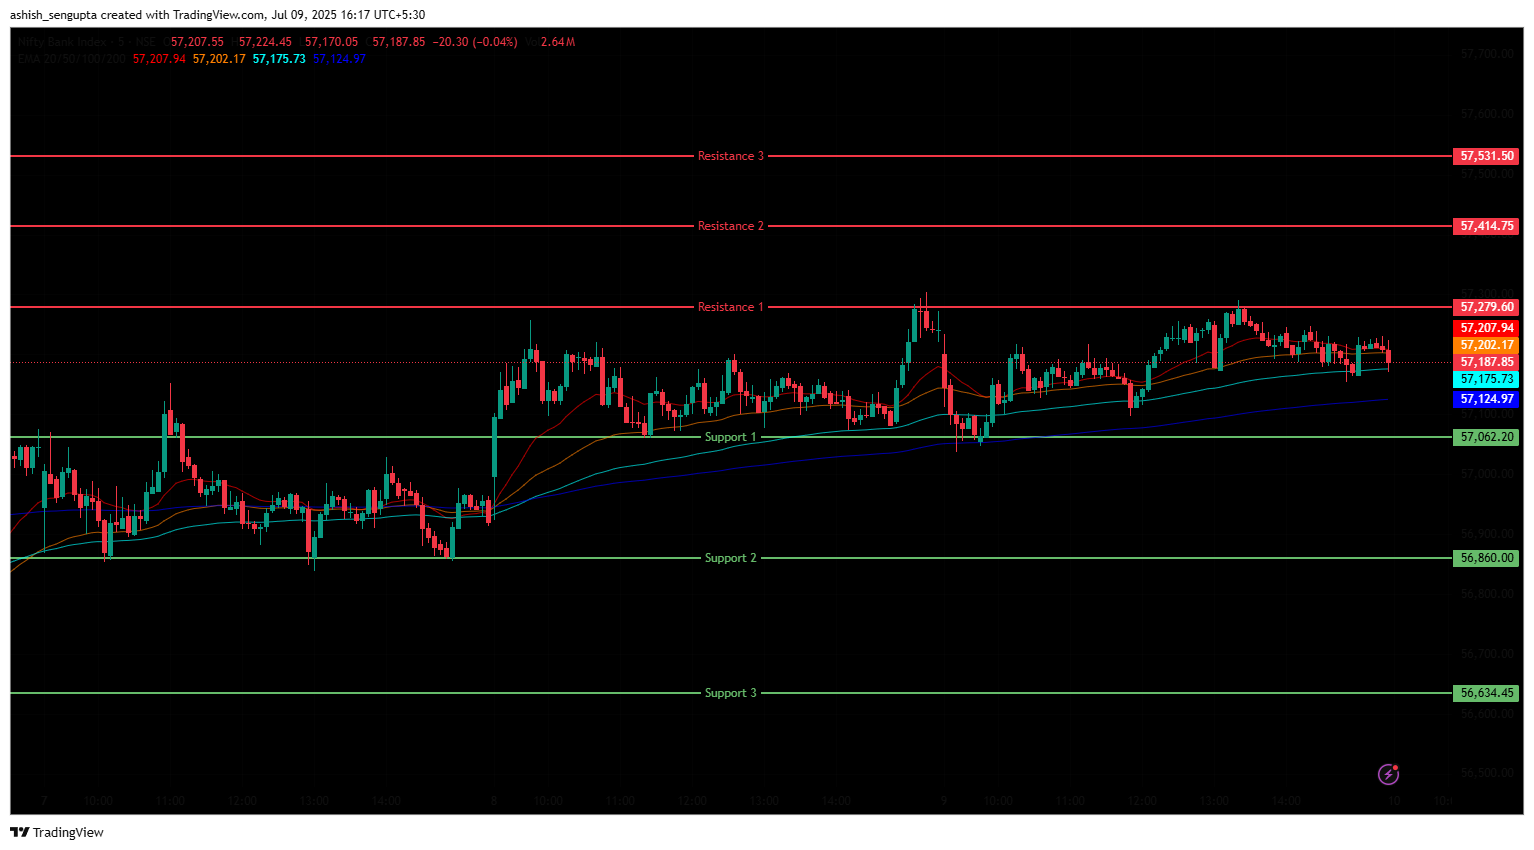
The Bank Nifty Index also followed a similar trend as the Nifty 50, opening at 57,199.75 on Wednesday, down by 56.55 points from Tuesday’s closing of 57,256.30. It was trading between the range of 57,000 and 57,250 levels in the morning session, indicating volatility, and was above all four 20/50/100/200 EMAs in the 15-minute time frame. In the afternoon session, the Bank Nifty broke the 57,200 level above and rallied up and made its day’s high of 57,290.65 and closed at 57,213.55. During the afternoon session, it closed above EMAs of 50/100/200 and remained only below 20 EMA in the 15-minute time frame in the afternoon session.
Bank Nifty immediate resistance levels are R1 (57,279.60), R2 (57,414.75), and R3 (57,531.50), while immediate support levels are S1 (57,062.20), S2 (56,860), and S3 (56,634.45).
The Bank Nifty index had peaked at 57,290.65 and made a day’s low at 57,037.90. It closed in red at 57,213.55, losing -42.75 points or -0.075%. The Relative Strength Index (RSI) stood at 60.45 (below the overbought zone of 70) in the daily time frame, and Bank Nifty was above the four 20/50/100/200 EMAs in the daily time frame.
Sensex
(In this analysis, we have used 20/50/100/200 EMAs, where 20 EMA (Red), 50 EMA (Orange), 100 EMA (Light Blue), and 200 EMA (Dark Blue)).
To view other technical reports, click here
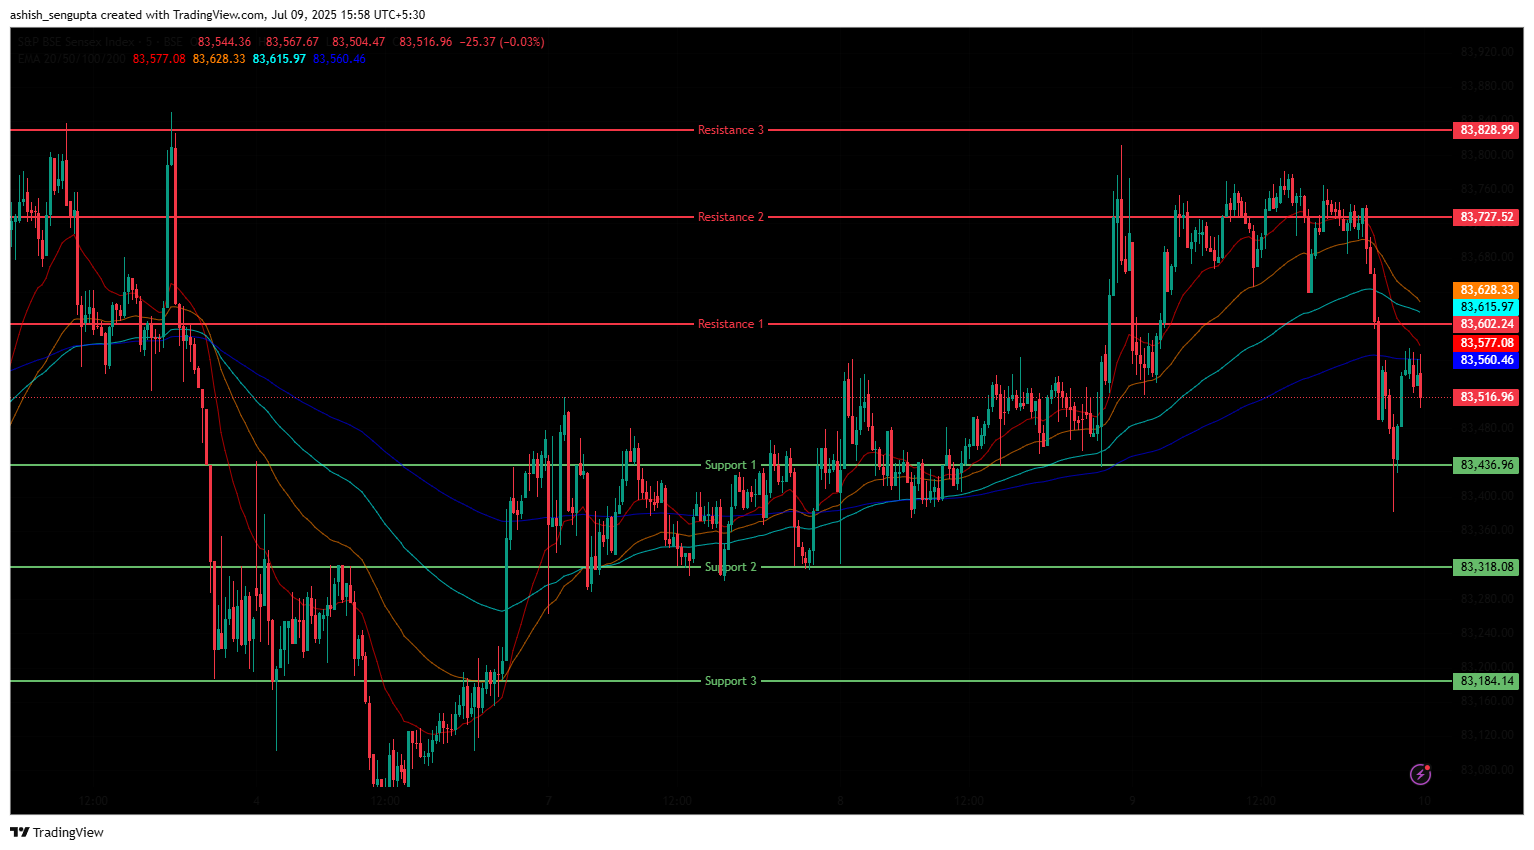
The BSE Sensex Index followed the same trend, opening on a negative note at 83,625.89 on Wednesday, down by 86.62 points from Tuesday’s closing of 83,712.51. The Index was volatile in the morning session and was trading in the range of 83,550 and 83,800. It was consolidating near the opening level of 83,745 and was trading above all four 20/50/100/200 EMAs in the 15-minute time frame in the morning session. In the afternoon session, the Sensex Index was volatile and dragged down, losing its momentum and breaking the 83,500 mark, bouncing back from its day’s low of 83,382.28 and closing in red at 83,536.08. During the afternoon session, it traded below EMAs of 20/50/100 and remained only above the 200 EMA in the 15-minute time frame in the afternoon session.
BSE Sensex immediate resistance levels are R1 (83,602.24), R2 (83,727.52), and R3 (83,828.99), while immediate support levels are S1 (83,436.96), S2 (83,318.08), and S3 (83,184.14).
The BSE Sensex index had peaked at 83,781.36 and finally, it closed at 83,536.08, down by -176.43 points or -0.21%. The Relative Strength Index (RSI) stood at 59.82 (slightly above the overbought zone of 70) in the daily time frame, and the BSE Sensex was above all four 20/50/100/200 EMAs in the daily time frame.
India VIX
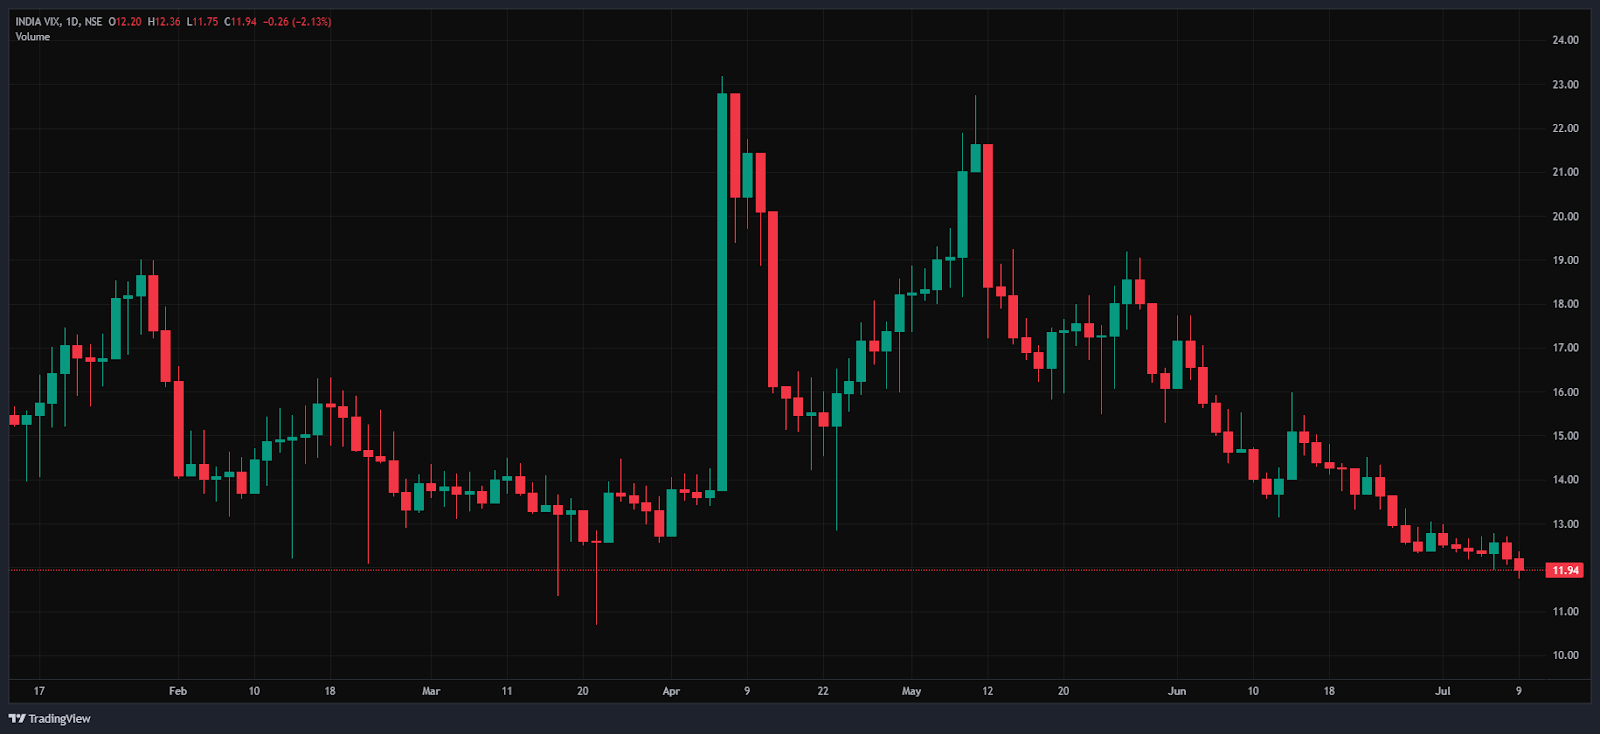
The India VIX decreased from 12.20 to 11.94 on Wednesday, down by -0.26 points or -2.09%. The wide decrease in the VIX index shows reduced expected volatility.
Market Recap 9th July 2025
The Nifty 50 ended in red, down by 46.4 points, or 0.18%, after starting the day in negative. It was above all the (20/50/100/200) EMAs on the daily time frame, opening at 25,514.60, rising to the day’s high of 25,548.70, and ending at 25,476.10. The BSE Sensex opened at 83,625.89 and closed at 83,536.08, down by 176.43 points, or 0.21%. With the Nifty 50 RSI at 60.61 and the BSE Sensex RSI at 59.82 (far below the overbought threshold of 70), both indexes were trading above all four EMAs (20/50/100/200).
The Indian equity markets closed lower and remained choppy in the overall trading session on Wednesday due to the upcoming earnings season, tariffs, and the expected trade deal announcements between India and the US. Further, the selling pressures seen in IT, metal, and oil & gas stocks dragged down the benchmark indices. The Nifty FMCG index rose 442.2 points, or 0.8%, to close at 55,946, with gains of over 6% by Emami Ltd., followed by Dabur India, and Varun Beverages surged more than 1.5%. Conversely, the Nifty Realty index closed at 967.75, down -14.6 points, or -1.49%.
The Nifty Realty Index was dragged by stocks such as Brigade Enterprises and Phoenix Mills Ltd., which fell more than 3.5% and Raymond Realty fell by 3.2%. Furthermore, the Nifty Metal Index ended the day at 9,384.5, down -132.9 points, or -1.4%. On Wednesday, stocks of companies including Vedanta, Hindustan Copper, and Hindustan Zinc dropped by 3%; this is due to higher tariffs on copper imports announced by Trump.
On Wednesday, Asian markets closed on a mixed note. The South Korean Kospi index increased by 0.6%, or 18.79 points, to end at 3,133.74, while the Hong Kong Hang Seng index decreased by 1.06%, or 255.75 points, to conclude at 23,892.32. At 39,821.28, Japan’s Nikkei 225 surged up by 132.47 points, or 0.33%. At 3,473.13, the Shanghai index closed the day down by 4.43 points, or 0.13%. The US Dow Jones Futures on Wednesday was trading at 44,336.59, up 95.83 points, or 0.22%, at 4:36 PM.
Trade Setup Summary:
The Nifty 50 opened in red on Wednesday but was volatile in the morning session, but rebounded from its day’s low later in the afternoon session, and closed on a negative note at 25,476.10, peaking at 25,514.60. A break below 25,443.60 could trigger further selling towards 25,421.05, while a break above 25,504.60 could trigger bullishness towards 25,549.20.
Bank Nifty opened on a similar trend, opening in red and ending at 57,213.55, above the 57,000 mark. A break below 57,062.20 could trigger further selling towards 56,860, while a break above 57,279.60 could trigger bullishness towards 57,414.75.
Sensex opened on a similar trend, opening on a negative note, and ended above the 83,500 level at 83,536.08. A break below 83,436.96 could trigger further selling towards 83,318.08, while breaking the next resistance level of 83,602.24 could lead towards the 83,727.52 level.
Given the ongoing volatility and mixed sentiments, it’s advisable to avoid aggressive positions and wait for clear directional moves above resistance or below support. Traders should consider these key support and resistance levels when entering long or short positions following the price break from these critical levels. Additionally, traders can combine moving averages to identify more accurate entry and exit points.
Disclaimer

The views and investment tips expressed by investment experts/broking houses/rating agencies on tradebrains.in are their own, and not that of the website or its management. Investing in equities poses a risk of financial losses. Investors must therefore exercise due caution while investing or trading in stocks. Trade Brains Technologies Private Limited or the author are not liable for any losses caused as a result of the decision based on this article. Please consult your investment advisor before investing.
About: Trade Brains Portal is a stock analysis platform. Its trade name is Dailyraven Technologies Private Limited, and its SEBI-registered research analyst registration number is INH000015729.
Investments in securities are subject to market risks. Read all the related documents carefully before investing.
Registration granted by SEBI and certification from NISM in no way guarantee performance of the intermediary or provide any assurance of returns to investors.
