
On Friday, the Indian stock market witnessed a broad-based decline. The Nifty 50 and BSE Sensex both closed lower, reflecting bearish sentiment throughout the session. Most sectoral indices ended in the red, with the IT and Media indices among the top losers due to weak earnings and broader market concerns. However, the Pharma index bucked the trend and posted gains, led by a significant rally in Glenmark Pharmaceuticals after a favourable licensing agreement.
The market sentiment heading into the next trading session appears cautious and slightly bearish. With the Nifty 50 and Sensex closing below key short-term moving averages (like the 20-day EMA) and RSI indicators slipping toward neutral territory, there are signs of weakening momentum. Global market cues were mixed. While some Asian indices showed moderate gains,

others ended flat or slightly negative. US market sentiment was also weak, contributing to the overall cautious tone. Investor sentiment remained subdued due to disappointing early earnings reports and fresh tariff-related concerns. In this overview, we will analyse the key technical levels and trend directions for Nifty and BSE Sensex to monitor in the upcoming trading sessions. All the charts mentioned below are based on the 5-minute timeframe.
Nifty 50
(In this analysis, we have used 20/50/100/200 EMAs, where 20 EMA (Red), 50 EMA (Orange), 100 EMA (Light Blue), and 200 EMA (Dark Blue)).
To view other technical reports, click here
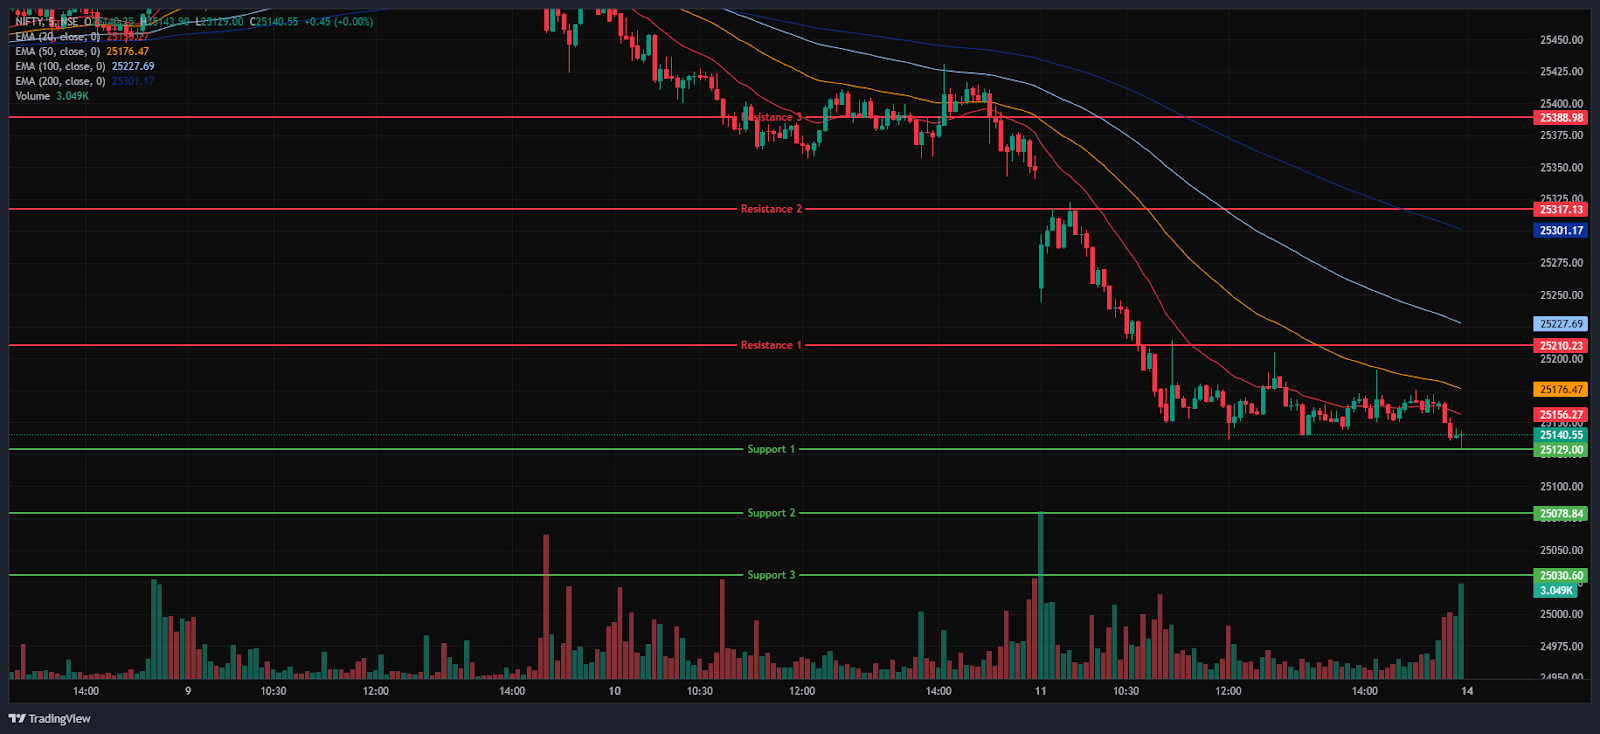
The Nifty 50 Index opened in red at 25,255.50 on Friday, down -99.75 points from Thursday’s closing of 25,355.25. The Nifty Index was volatile and was trading in the range of 25,100 and 25,300 in the morning session. It was trading below its opening level at 25,185 and was below all four 20/50/100/200 EMAs in the 15-minute time frame in the morning session. In the afternoon session, the Nifty Index was consolidated and sustained at the 25,150 level, losing its momentum, and made a day’s low of 25,129 in the afternoon session and closed in red at 25,149.85. During the afternoon session, it closed below all four EMAs (20/50/100/200 EMAs) in the 15-minute time frame in the afternoon session.
Nifty’s immediate resistance levels are R1 (25,210.23), R2 (25,317.13), and R3 (25,388.98), while immediate support levels are S1 (25,129), S2 (25,078.84), and S3 (25,030.60). The Nifty index had reached a day’s high at 25,322.45, closed in red below the 25,150 level, and saw a day’s low at 25,129. It had closed below the opening level at 25,149.85, losing -205.40 points or -0.81%. The Relative Strength Index (RSI) stood at 48.75 (below the overbought zone of 70) in the daily time frame, and Nifty 50 closed above the three 50/100/200 EMAs and remained only below the 20 EMA in the daily time frame.
Bank Nifty
(In this analysis, we have used 20/50/100/200 EMAs, where 20 EMA (Red), 50 EMA (Orange), 100 EMA (Light Blue), and 200 EMA (Dark Blue)).
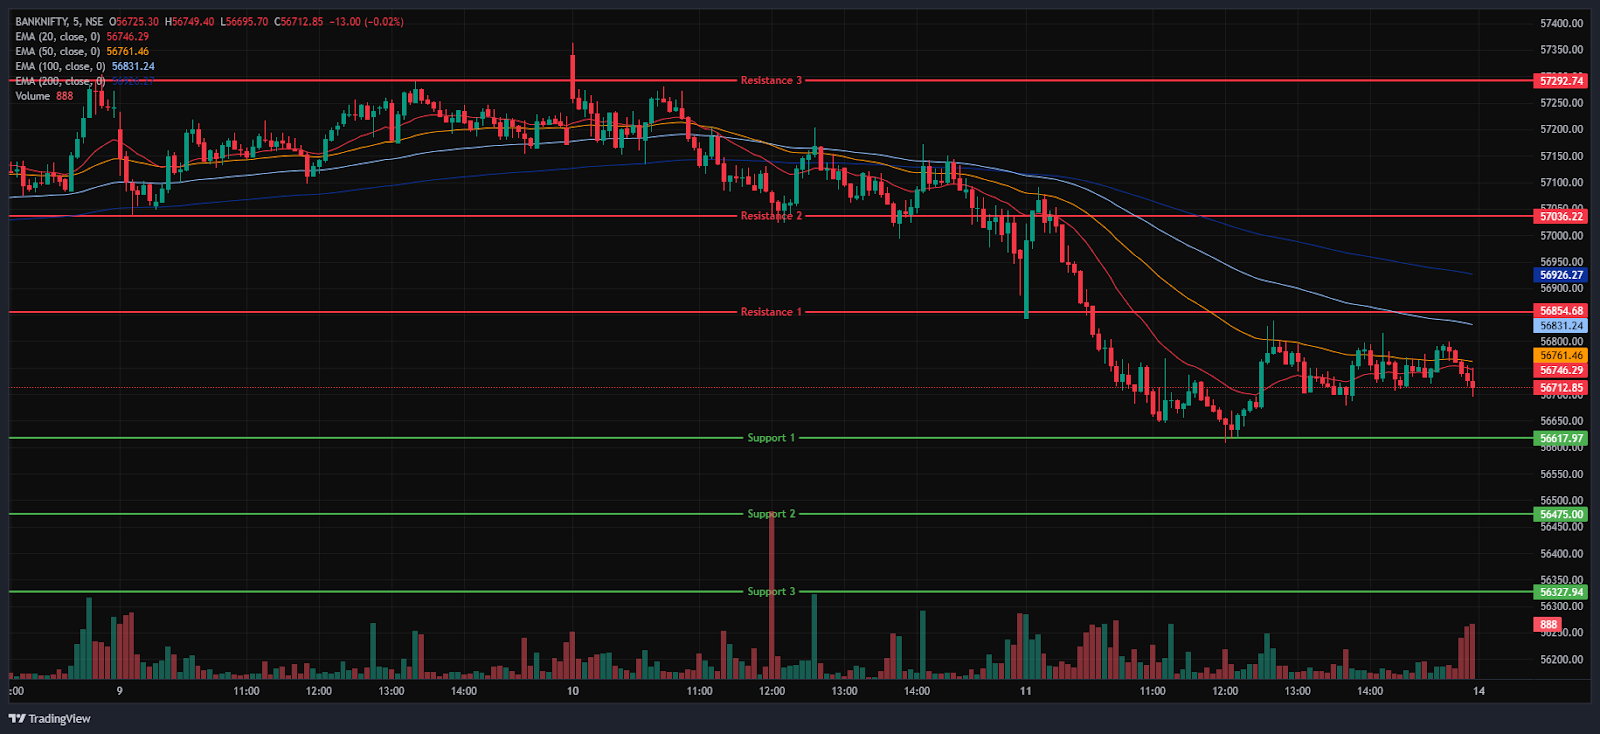
The Bank Nifty Index also followed a similar trend as the Nifty 50, opening at 56,843.45 on Friday, down by -112.55 points from Thursday’s closing of 56,956. It was trading between the range of 57,100 to 56,600 levels in the morning session and broke the 56,700 level below and dragged down and made its day’s low of 56,607.75 and was below all four of the 20/50/100/200 EMAs in the 15-minute time frame. In the afternoon session, the Bank Nifty rebounded above the 56,700 level and closed at 56,754.70. During the afternoon session, it closed below all four EMAs of 20/50/100/200 in a 15-minute time frame in the afternoon session.
Bank Nifty immediate resistance levels are R1 (56,854.68), R2 (57,036.22), and R3 (57,292.74), while immediate support levels are S1 (56,617.97), S2 (56,475), and S3 (56,327.94). The Bank Nifty index had peaked at 57,091.05 and made a day’s low at 56,607.75. Finally, it had closed in red at 56,754.70, losing -201.30 points or -0.35%. The Relative Strength Index (RSI) stood at 53.27 (below the overbought zone of 70) in the daily time frame, and Bank Nifty was above the four 20/50/100/200 EMAs in the daily time frame.
Sensex
(In this analysis, we have used 20/50/100/200 EMAs, where 20 EMA (Red), 50 EMA (Orange), 100 EMA (Light Blue), and 200 EMA (Dark Blue)).
To view other technical reports, click here
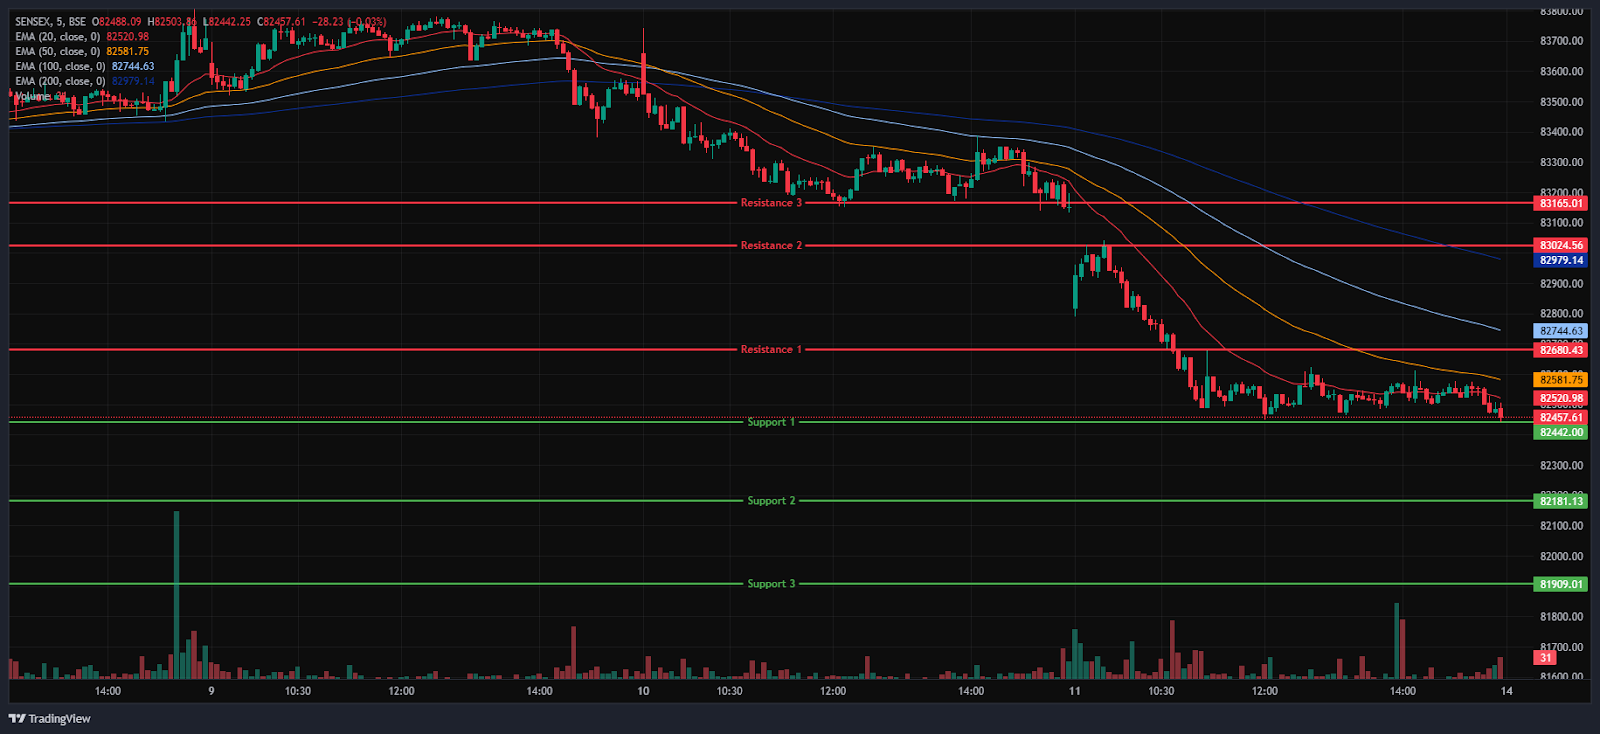
The BSE Sensex Index followed the same trend, opening on a negative note at 82,820.76 on Friday, down by -369.52 points from Thursday’s closing of 83,190.28. The Index was volatile in the morning session and was trading in the range of 82,500 and 83,000. It was consolidating near the opening level of 82,599.53 and was trading below all four 20/50/100/200 EMAs in the 15-minute time frame in the morning session.
In the afternoon session, the Sensex Index consolidated and broke below the 82,500 mark, slightly bounced back from its day’s low of 82,442.25 and closed in red at 82,500.47. During the afternoon session, it traded below all four EMAs of 20/50/100/200 in the 15-minute time frame in the afternoon session. BSE Sensex immediate resistance levels are R1 (82,680.43), R2 (83,024.56), and R3 (83,165.01), while immediate support levels are S1 (82,442), S2 (82,181.13), and S3 (81,909.01).
The BSE Sensex index had peaked at 83,040.74 and finally, it had closed at 82,500.47, down by -689.81 points or -0.83%. The Relative Strength Index (RSI) stood at 48.60 (below the overbought zone of 70) in the daily time frame, and the BSE Sensex was above the three 50/100/200 EMAs and remained only below the 20 EMA in the daily time frame.
India VIX
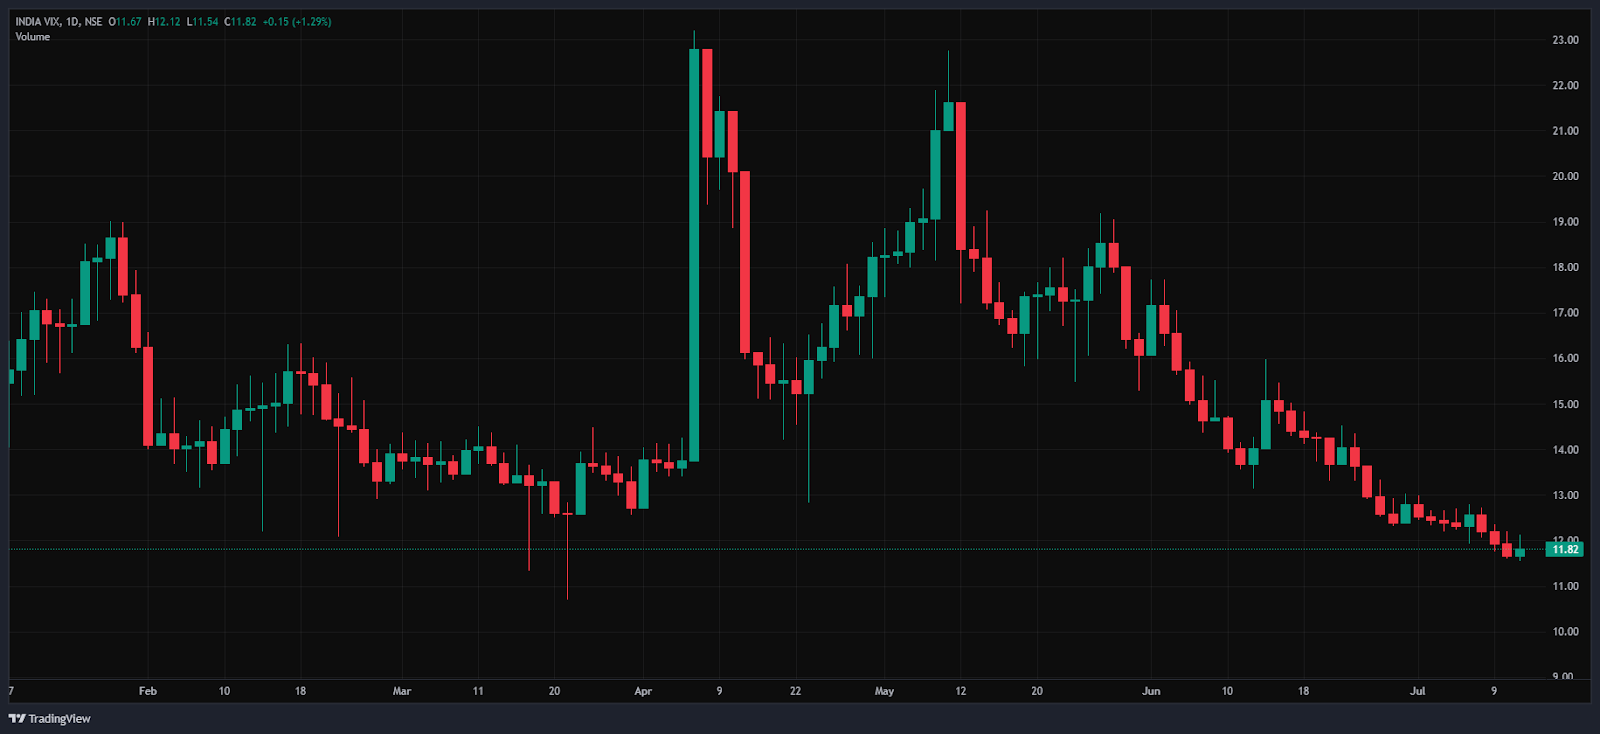
The India VIX increased from 11.67 to 11.82 on Friday, up by 0.15 points or 1.24%. The wide increase in the VIX index shows increased fear and uncertainty.
Market Recap 11th July 2025
The Nifty began Friday’s trading session at 25,255.50, lower than its previous closing of 25,355.25, indicating a pessimistic outlook. It closed at 25,149.85 below the 20-day EMA after hitting the day’s low of 25,129.00. The Nifty 50 was down 205.40 points, or 0.81%, at the close of the day. The BSE Sensex fell -689.81 points, or -0.83%, from its opening price of 82,820.76 to its closing price of 82,500.47, following the same pattern. The Nifty closed Friday above the 50/100/200 EMAs, while the Nifty 50 RSI fell to a monthly low of 48.75.
Furthermore, the Sensex fell below the 20-day EMA but closed above the 50/100/200 EMAs, while the BSE Sensex RSI closed at 48.59, significantly below the overbought level of 70. On Friday, the India VIX rose 11.82. This decline was caused by a number of factors, including poor first-quarter earnings and US trade worries after imposing a 35% tax on Canada.
Friday saw a fall in all of the main indexes. One of the worst losers was the Nifty IT index, which ended the day at 37,693.25, down -683.40 points, or -1.78%. The index fell more than 1% on Friday, with TCS, Wipro, LTI Mindtree, and Oracle Financial Services among the top losses. TCS’s poor Q1 performance has caused a 3.43% decline. One of the worst declines was the Nifty Media index, which ended Friday at 1,704.30, down -1.60% or -27.80 points. Dish TV India, Zee Entertainment, PVR Inox, and Saregama India were among the index’s biggest losses, having dropped more than 2% on Friday.
Despite this, the Nifty Pharma index gained 149.10 points, or 0.68%, to close the day at 22,225.90. With gains of more than 1%, Glenmark Pharmaceuticals, Alkem Laboratories, and Ajanta Pharma led the industry.Glenmark Pharmaceuticals saw a 14.55% increase on Friday following the news that its subsidiary, IGI Therapeutics SA & AbbVie, obtained an exclusive global licensing agreement for the cancer and autoimmune medication ISB 2001.
On Friday, however, Asian markets responded in a rather optimistic manner. The South Korean Kospi index fell -0.23%, or -7.46 points, to close at 3,175.77, while the Hong Kong Hang Seng index increased 0.46%, or 111.20 points, to conclude at 24,139.57. At 39,569.68, Japan’s Nikkei 225 closed the day down -76.68 points, or -0.19%. The Thailand SET composite closed at 1,121.13, up 10.73 points, or 0.96%.
The Indonesian Jakarta Composite closed at 7,047.44 points, up 42.07 points, or 0.60%. The Shanghai index gained 0.50 points, or 0.01%, but closed the day level at 3,510.18. The US Dow Jones Futures was trading at 44,399.43, down 251.21 points, or -0.56% at 5:02 pm. This week, the Nifty 50 index fell 1.22%. Numerous causes, including the disappointing start to the earnings season, growing fears about tariffs, and investors’ diminished risk appetite, are to blame for this decrease.
Trade Setup Summary
The Nifty 50 opened in red on Friday but was volatile in the morning session, rebounded slightly from its day’s low later in the afternoon session, and closed on a negative note at 25,149.85, peaking at 25,322.45. A break below 25,129 could trigger further selling towards 25,078.84, while a break above 25,210.23 could trigger bullishness towards 25,317.13.
Bank Nifty opened on a similar trend, opening in red and ending at 56,754.70, below the 56,800 mark. A break below 56,617.97 could trigger further selling towards 56,475, while a break above 56,854.68 could trigger bullishness towards 57,036.22.
Sensex opened on a similar trend, opening on a negative note, and ended at 82,500.47. A break below 82,442 could trigger further selling towards 82,181.13, while breaking the next resistance level of 82,680.43 could lead towards the 83,024.56 level.
Given the ongoing volatility and mixed sentiments, it’s advisable to avoid aggressive positions and wait for clear directional moves above resistance or below support. Traders should consider these key support and resistance levels when entering long or short positions following the price break from these critical levels. Additionally, traders can combine moving averages to identify more accurate entry and exit points.
Disclaimer

The views and investment tips expressed by investment experts/broking houses/rating agencies on tradebrains.in are their own, and not that of the website or its management. Investing in equities poses a risk of financial losses. Investors must therefore exercise due caution while investing or trading in stocks. Trade Brains Technologies Private Limited or the author are not liable for any losses caused as a result of the decision based on this article. Please consult your investment advisor before investing.
About: Trade Brains Portal is a stock analysis platform. Its trade name is Dailyraven Technologies Private Limited, and its SEBI-registered research analyst registration number is INH000015729.
Investments in securities are subject to market risks. Read all the related documents carefully before investing.
Registration granted by SEBI and certification from NISM in no way guarantee performance of the intermediary or provide any assurance of returns to investors.
