On Friday, the market showed a broadly negative reaction. The Nifty 50 and Sensex both extended their declines for a second consecutive session, closing below key technical levels, including their respective 20-day EMAs. Sentiment was weighed down by weak IT earnings, concerns over global trade disruptions, and caution ahead of the earnings season.
Most sectoral indices ended in the red, with notable weakness in private banks and consumer durables due to profit booking and mixed earnings. However, a few sectors like media and metals showed resilience, closing higher on the back of gains in select stocks. Overall, the broader market reflected nervousness and cautious investor sentiment, driven by earnings-related concerns and global trade uncertainties.
In this overview, we will analyse the key technical levels and trend directions for Nifty and BSE Sensex to monitor in the upcoming trading sessions. All the charts mentioned below are based on the 5-minute timeframe.
Nifty 50
(In this analysis, we have used 20/50/100/200 EMAs, where 20 EMA (Red), 50 EMA (Orange), 100 EMA (Light Blue), and 200 EMA (Dark Blue)).
To view other technical reports, click here
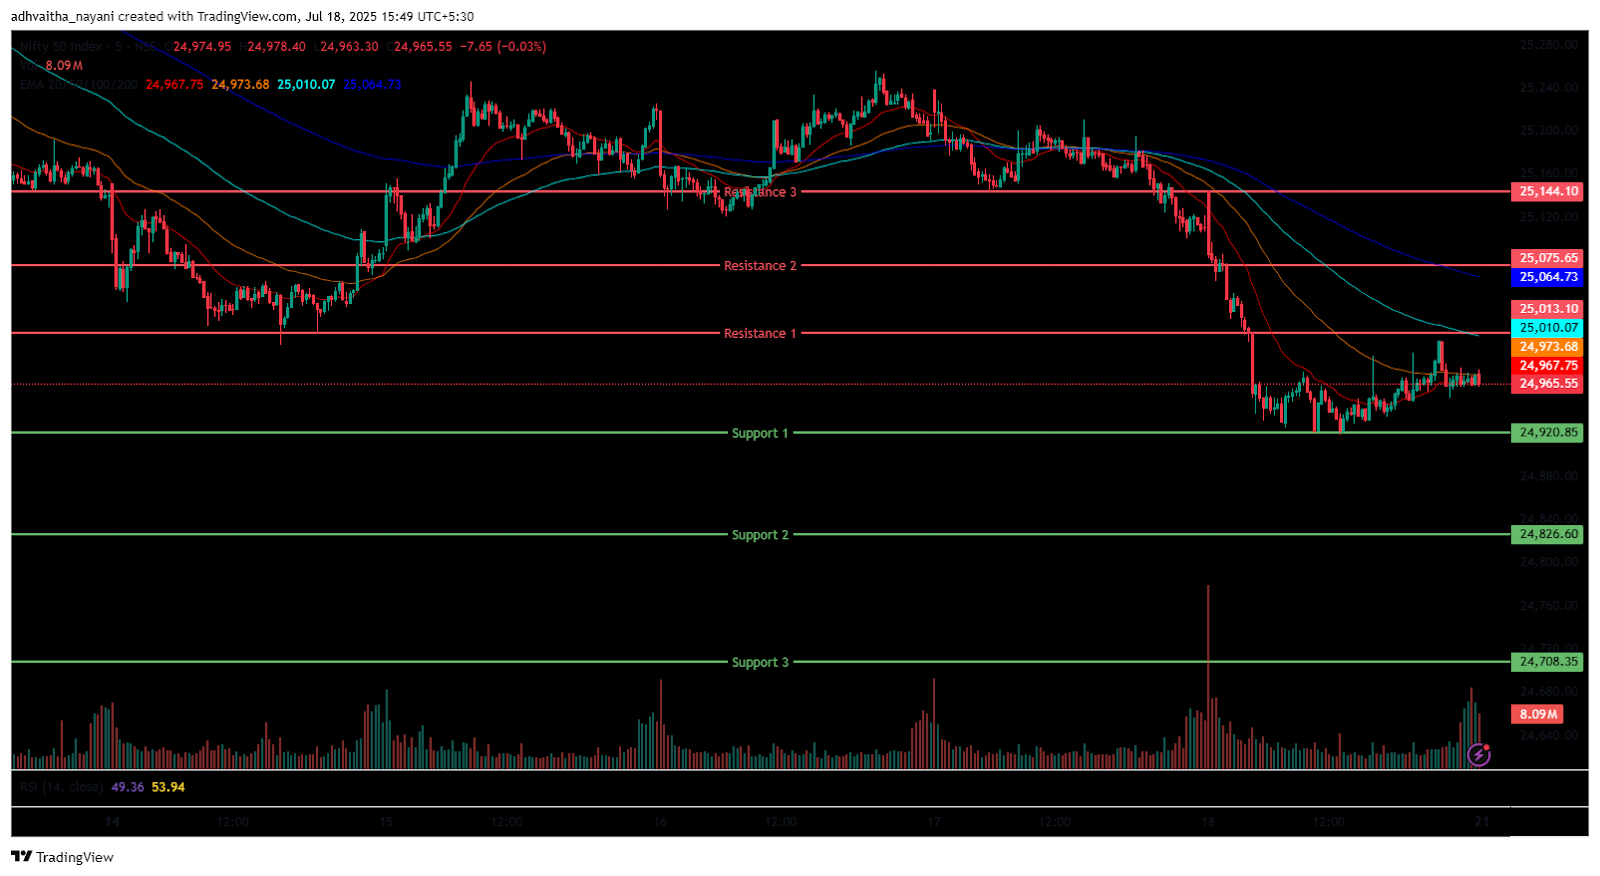
The Nifty 50 Index opened on a negative note at 25,108.55 on Friday, down by 2.9 points from Thursday’s closing of 25,111.45. The Nifty Index was volatile and was trading in the range of 25,150 to 24,900 in the morning session. It was trading below its opening level at 24,936 and was below all four of the 20/50/100/200 EMAs in the 15-minute time frame and made the day’s low at 24,918.65 in the morning session.
In the afternoon session, the Nifty Index sustained and consolidated at the 24,900 level and bounced back from the day’s low to close at 24,968.40 in red. During the afternoon session, it closed below all four EMAs of 20/50/100/200 in the 15-minute time frame in the afternoon session. Nifty’s immediate resistance levels are R1 (25,013), R2 (25,076), and R3 (25,144), while immediate support levels are S1 (24,921), S2 (24,827), and S3 (24,708).
The Nifty index had reached a day’s high at 25,144.60, closed in red below the 25,000 level, and saw a day’s low at 24,918.65. Finally, it had closed below the opening level at 24,968.40, losing -143.05 points or -0.57%. The Relative Strength Index (RSI) stood at 43.07 (below the overbought zone of 70) in the daily time frame, and Nifty 50 closed above the three 50/100/200 EMAs and remained only below the 20 EMA in the daily time frame.
Bank Nifty
(In this analysis, we have used 20/50/100/200 EMAs, where 20 EMA (Red), 50 EMA (Orange), 100 EMA (Light Blue), and 200 EMA (Dark Blue)).
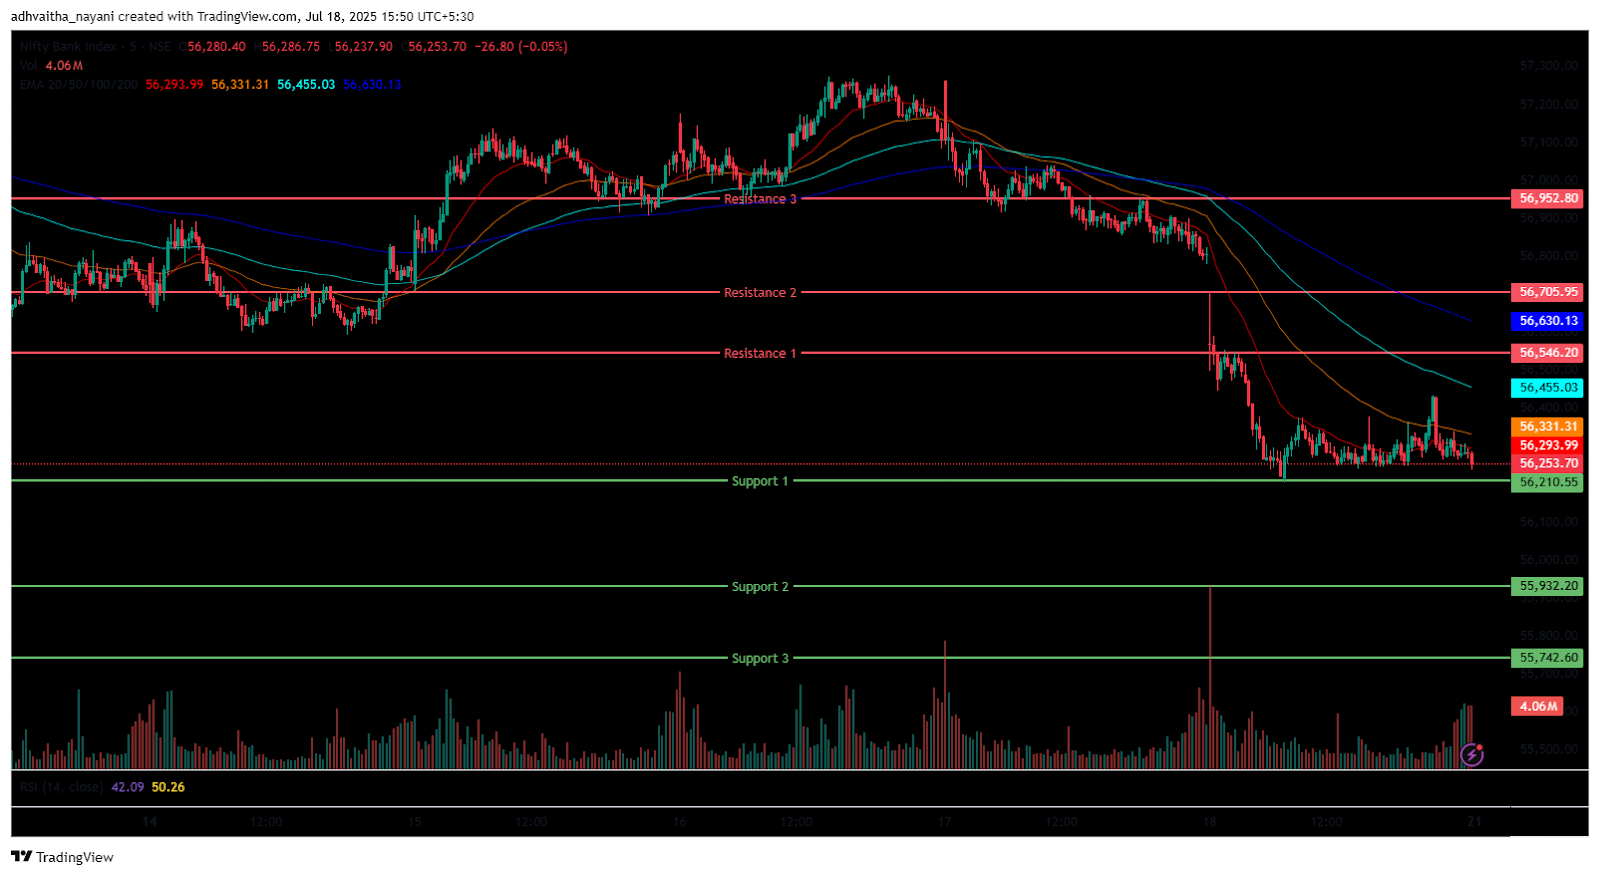
The Bank Nifty Index started the session on a gap down (negative note) at 56,524.25 on Friday, down by -304.55 points from Thursday’s closing of 56,828.80. In the morning session, it was trading between the range of 56,700 to 56,200 levels and broke the 56,300 level below and was below all four of the 20/50/100/200 EMAs in the 15-minute time frame and made the day’s low at 56,204.85 in the morning session.
In the afternoon session, the Bank Nifty sustained above the 56,200 level and closed slightly above the day’s low at 56,283.00 in red. During the afternoon session, it closed below all 20/50/100/200 EMA in a 15-minute time frame in the afternoon session. Bank Nifty immediate resistance levels are R1 (56,546), R2 (56,706), and R3 (56,953), while immediate support levels are S1 (56,211), S2 (55,932), and S3 (55,742).
The Bank Nifty index had peaked at 56,705.15 and made a day’s low at 56,204.85. Finally, it had closed in red at 56,283.00, losing -545.80 points or 0.96%. The Relative Strength Index (RSI) stood at 45.3 (below the overbought zone of 70) in the daily time frame, and Bank Nifty was above the 50/100/200 EMAs but remained below the 20 EMA in the daily time frame.
Sensex
(In this analysis, we have used 20/50/100/200 EMAs, where 20 EMA (Red), 50 EMA (Orange), 100 EMA (Light Blue), and 200 EMA (Dark Blue)).
To view other technical reports, click here
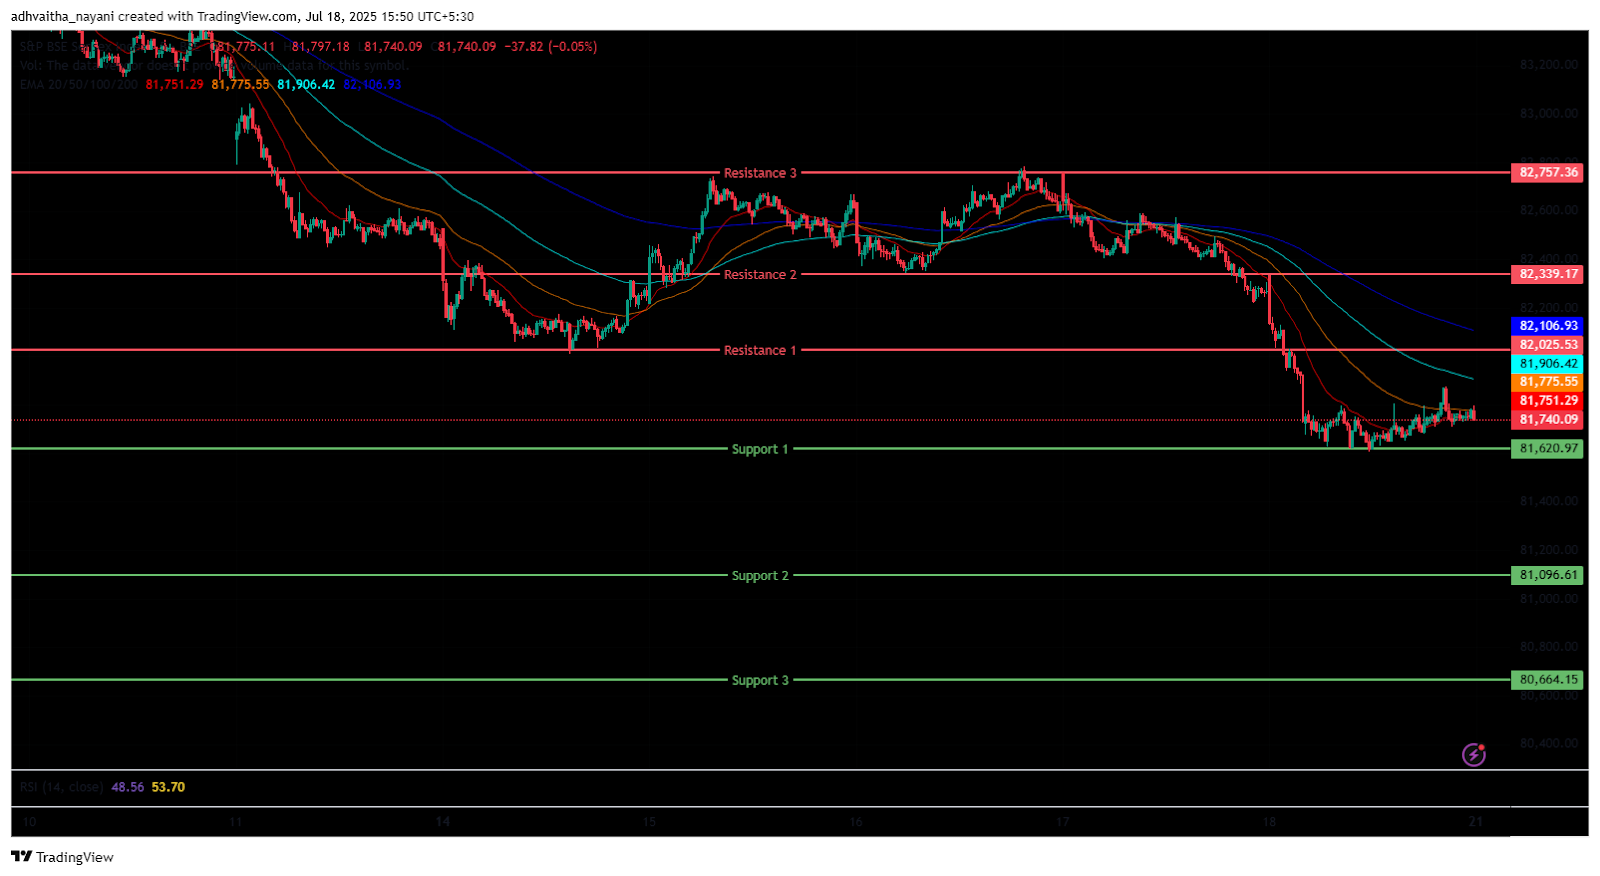
The BSE Sensex Index followed a similar trend as the Nifty 50, opening on a negative note at 82,193.62 on Friday, down by -65.62 points from Thursday’s closing of 82,259.24. The Index was volatile in the morning session and was dragged down, trading in the range of 82,300 to 81,600 levels. It was closed below the opening level at 81,666 and was trading below all the 20/50/100/200 EMAs in the 15-minute time frame and made a day’s low at 81,608.13 in the morning session.
In the afternoon session, the Sensex Index sustained above the 81,600 level and closed above the day’s low at 81,757.73 in red. During the afternoon session, it traded below all the EMAs of 20/50/100/200 in the 15-minute time frame in the afternoon session. BSE Sensex immediate resistance levels are R1 (82,026), R2 (82,339), and R3 (82,757), while immediate support levels are S1 (81,621), S2 (81,097), and S3 (80,664).
The BSE Sensex index had peaked at 82,334.75 and made a day’s low at 81,608.13. Finally, it had closed at 81,757.73, down by -502.52 points or -0.61%. The Relative Strength Index (RSI) stood at 41.81 (below the overbought zone of 70) in the daily time frame, and the BSE Sensex was above the 100/200 EMAs and remained below the 20/50 EMA in the daily time frame.
India VIX
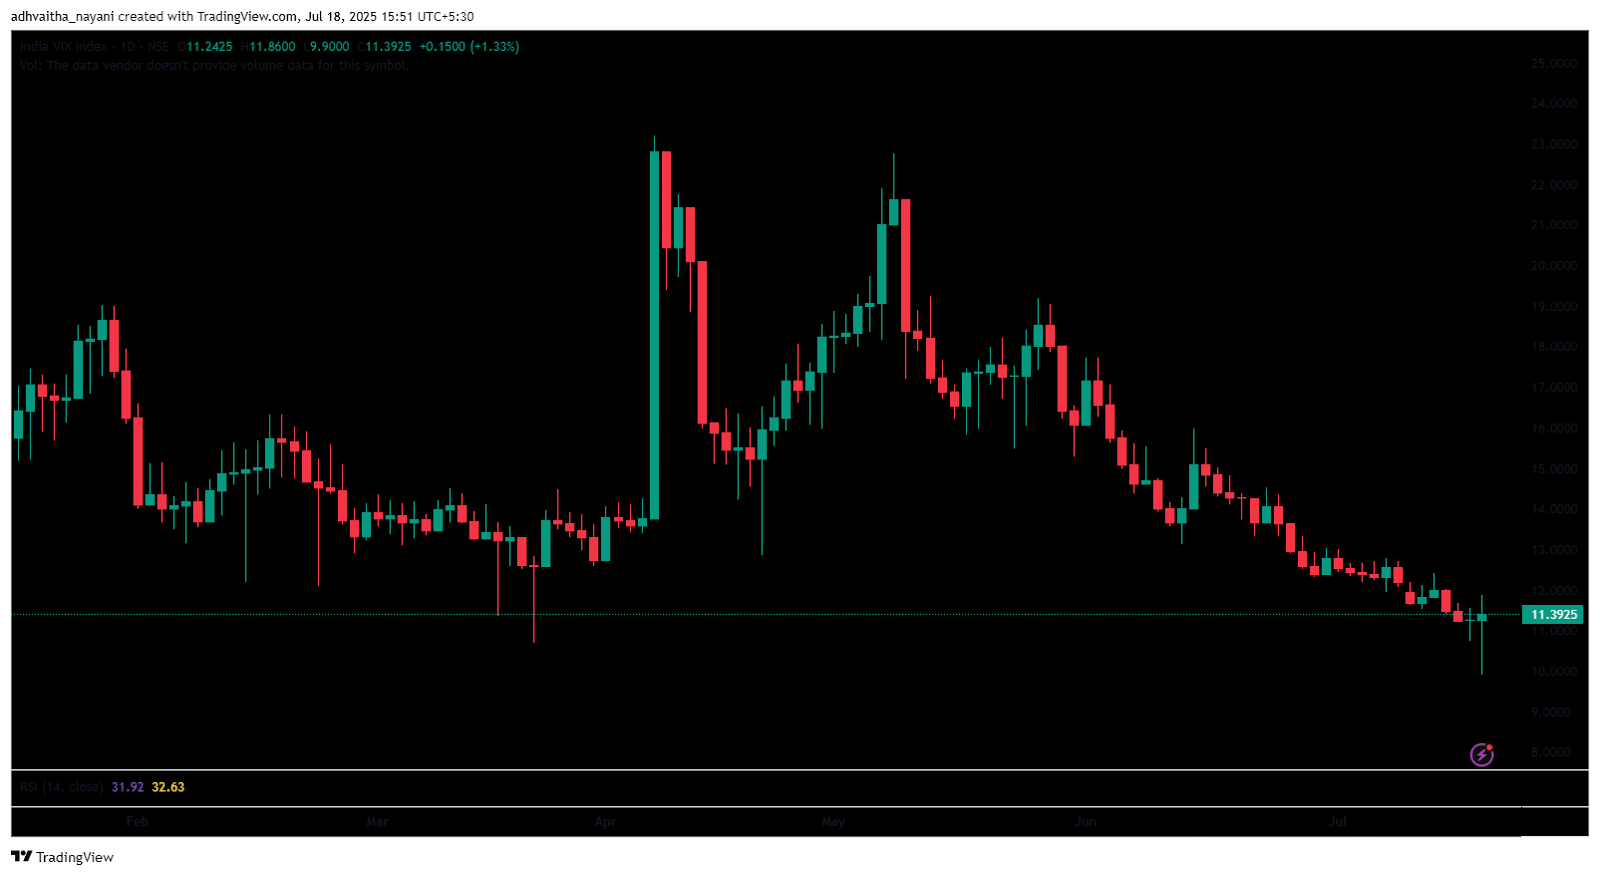
On Friday’s session, the India VIX increased from 11.24 to 11.39, up by 0.15 points or 1.33%. The increase in the VIX index shows increased fear and uncertainty.
Market Recap 18th July 2025
The Nifty 50 opened Friday at 25,108.5, flat from the previous day’s closing price of 25,108.5. On Friday saw the Nifty index fall -143.05 points, or -0.57%, for the second straight session. It closed at 24,968.4 after hitting a day’s low of 24,918.6. The RSI stood at 43, far below the 70-point overbought zone, and the Nifty closed below the 20-day EMA and breached the 25,000 level. Additionally, the Sensex closed the day lower than the 20-day EMA, down -501.51 points, or -0.61%, at 81,757.7, with an RSI of 42 on the daily chart. Subdued IT results, concerns about interruptions to global trade, and a careful approach ahead of quarterly reporting all contributed to Friday’s decline.
Few sector indices saw gains on Friday, while the majority were down. The Nifty Media Index, which closed the day at 1,771, up 16.8 points, or 0.96%, was one of the biggest gainers. Among the stocks that helped the index rise were Saregama India, which saw a 4.6% increase; PVR Inox, which saw a 4.4% increase; and Dish TV India, which saw a 1.2% increase on Friday. At 9,458.2, the Nifty Metal Index likewise closed higher by 34.85 points, or 0.37%. The index’s largest gainer, NMDC Ltd, increased 2.7%, while SAIL followed with a 2.13% increase.
The Nifty Private Bank Index, on the other hand, ended the day at 27,534, down -1.46%, or -408.85 points. The index was dragged down by heavyweights including Axis Bank, RBL Bank, and HDFC Bank; Axis Bank was the biggest loser, dropping 5.2%. Profit booking was the primary cause of the Nifty Consumer Durables Index’s significant decline, which saw it close at 38,630, down -368.90 points, or -0.95%. The weak and inconsistent quarterly earnings reports from the banking and IT sectors made investors nervous, which caused the indices to fall.
Asian markets showed a mixed trend on Friday. The Hang Seng of Hong Kong increased by 326.71 points, or 1.32%, to 24,825.66. At 3,188.07 at the close of the day, South Korea’s Kospi fell 4.22 points, or 0.13%. Shanghai’s Composite Index concluded the day up 17.65 points, or 0.50%, to close at 3,534.48, while Japan’s Nikkei 225 closed at 39,819.11, down 0.2%, or -82.08 points. At 5:00 p.m., Dow Jones Futures were up 68.7 points, or 0.15%, on the US stock exchange, trading at 44,551.21.
The Nifty 50 Index declined by -0.72%, and the BSE Sensex dropped by -0.9% this week. Major reasons, such as the subdued start of earnings season, US-India trade deal concerns, and the cautious approach of investors, caused the index to fall.
Trade Setup Summary
The Nifty 50 opened on a negative note on Friday, was more volatile in the morning session, and was dragged down and closed at 24,968, broke below the 25,000 level. A break below 24,921 could trigger further selling towards 24,827, while a break above 25,013 could trigger bullishness towards 25,076.
Bank Nifty started the session on a gap down at 56,524.25 and ended in red at 56,283.00, breaking below the 56,300 mark. A break below 56,211 could trigger further selling towards 55,932, while a break above 56,546 could trigger bullishness towards 56,706. Sensex opened on a similar trend, opening on a negative note at 82,193.62 and ending at 81,757.73. A break below 81,621 could trigger further selling towards 81,097, while breaking the next resistance level of 82,026 could lead towards the 82,339 level.
Given the ongoing volatility and mixed sentiments, it’s advisable to avoid aggressive positions and wait for clear directional moves above resistance or below support. Traders should consider these key support and resistance levels when entering long or short positions following the price break from these critical levels. Additionally, traders can combine moving averages to identify more accurate entry and exit points.
Disclaimer

The views and investment tips expressed by investment experts/broking houses/rating agencies on tradebrains.in are their own, and not that of the website or its management. Investing in equities poses a risk of financial losses. Investors must therefore exercise due caution while investing or trading in stocks. Trade Brains Technologies Private Limited or the author are not liable for any losses caused as a result of the decision based on this article. Please consult your investment advisor before investing.
About: Trade Brains Portal is a stock analysis platform. Its trade name is Dailyraven Technologies Private Limited, and its SEBI-registered research analyst registration number is INH000015729.
Investments in securities are subject to market risks. Read all the related documents carefully before investing.
Registration granted by SEBI and certification from NISM in no way guarantee performance of the intermediary or provide any assurance of returns to investors.
