Bitcoin surged to $110,000 on June 11, marking a major milestone that has revitalised optimism across the cryptocurrency market. This latest rally has led many investors and analysts to anticipate a potential move toward new record highs in the near future.
As the crypto market is trading in a strong bull run, Bitcoin is currently at $109,500 in the last 24 hours at the time of writing. For the present price action, the total market cap of Bitcoin reached $2.17 trillion, with a 24-hour trading volume of $32.50 billion.
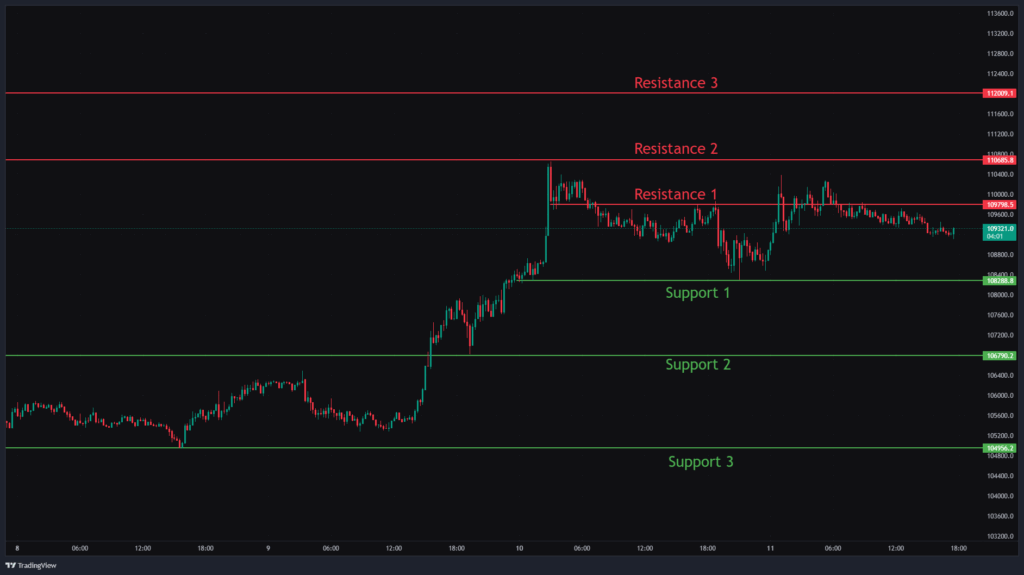
In this overview, we will analyse the key technical levels and trend directions for Bitcoin to monitor in the upcoming trading sessions. The chart mentioned below is based on the 15-minute timeframe.
Bitcoin Chart Analysis & BTCUSD Price Action.

Currently, Bitcoin is trading around $109,500 with a first level of support at $108,288. If the price manages to break this level, we can see a downfall to the next support at $106,790, and a decline in price below this level will push the price to fall to the price level at $104,956.
On the upside, we can see in the chart that the first level of resistance is at $109,798, followed by the next resistance at $110,685, and $112,009. If the price manages to break above the first level of resistance this level we can see an upside movement to the next level of resistance in the next trading sessions.
In Closing
Bitcoin is currently trading higher with a strong bullish momentum. If the price successfully breaks through these resistance levels, we can anticipate a stronger upward trend or a period of sideways movement in the upcoming trading sessions. However, if the resistance levels are not breached, the market may enter a bearish phase.
Traders should consider these key support and resistance levels to enter long or short positions following the price break from the key levels. Also, traders can combine moving averages for more accurate entry and exit points.


