

![]()
![]()
The cryptocurrency market is currently experiencing heightened volatility, especially with Bitcoin showing dramatic fluctuations. Bitcoin’s price is rising due to the recent truce in the Middle East, alongside ongoing dollar debasement, which continues to boost cryptocurrencies. The cease-fire between Iran and Israel has restored a risk-on sentiment among investors, with stock prices nearing record highs. Recently, Bitcoin’s price dipped below $98,000 but rebounded to over $107,000 within just 24 hours.

As the crypto market is in a strong uptrend, Bitcoin is currently at $107,052 with an upside of 2% in the last 24 hours at the time of writing. For the present price action, the total market cap of Bitcoin reached $2.12 trillion, with a 24-hour trading volume of $27.89 billion.

In this overview, we will analyse the key technical levels and trend directions for Bitcoin to monitor in the upcoming trading sessions. The chart mentioned below is based on the 15-minute timeframe.
Bitcoin Chart Analysis & BTCUSD Price Action.
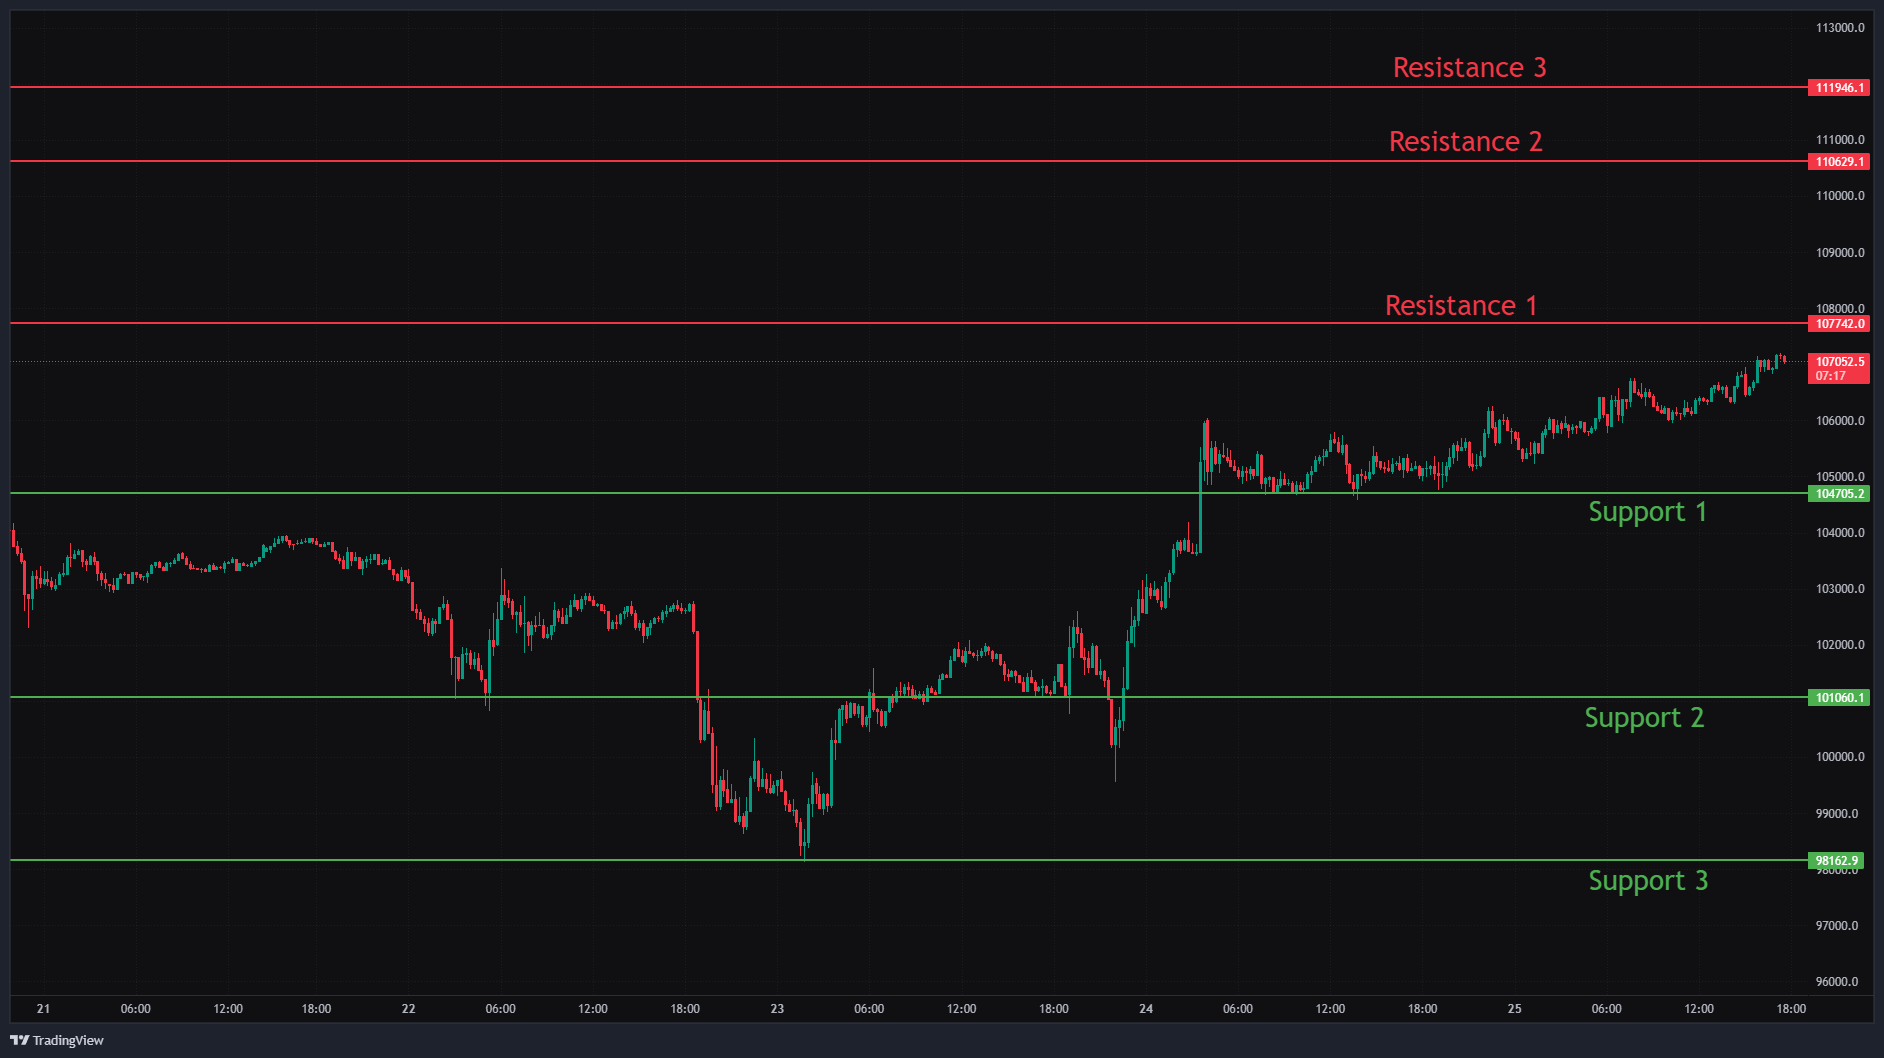
Bitcoin is currently trading at $107,052 with a strong upward momentum. The first key support level is at $104,705. If the price falls below this level, the next support is at $101,060. A further decline could lead Bitcoin to drop to $98,162. These support levels are crucial, as breaking below them could trigger increased selling pressure and momentum toward a downtrend.
On the upside, the first resistance level is at $107,742, followed by higher levels at $110,629 and $111,946, which is a level of all-time high. If Bitcoin breaks above the initial resistance, it could help the coin achieve further gains toward the next resistance zones in the upcoming trading sessions. Monitoring these resistance levels will be important for traders seeking signs of renewed bullish momentum.
In Closing
Bitcoin has recently transitioned from a downtrend into a strong uptrend, signalling a potential reversal. However, in the upcoming trading sessions, there is a significant chance of further downside if the price breaks through key support levels. Should this occur, we may witness a deeper correction. On the other hand, if Bitcoin fails to break below these support levels, it could lead to a period of sideways movement instead of a robust recovery.
Traders should closely monitor these critical support and resistance levels when planning long or short positions, as price action around these zones will be crucial in determining the next move. Given the current bearish sentiment, combining these levels with moving averages can help identify more precise entry and exit points, improving risk management in this volatile environment.
