

![]()
![]()
The MACD (Moving Average Convergence Divergence) is a technical analysis tool that shows the relationship between two moving averages of a stock’s price, typically the 12-day and 26-day EMAs. It consists of the MACD line, the Signal line, and a histogram, helping identify trends and momentum.

This part of the indicator shows how strong the price movement is and can give an early warning to prepare for a change. The higher or deeper the lines, the stronger the price movement.

When the lines are above the zero horizontal, the market can be said to be bullish, and when they are below, we are in bearish mode. A MACD crossover occurs when the MACD line crosses above (bullish) or below (bearish) the Signal line, signaling potential buy or sell opportunities based on trend changes.
List of Stocks with MACD Crossover to look out for
CEAT Ltd
CEAT Ltd is an Indian multinational tyre manufacturer, founded in 1924 in Italy and acquired by the RPG Group in 1982. It is a leading tyre producer in India, with a global presence in over 110 countries, and its products are used for various vehicles, including cars, two-wheelers, trucks, and tractors.
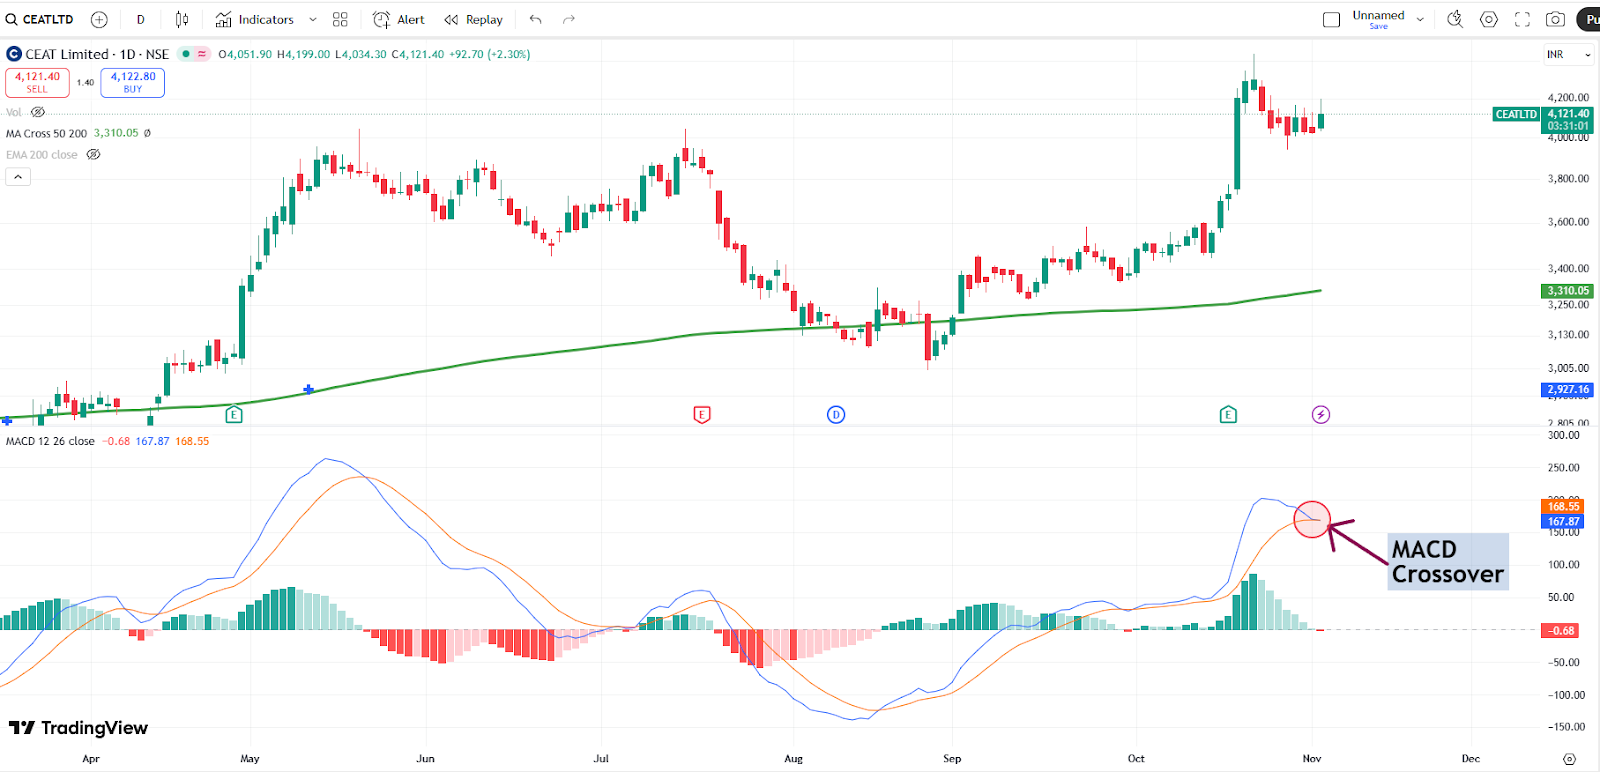
A bearish MACD crossover was seen in the CEAT as the MACD line crossed below the signal line, signaling potential downward momentum. This technical pattern is considered a sell signal and may indicate the start of a new downtrend, prompting traders to be cautious or consider exiting long positions.
Nestlé India Ltd
Nestlé India Ltd is the Indian subsidiary of the Swiss multinational company, Nestlé S.A. It is a public company that manufactures and sells a wide range of food and beverage products, including popular brands like Maggi, Nescafé, and KitKat. Founded in India in 1959, Nestlé India has grown into a significant food processing company with a focus on nutrition, health, and wellness.
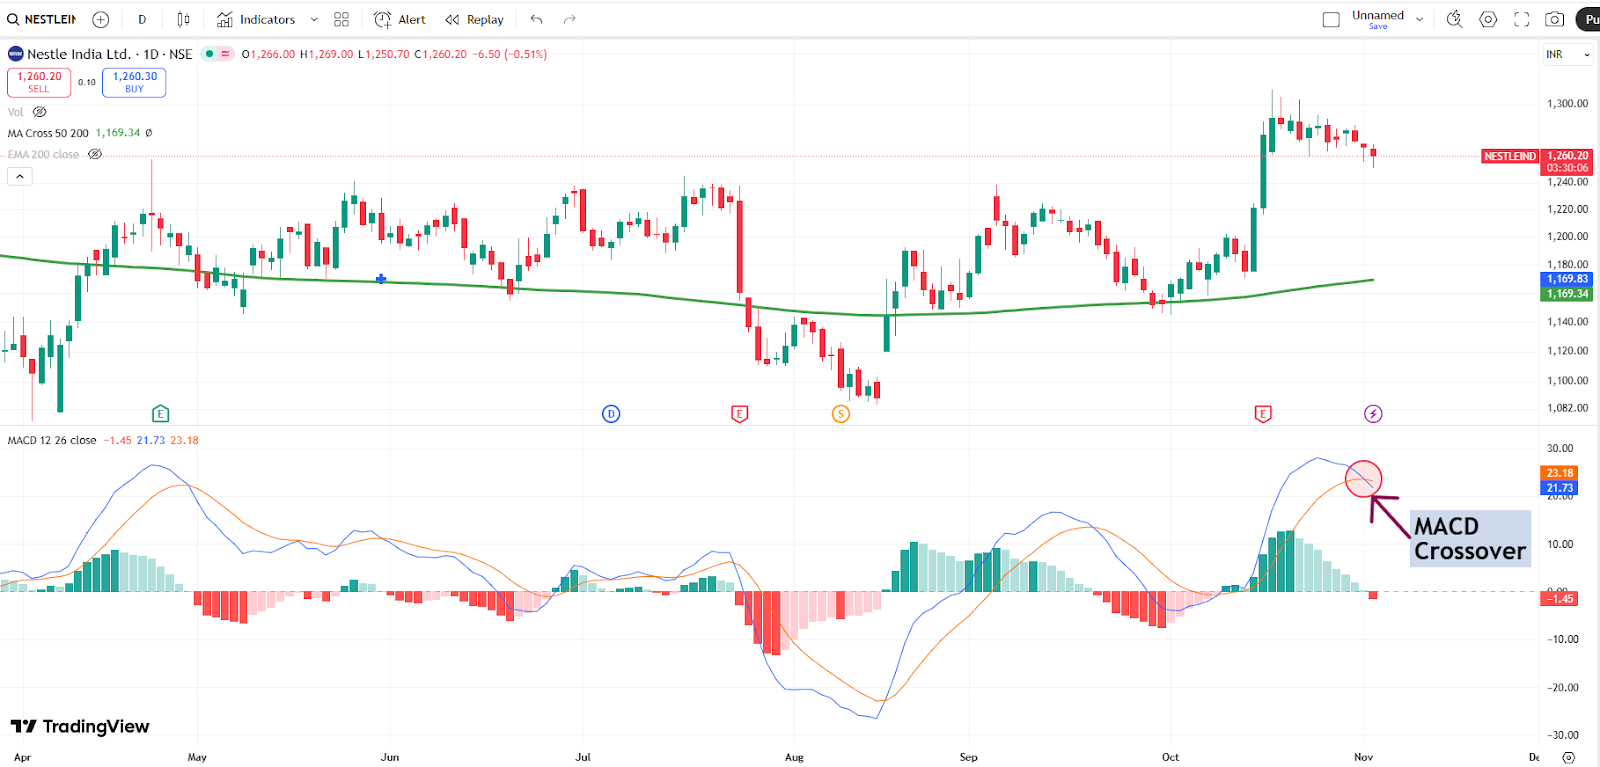
A bearish MACD crossover was seen in Nestlé India as the MACD line crossed below the signal line, signaling potential downward momentum. This technical pattern is considered a sell signal and may indicate the start of a new downtrend, prompting traders to be cautious or consider exiting long positions.
Marico Ltd
Marico Ltd is an Indian multinational consumer goods company focused on the beauty and wellness sectors, headquartered in Mumbai. It is a leading player with well-known brands like Parachute and Saffola, and has a presence in over 25 countries, primarily in Asia and Africa. The company’s product portfolio spans hair care, skin care, edible oils, healthy foods, and male grooming.
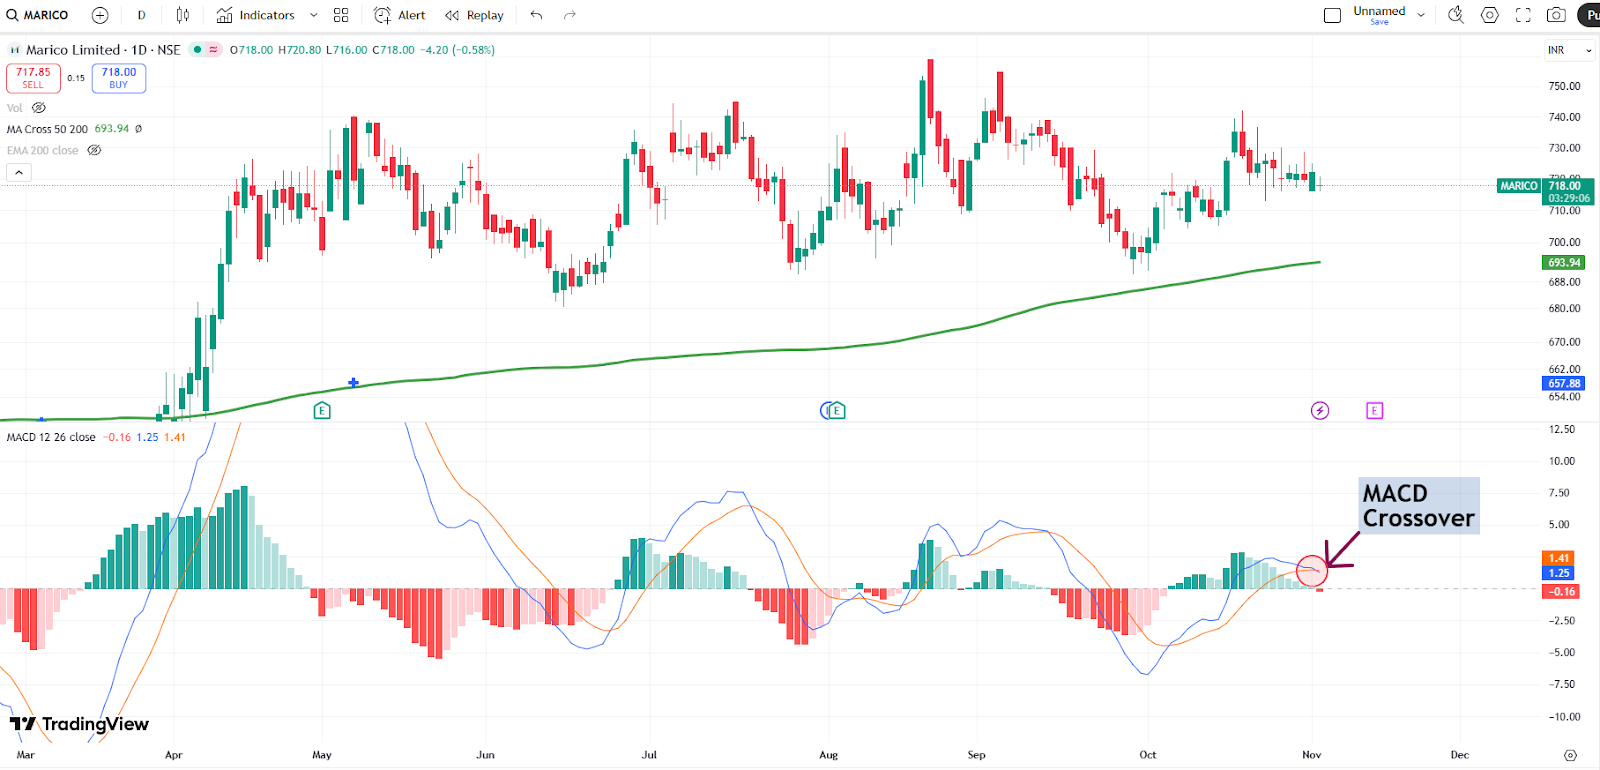
A bearish MACD crossover was seen in Marico as the MACD line crossed below the signal line, signaling potential downward momentum. This technical pattern is considered a sell signal and may indicate the start of a new downtrend, prompting traders to be cautious or consider exiting long positions.
Apar Industries Ltd
Apar Industries Ltd. is a diversified, billion-dollar Indian company founded in 1958 that operates in over 140 countries. It is a leading manufacturer of conductors, cables, and specialty oils, and also produces lubricants, polymers, and telecom solutions. The company is a major global player in its key segments, recognized as the world’s largest manufacturer of conductors and a significant producer of transformer oils and auto lubricants.
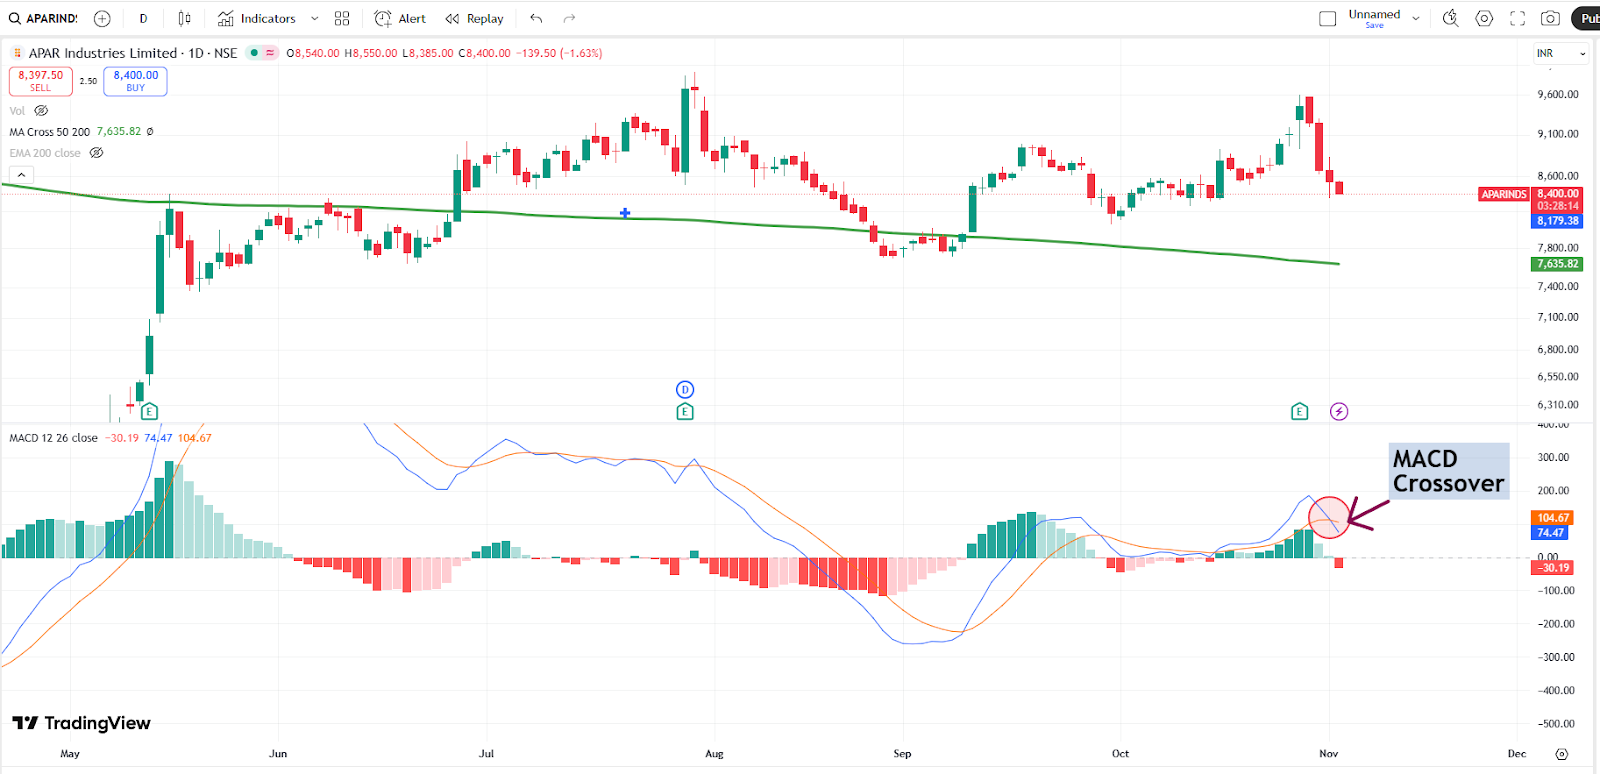
A bearish MACD crossover was seen in Apar Industries as the MACD line crossed below the signal line, signaling potential downward momentum. This technical pattern is considered a sell signal and may indicate the start of a new downtrend, prompting traders to be cautious or consider exiting long positions.
National Aluminium Company Limited
National Aluminium Company Limited (NALCO) is an Indian public sector company that is one of the largest integrated aluminum producers in Asia. Founded in 1981 and headquartered in Bhubaneswar, NALCO is a “Navratna” company that is involved in bauxite mining, alumina refining, aluminum smelting, power generation, and downstream products.
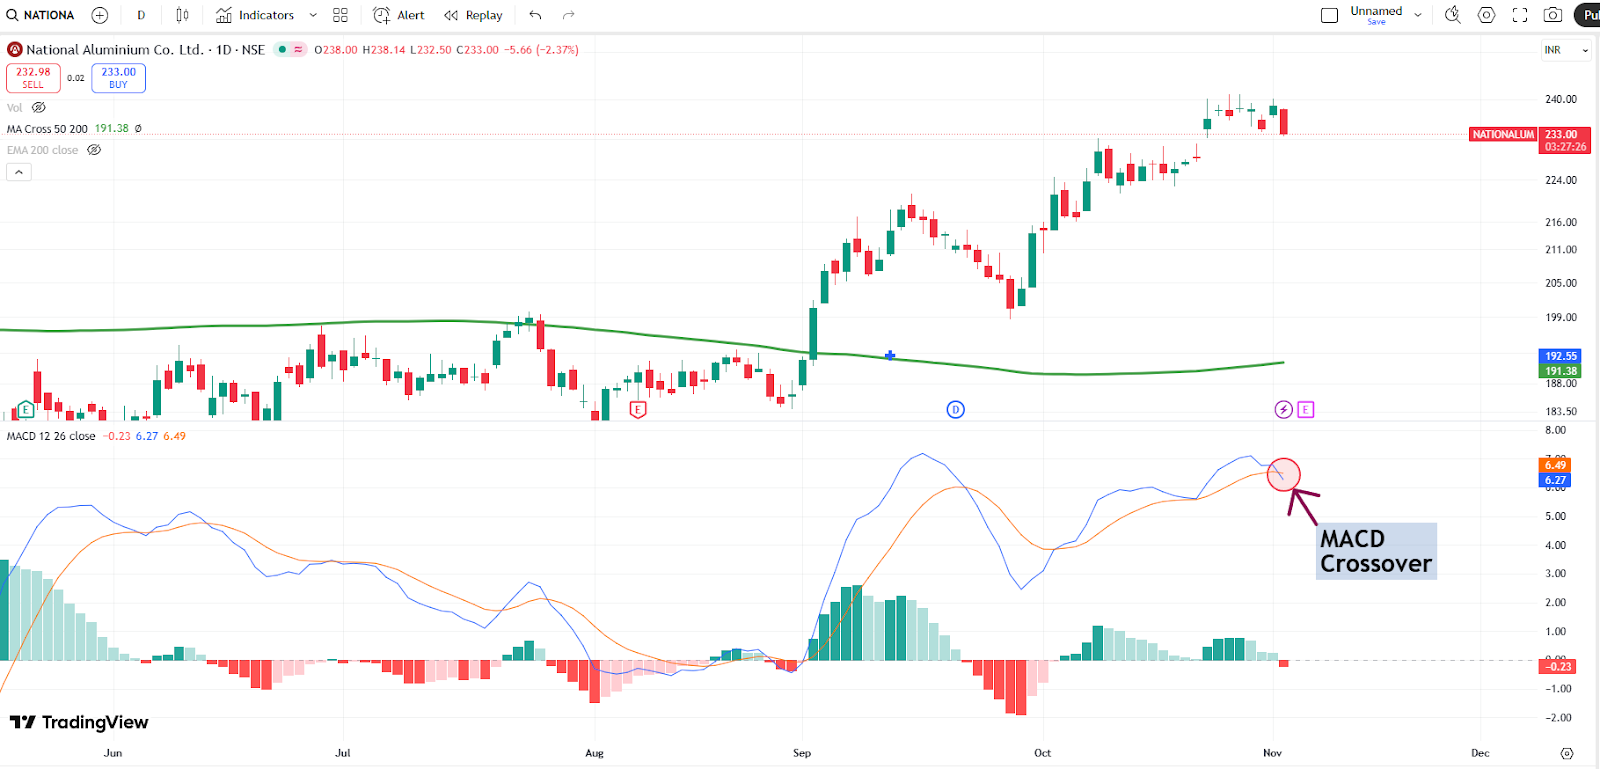
A bearish MACD crossover was seen in National Aluminium Company as the MACD line crossed below the signal line, signaling potential downward momentum. This technical pattern is considered a sell signal and may indicate the start of a new downtrend, prompting traders to be cautious or consider exiting long positions.
Written by Sridhar J
Disclaimer

The views and investment tips expressed by investment experts/broking houses/rating agencies on tradebrains.in are their own, and not that of the website or its management. Investing in equities poses a risk of financial losses. Investors must therefore exercise due caution while investing or trading in stocks. Trade Brains Technologies Private Limited or the author are not liable for any losses caused as a result of the decision based on this article. Please consult your investment advisor before investing.
