
Synopsis: Data Patterns (India) Ltd’s 4-hour chart reveals an ascending triangle, signalling a potential short-term bullish breakout.
An ascending triangle is a bullish continuation pattern characterised by a flat resistance line and higher lows. The chart shows a confirmed breakout above the resistance neckline, which is backed by a surge in volume and points to a potential short-term upward move.

On Tuesday, Data Patterns (India) Ltd broke above its resistance neckline and held above the Rs 4,320 level. This area is now acting as a solid support zone on the 4-hour chart, reinforcing the stock’s bullish momentum.
In an ascending triangle, traders typically target the nearest resistance level or project an upward move equal to the pattern’s height from the breakout point, using strong volume and momentum to confirm the trade.

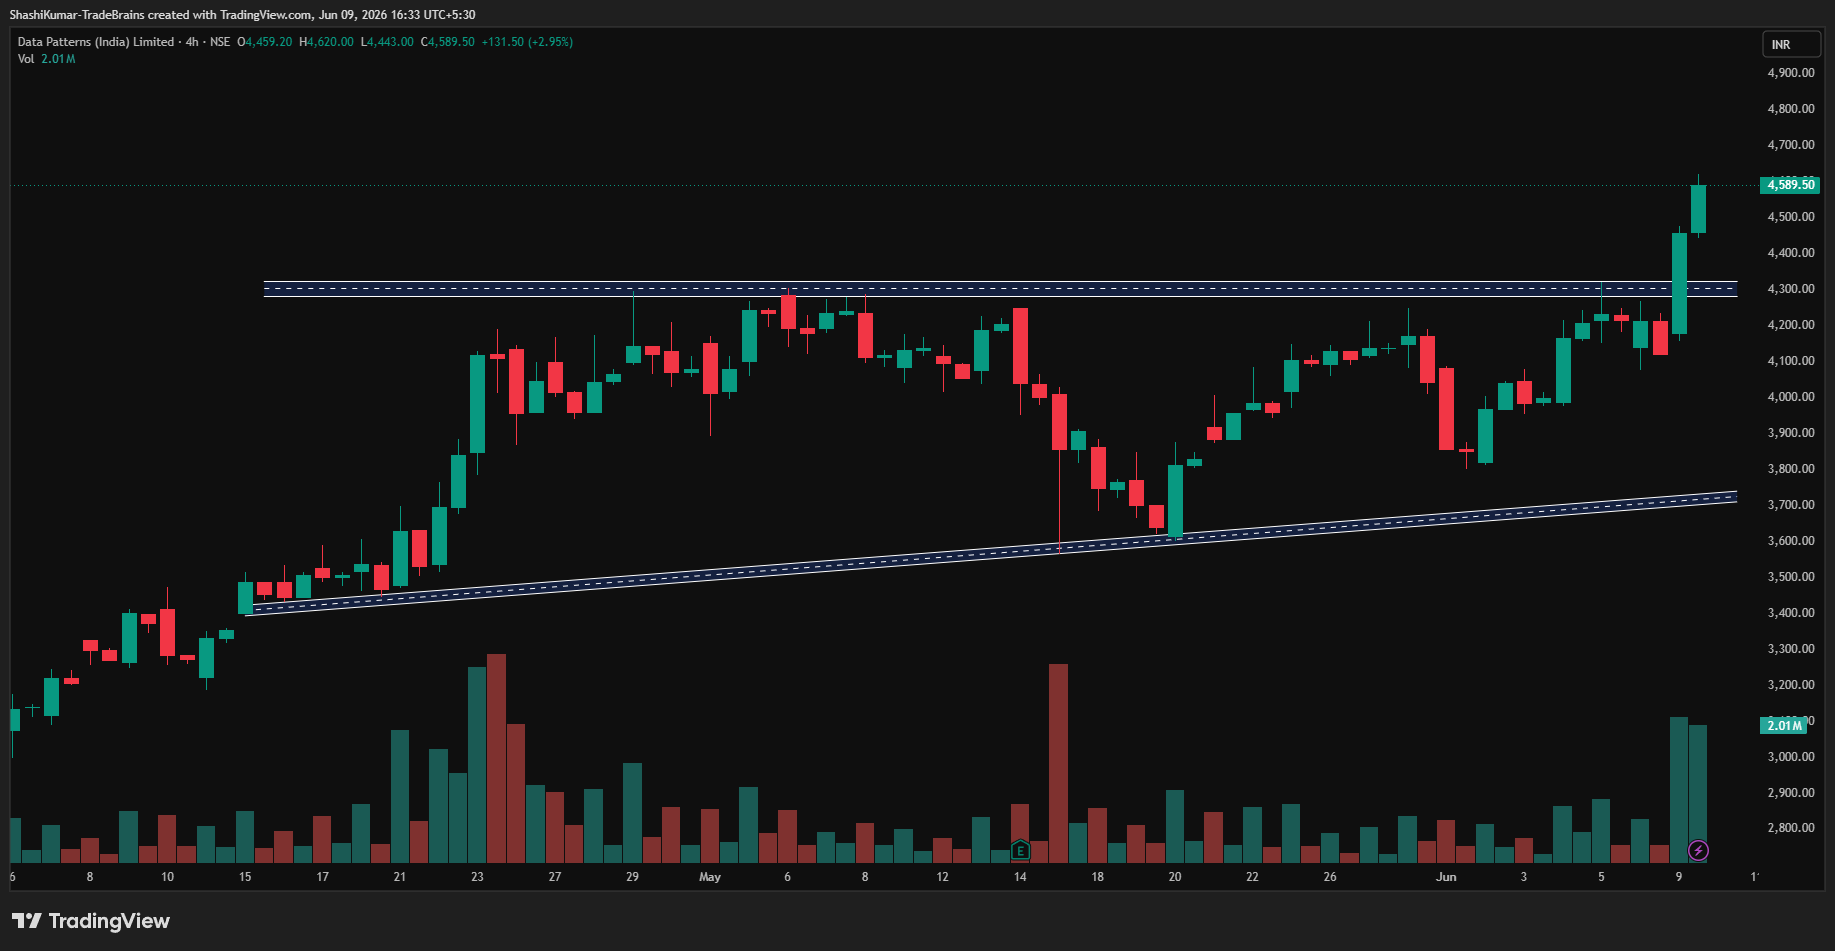
Data Patterns (India) Ltd Chart: 4-hour Timeframe
Indicator Confirmation
- RSI: The daily RSI indicates buying pressure, as it rose from 56.45 in the previous trading session to 66.96 on Tuesday.
- MACD: On the daily time frame, the blue MACD line was above the orange signal line, with the histogram turning green, indicating bullish momentum.
- Moving Averages: On the daily time frame, the 5-day EMA was above the 9-day EMA, further confirming a bullish trend.
- Price Volume Trend: The Price Volume Indicator confirms the uptrend, accompanied by an increase in buying volume in the daily time frame.
Implications
The ascending triangle pattern points to continued upside potential. So long as the stock maintains its footing above the Rs 4,320 support mark, especially on strong trading volumes, the near-term bullish outlook remains intact.
About the stock
Data Patterns delivers end-to-end design, prototyping, and testing across hardware, software, firmware, and mechanical engineering. They specialise in radars, electronic warfare, avionics, small satellites, and automated test equipment. Their solutions power major aerospace and defence programmes, including the Tejas LCA, Light Utility Helicopter, BrahMos, and advanced intelligence systems.

Data Patterns (India) Ltd is showcasing strong market momentum with impressive growth across all timelines. The stock has climbed 10.80% over the past month, building on a massive 74.93% surge over the last six months and a stellar 55.37% increase year-over-year. For more such technical stock ideas, clickhereto view our research page.
Disclaimer: The views and investment tips expressed by investment experts/broking houses/rating agencies on tradebrains.in are their own, and not that of the website or its management. Investing in equities poses a risk of financial losses. Investors must therefore exercise due caution while investing or trading in stocks. Trade Brains Technologies Private Limited or the author are not liable for any losses caused as a result of the decision based on this article. Please consult your investment advisor before investing.