

Understanding What are Economic Indicators – Leading, lagging, & coincident: The health of the economy impacts all businesses in it. It is extremely important for investors to keep track of the current state and anticipate future changes in the economy in order to make informed investment decisions.

The economy is a complex phenomenon, and investors rely on many economic indicators to understand it. Any single economic indicator is not enough; investors have to consider many indicators in trying to grasp the big picture.
Economic indicators are classified as leading, lagging or coincident depending on whether the indicated change in economic activity will happen in the future, has already happened or is currently underway. In this article, we describe some of the most important indicators used by investors in Indian financial markets.

A) Leading Indicators
Leading indicators are forward-looking in that they provide a signal before a change in the economy itself. This makes leading indicators extremely useful to forecast and predict the economic scenario in the future.
These indicators are difficult to estimate and may be misleading at times by producing false signals, so they must be used cautiously. Some popular leading indicators are –

1. Bank Credit growth
Bank credit refers to the lending of funds by scheduled commercial banks (SCB) to various sectors in the economy. Non-food credit forms a bulk of the total credit and comprises loan given to different sectors (Industry, Agriculture and services) along with personal loans to individuals.
The Reserve Bank of India (RBI) collects data on bank credit on a monthly basis from major commercial banks which together accounts for almost 95% of the total non-food credit. High growth in bank credit indicates that banks are lending more and corporates are confident to borrow and expand as well as high consumer sentiment.
A high credit growth translates into higher economic growth, but if the bank credit growth is consistently low or negative, it could signal an impending economic slowdown.

2. Capacity Utilization
Capacity utilization is an indicator of slack in the manufacturing sector provides insights into the state of the business cycle. In other words, it tells us as to what extent the production capacity in the economy is idle or used. It is measured as a proportion of the actual output produced to that of potential output which can be produced with the installed capacity.
Rising levels of capacity utilization indicate that production facilities are being used and increased output contributes positively to economic growth, whereas if the utilization levels are declining, it signals deceleration in the economy.
The RBI collects data on capacity utilization in the manufacturing sector through the OBICUS survey and releases it on a quarterly basis.
3. Yield curve
Yields are the interest rates of bonds traded in the market. The sovereign yield curve is a graphical representation of the interest rates of government bonds with different maturities. It describes the relation between short term interest rates and long term rates and inherently captures the market’s expectation of future interest rates.
The yield curve provides vital insights into the macroeconomic conditions. Higher long term interest rates than the short term rates lead to an upward sloping yield curve. Upward sloping yield curve indicates higher interest rates in the future.
High inflation and economic growth would create demand for money, thus raising interest rates. Similarly, an inverted yield curve indicates an economic slowdown characterized by low inflation and falling interest rates. The data on interest rates for different maturities of bonds is determined by market forces and is available at a high frequency.
4. Durable goods consumption
Durable goods are those goods that have a longer life, and high economic value. They represent a significant portion of the total retail consumption expenditure. Some examples of durable goods are furniture, jewellery, automobiles etc.
The demand for these goods is an indicator of the overall strength of demand in the economy. Slow growth or fall in consumption expenditure of durables signals a slowdown in the economy and weakness in aggregate demand. The most tracked consumer durables are two-wheeler and car sales. Tractor sales are considered an indicator of rural demand.
5. Confidence index
Consumer confidence measures the degree of confidence of consumers on the state of the economy. If consumer confidence is high, they would spend and make more purchases adding to strong aggregate demand and economic growth.
Low confidence would suggest that consumers prefer to save and spend less, indicating a fall in consumption expenditure. Similarly, business confidence measures the optimism of businesses regarding economic strength.
The Reserve Bank of India (RBI) releases monthly consumer confidence index and quarterly Business expectations index by conducting surveys of households and businesses.
ALSO READ
B) Lagging Indicators
Lagging indicators signal a change in the economy, usually after the change has taken place. They are not very useful in predicting future outcomes but are used as signals for conforming to the ongoing scenario.
Sometimes, an unexpected value of a lagging indicator may cause investors to change their outlook and prices respond accordingly.
1. Gross domestic product
The most popular measure for the size of the economy is the Gross Domestic Product (GDP).It is the total value of all goods and services produced within a country in a particular time period. The growth rate of GDP indicates the health of the economy.
The GDP data for India is calculated quarterly and is released by the Central Statistics Office. High growth in GDP indicates growth in income and strong aggregate demand, and corporates are likely to perform better in such an environment.
Since the GDP is released only quarterly, it only acts as a reinforcement signal to the current scenario; stock prices adjust much quickly to economic changes even before the GDP numbers are announced.
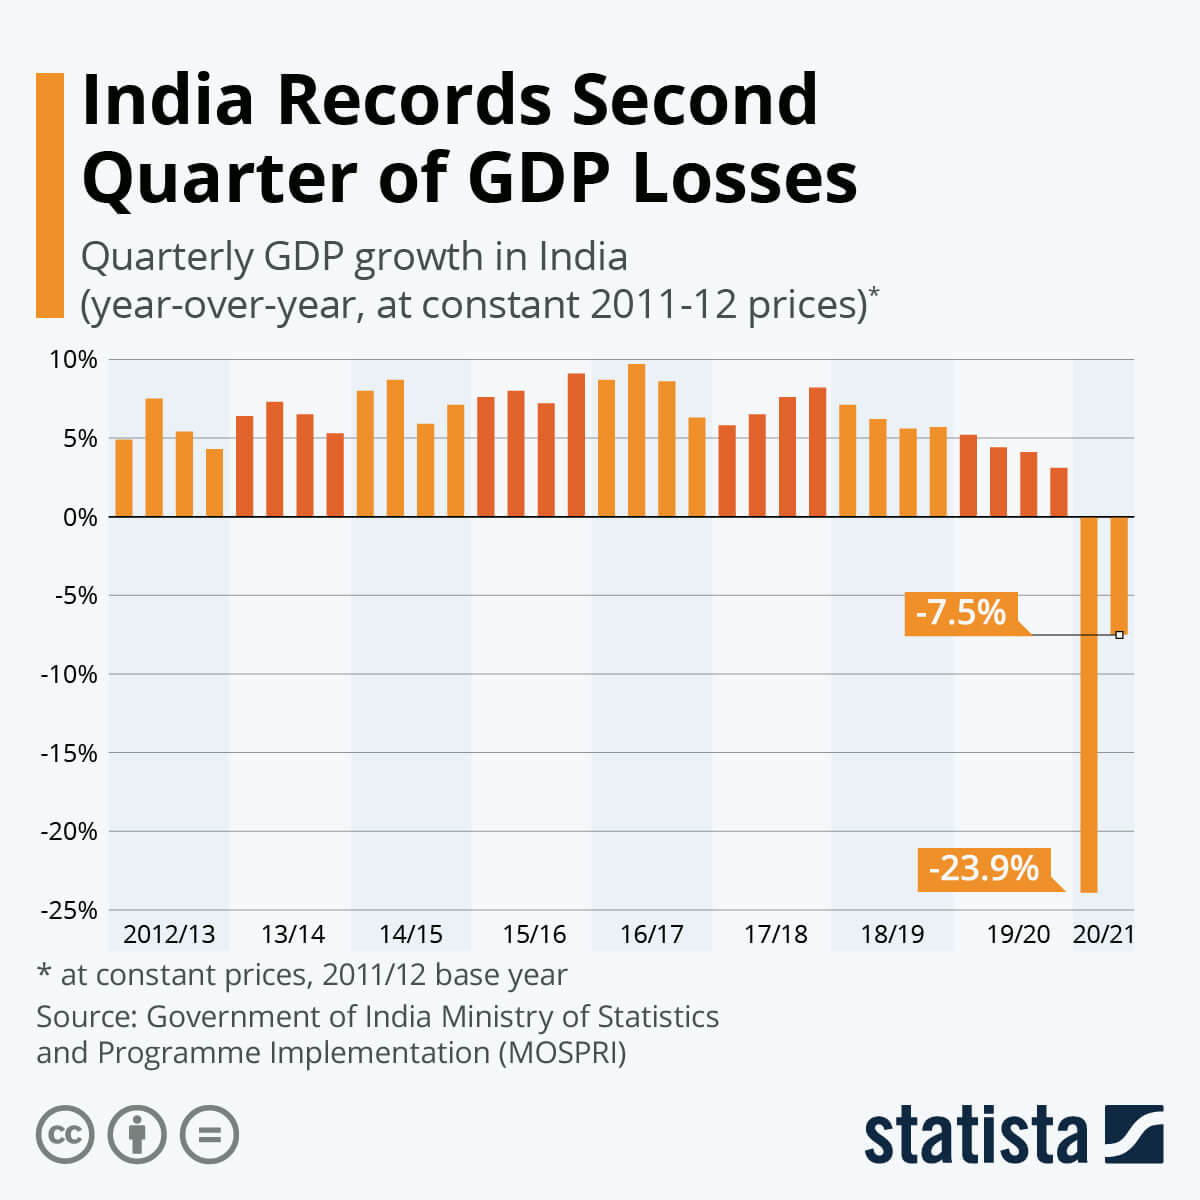
(Image Credits: Statista)
2. Unemployment rate
Another measure of economic performance is the Unemployment rate, which is measures the number of people unemployed as a percentage of the total labour force. Higher unemployment indicates a poor state of the economy – companies less willing to hire, reduced aggregate demand and further layoffs. It has been observed that the unemployment rate is negatively correlated to the prices in the stock market.
In India, the Centre for Monitoring Indian Economy (CMIE), releases monthly estimates for the unemployment rate. The unemployment data is reported with some time lag, and a high number may be a result of an already going economic slump. In India, stock prices do not react much to unemployment indicators as a lot of information is already factored in.
3. Balance of trade
Also called the Net exports, Balance of trade refers to the difference between a country’s total value of exports and imports. It tells us whether the country is in a trade surplus (higher exports) or trade deficit (higher imports).
A surplus is generally desirable as it indicates more money flowing into the country. If the surplus is due to high exports, it signals a strong demand for the country’s exports from other countries. A high trade deficit is a negative indicator of economic growth, and markets react negatively.
A country with a high trade deficit is exporting less and importing more, money flows outside the country, leading to a significant increase in debt. A high deficit also causes a fall in the value of the domestic currency.
Sometimes, too high a trade surplus can also be a cause of worry. If the trade surplus is resultant of weak imports, it may signal weak domestic demand. The data on exports and imports is released monthly by the Ministry of Commerce, Government of India.
C) Coincident Indicators
Coincident indicators change simultaneously, along with the economic conditions. These indicators help in understanding current economic conditions but do not have a predictive value. Coincident indicators are beneficial to investors as it provides real-time information on how the economy is performing.
1. Manufacturing activity
Industrial/manufacturing activity is sensitive and quickly adjusts to the current economic scenario. Increased industrial production indicates that there is a strong demand for goods, and since the industrial sector is closely linked to other sectors of the economy, higher industrial activity correlates positively with growth in other sectors.
An index that tracks the growth in manufacturing activity in the economy is theIndex of Industrial Production (IIP). The IIP is calculated monthly and released by the Central Statistics Office. Low or negative growth in the IIP is bad for corporate sales and profits; thus, stock prices fall in reaction to it.
Another forward-looking measure of industrial activity is the Purchasing Managers Index (PMI). PMI ranges from 0 to 100. A value below 50 represents a contraction, whereas a value above 50 represents an expansion compared to the previous month. A separate PMI index is also calculated for the services sector.
2. Short term interest rates
Short term interest rates are very sensitive to current economic conditions and are strongly influenced by the policy rate (Repo rate) set by the Reserve Bank of India. A rise in short term interest rates signals higher economic activity as there is more demand for money.
Similarly, lower interest rates mean that the economy is weak, and the central bank reduces its repo rate in order to spur aggregate demand. There are many short term interest rates that are determined by the market forces in the money market. The policy rate of the RBI is decided on a bi-monthly basis.
3. Inflation
This is a measure of the change in prices of goods and services over a period of time. A little positive inflation signifies strong demand that promotes economic growth, whereas very low or negative inflation is a signal of weak demand and usually coincides with low growth in the economy.
In developing countries like India, high inflation can be a cause of worry as it reduces the real disposable income of consumers and businesses may face a reduction in their profit margins due to an increase in the cost of inputs. Various indices are used to measure inflation. An index tracks the changes in the prices of a basket of goods and services.
The Consumer Price Index (CPI) is the primary index that measures retail prices of goods and services like food, transportation etc. Another index is the Wholesale Price Index (WPI), which measures the prices at a wholesale level. The data for both – CPI and WPI is released by The Central Statistics Office.

(India Inflation CPI | Image Credits: Trading Economics)
Closing Thoughts
The economic conditions are an important factor that influences prices in the stock market. To understand the economy’s current and future prospects, investors use many economic indicators when making investing decisions.
Most important are the leading indicators, which provide insights about the future economic scenario. The lagging indicators reinforce the economic trends and coincident indicators provide investors with real-time information about the economy.


