Synopsis: Eternal Ltd has formed an ascending triangle on the 4-hour chart, signalling a possible short-term bullish breakout.
An ascending triangle is a bullish continuation pattern marked by higher lows and a flat resistance line. The chart shows a confirmed bullish breakout above horizontal resistance. Supported by volume surge, it indicates rising buying pressure and points to a potential short-term upward move. On Friday, Eternal Ltd sustained levels above Rs 247 and held above the ascending triangle neckline on the 4-hour chart, reinforcing its bullish momentum.

In an ascending triangle, traders typically target the nearest resistance level or project a price move equal to the triangle’s height from the breakout point, using strong volume and momentum to confirm the trade.
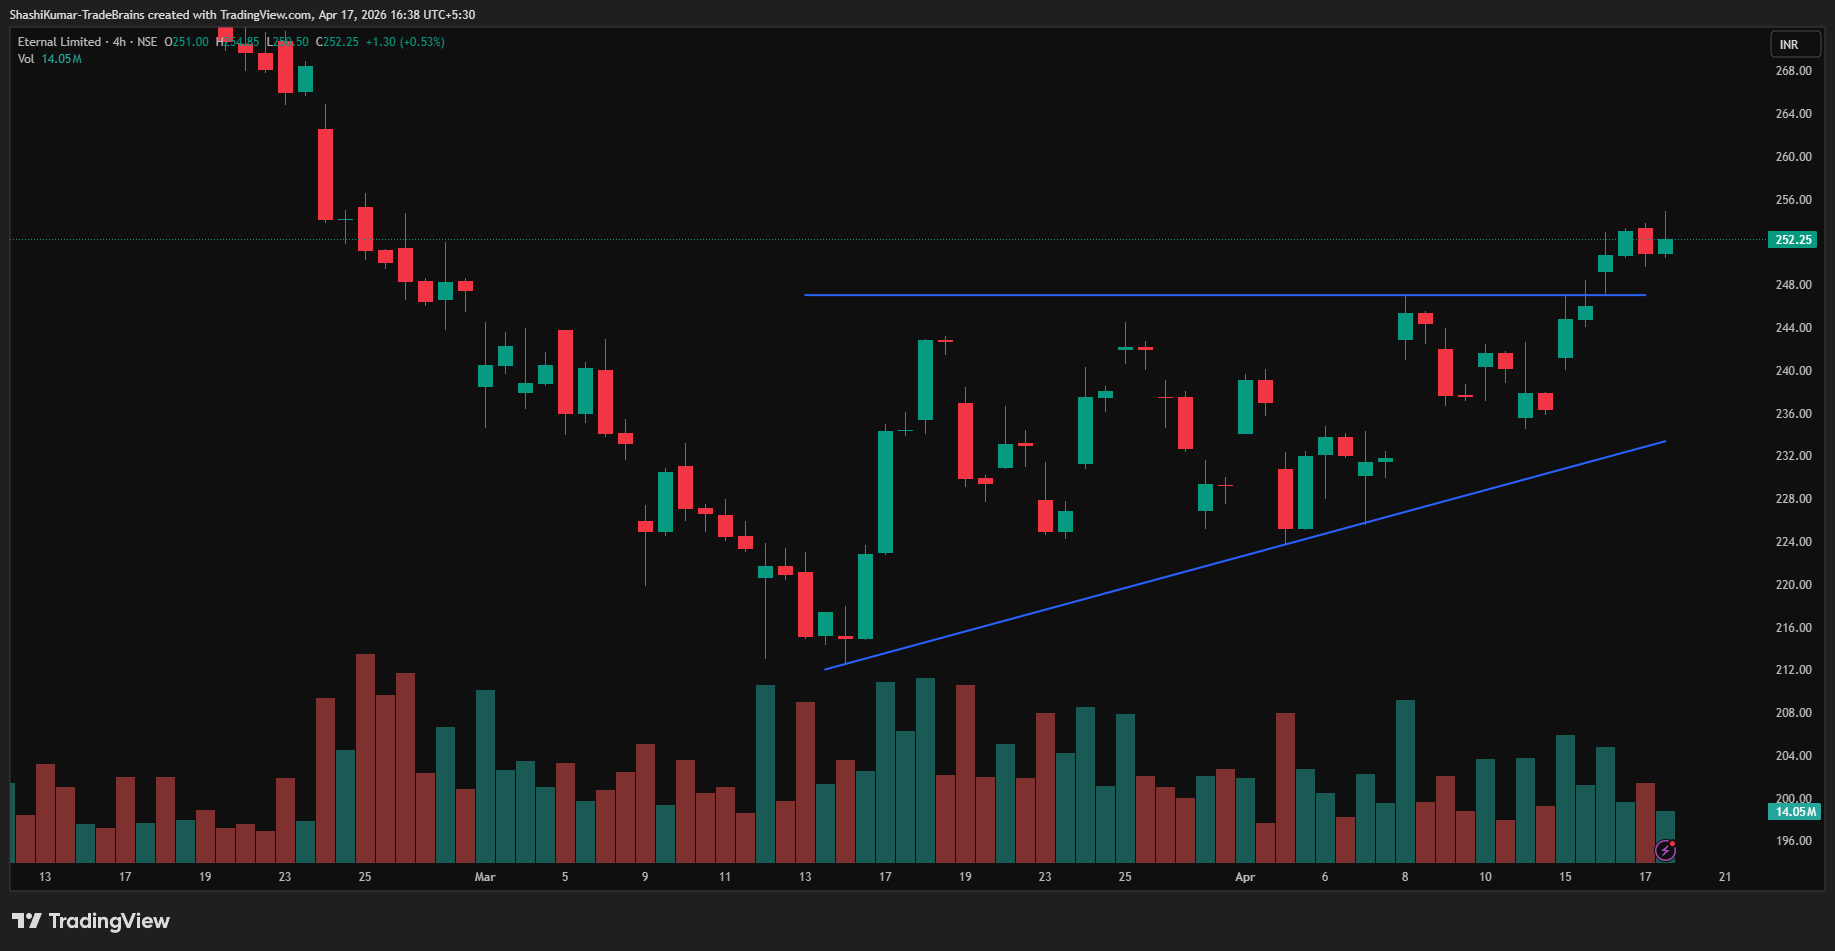
Eternal Ltd Chart: 4-hour Timeframe
Indicator Confirmation
- MACD: On the daily time frame, the blue MACD line was above the orange signal line, with the histogram turning green, indicating bullish momentum.
- Moving Averages: On the daily time frame, the 5-day moving average was above the 9-day moving average, further confirming a bullish trend.
Implications
The ascending triangle pattern indicates continued upside potential. Maintaining levels above the Rs 247 support mark, especially with strong trading volumes, would further strengthen the near-term bullish outlook.

Established in 2008, Eternal has evolved from a basic restaurant directory into a massive food-tech network. Today, it connects millions of Indian consumers with local eateries and delivery partners, redefining how people find and enjoy their meals. With 24 million+ customers using the app monthly, 300,000+ restaurants serviced, and 500,000+ delivery partners earning their livelihood through Eternal.
Over the past month, Eternal Ltd has risen 7.49%. Despite this short-term gain, the stock is down 26.4% over the past six months and has delivered an 8.89% increase year over year. For more such technical stock ideas, click here to view our research page.

Disclaimer: The views and investment tips expressed by investment experts/broking houses/rating agencies on tradebrains.in are their own, and not that of the website or its management. Investing in equities poses a risk of financial losses. Investors must therefore exercise due caution while investing or trading in stocks. Trade Brains Technologies Private Limited or the author are not liable for any losses caused as a result of the decision based on this article. Please consult your investment advisor before investing.