
Ethereum (ETH) has pulled back after a short-lived rally earlier this month. After climbing above $2,800 in mid-June, the price has dropped and is now hovering around $2,500. This decline mirrors the overall market slowdown, as Ethereum faces challenges in keeping up its upward momentum. However, despite the recent price dip, on-chain data shows that investor confidence in ETH remains strong, hinting at a possible shift in the trend ahead.
At the time of writing, the coin is trading at a price of $2,510, which represents a decrease of 1.7% over the past 24 hours. Its market capitalisation is approximately $302.82 billion, and the trading volume for the last 24 hours is $21.83 billion.
In this overview, we will analyse the key technical levels and trend directions for Ethereum to monitor in the upcoming trading sessions. All charts mentioned below are based on the 15-minute timeframe.
Ethereum Chart Analysis & ETHUSD Price Action.
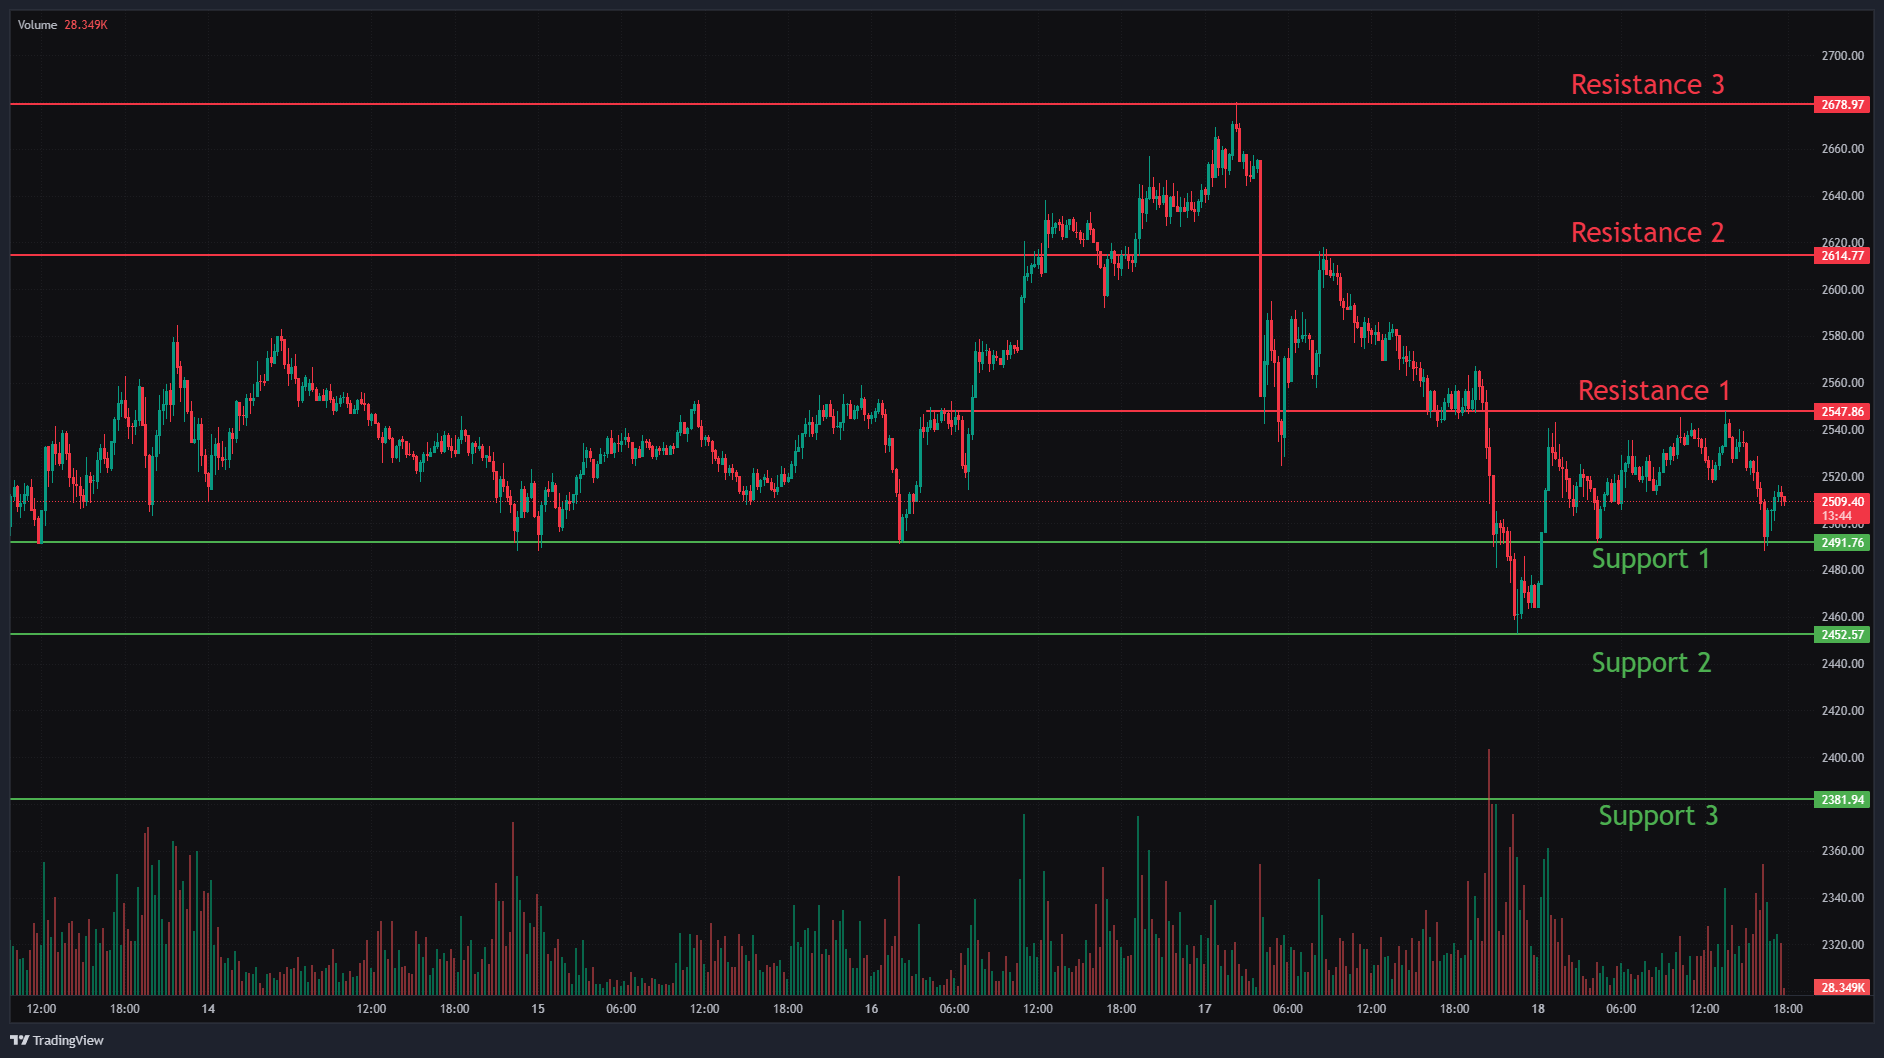
Ethereum has reversed strongly from its recent uptrend and is showing a strong bearish momentum, and the coin is currently trading at $2,510. If the price fails to move high, it could trigger a decline towards the support levels at $2,491 and $2,452. These two key levels act as a major support; if the price fails to hold, it pulls the price to the next support level. A breakdown below $2,381 could signal a deeper correction, potentially pushing Ethereum even lower in the near term.
On the upside, Ethereum faces resistance at $2,547. If it manages to break this, the next resistance levels to watch are $2,614 and $2,678. A break above these levels could open the door to a more significant bullish move, with the price likely continuing upward.
In Closing
Given the current trend, we can anticipate a consolidation to downtrend in price. If Ethereum’s price successfully breaks through the identified resistance levels, we can expect a stronger upward trend in the upcoming trading sessions. However, if it fails to surpass these resistance levels, a downtrend toward the key support levels may occur.
Traders should consider these key support and resistance levels when deciding whether to enter long or short positions based on price movements around these critical points. Additionally, incorporating moving averages can help provide more accurate entry and exit signals.
