

As Bitcoin reached a historic high, the largest altcoin, Ethereum, found strong support at $2,440 and began a fresh increase. After a significant rally from its recent lows, Ethereum had a strong rally and consolidated within a range in the short term.
At the time of writing, the coin is trading at a price of $2,650, which represents an increase of 4.7% over the past 24 hours. Its market capitalisation is approximately $320.09 billion, and the trading volume for the last 24 hours is $40.07 billion.

In the previous trading sessions, Ethereum reached a recent high of around $2,700, which is acting as a key resistance level. A successful breakout above this level could signal potential bullish momentum and lead to a strong rally to new highs in the upcoming trading sessions.
In this overview, we will analyse the key technical levels and trend directions for Ethereum to monitor in the upcoming trading sessions. All charts mentioned below are based on the 15-minute timeframe.
Ethereum Chart Analysis & ETHUSD Price Action.
The second-largest crypto, Ethereum, traded in a range-bound level around the $2.5k for a few trading sessions. The bulls were active near the levels and pushed it above the $2.6k level, which is leading to new highs in the next trading sessions.
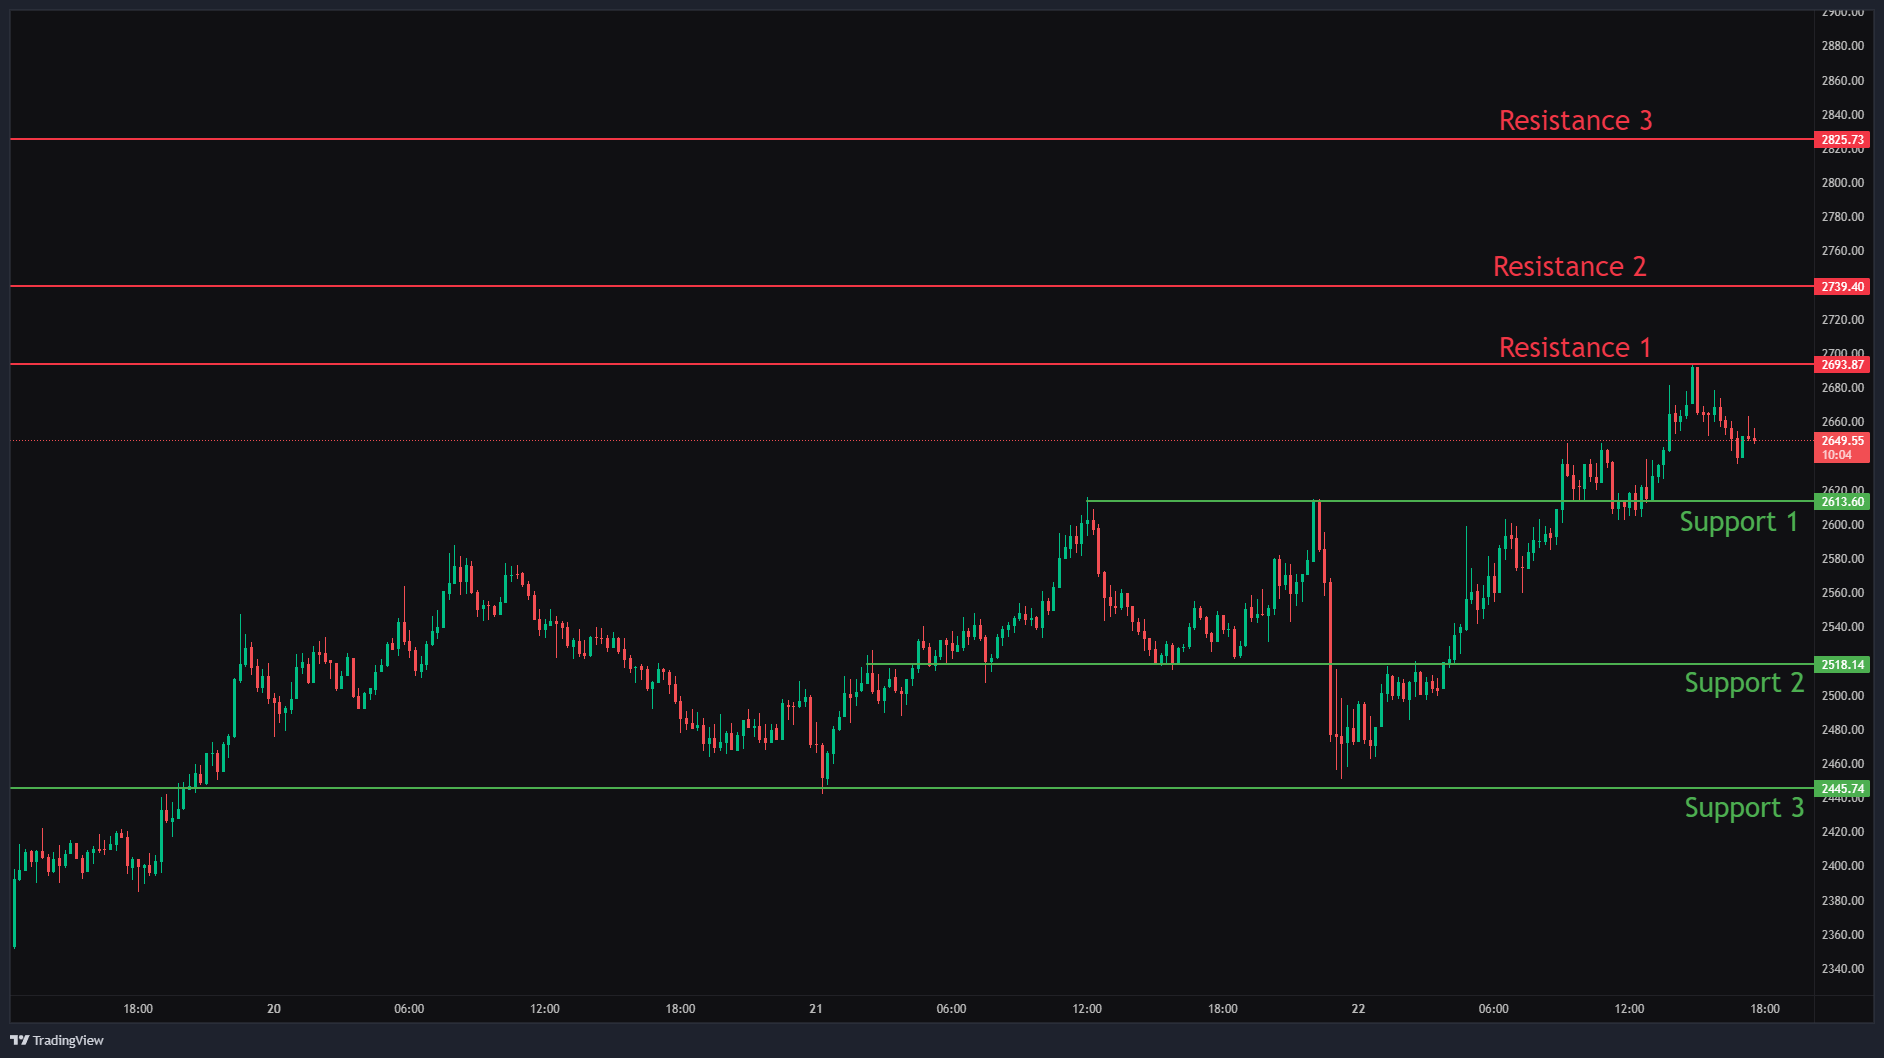
If the price manages to break below the first level of support at $2,613, we can observe the price moving towards the next price level at $2,518 and $2,445. Also, if price manages to break these levels, we can observe a further downside in the near term.
On the upside, we can see resistance to the price action at levels $2,693, $2,739, and $2,825. If the price of Ethereum manages to break the first level of resistance, we can see an upside price movement to the next level of resistance, as shown in the chart.
In Closing
As Bitcoin is in strong bullish momentum, the bullishness can be expected in the second-largest cryptocurrency also in the next trading sessions to reach new recent highs. If the price of the cryptocurrency successfully breaks through these resistance levels, we can anticipate a stronger upward trend to a sideways trend in the upcoming trading sessions. However, if the resistance levels are not breached, the market may shift into a bearish trading session.
Traders should consider these key support and resistance levels to enter long or short positions following the price break from the key levels. Also, traders can combine moving averages for more accurate entry and exit points.
