


In statistical hypothesis testing, a critical value is a point on the test distribution that is used to determine the rejection region, also known as the acceptance region. The critical value separates the area where the null hypothesis is rejected from the area where it is not rejected.
In this article, we will explore the definition, and concept of critical values in more detail, including how they are calculated, and provide practical examples of their use in different statistical tests.
Definition of critical value:
Critical value can be defined as a value that is compared to a test statistic in hypothesis testing to determine whether the null hypothesis is to be rejected or not.
The concept of critical values:
A critical value is a fixed point on the test distribution, typically represented by a z-score or t-score, that separates the acceptance region from the rejection region. The acceptance region is the area of the test distribution where the null hypothesis is not rejected.
While the rejection region is the area where the null hypothesis is rejected. The critical value is chosen based on the desired level of significance, also known as the alpha level.
For example, if the desired level of significance is 0.05, this means that there is a 5% chance of making a type I error, or incorrectly rejecting the null hypothesis. The critical value for a 0.05 level of significance will be different for different types of test distributions, such as the normal distribution or the t-distribution.
Calculation of critical values:
The critical value is calculated based on the test distribution, the level of significance, and the type of test being performed. For example, in a two-tailed test, the critical value is calculated as the point that separates the outer 2.5% of the test distribution on either side.
In a one-tailed test, the critical value is calculated as the point that separates the outer 5% of the test distribution on one side.
The critical value can be calculated using a critical value table, which lists the critical values for different levels of significance and test distributions. Alternatively, the critical value can be calculated using a calculator or a software program that performs statistical tests.
Practical examples of critical values:
A/B testing:
A/B testing is a statistical method used to compare two versions of a product or website to determine which one performs better. In A/B testing, a critical value is used to determine the significance of the difference between the two versions.
For example, if the critical value for a 0.05 level of significance is -1.96 for a two-tailed test, and the calculated z-score is -2.0, this means that the difference between the two versions is statistically significant.
T-test:
A t-test is a statistical test used to determine if there is a significant difference between the means of two groups. In a t-test, a critical value is used to determine the significance of the difference between the means.
For example, if the critical value for a 0.05 level of significance is -1.645 for a two-tailed test, and the calculated t-score is -1.7, this means that the difference between the means is statistically significant.
Chi-square test:
A chi-square test is a statistical test used to determine if there is a significant difference between the observed frequencies and the expected frequencies in a frequency distribution. In a chi-square test, a critical value is used to determine the significance of the difference between the observed and expected frequencies.
For example, if the critical value for a 0.05 level of significance is 3.84 for a chi-square distribution with 3 degrees of freedom, and the calculated chi-square value is 4.0, this means that the difference between the observed and expected frequencies is statistical.
You can try a criticalvaluecalculator.com for the calculations of t-value, f-value, R-value, z-value, and chi-square critical values according to critical value tables.

Example section:
In this section, we’ll describe some mathematical examples to understand the method of finding the critical value of different samples.
Example 1:
Calculate the z critical value if α = 0.3
Solution:
Step 1: Division
Divide 0.3 by “2”.
= 0.3 / 2
= 0.15
Step 2: Subtraction
Subtract the value of α from 1.
= 1 – 0.15
= 0.85
Step 3: Check the table.
Here’s the z-distribution table.
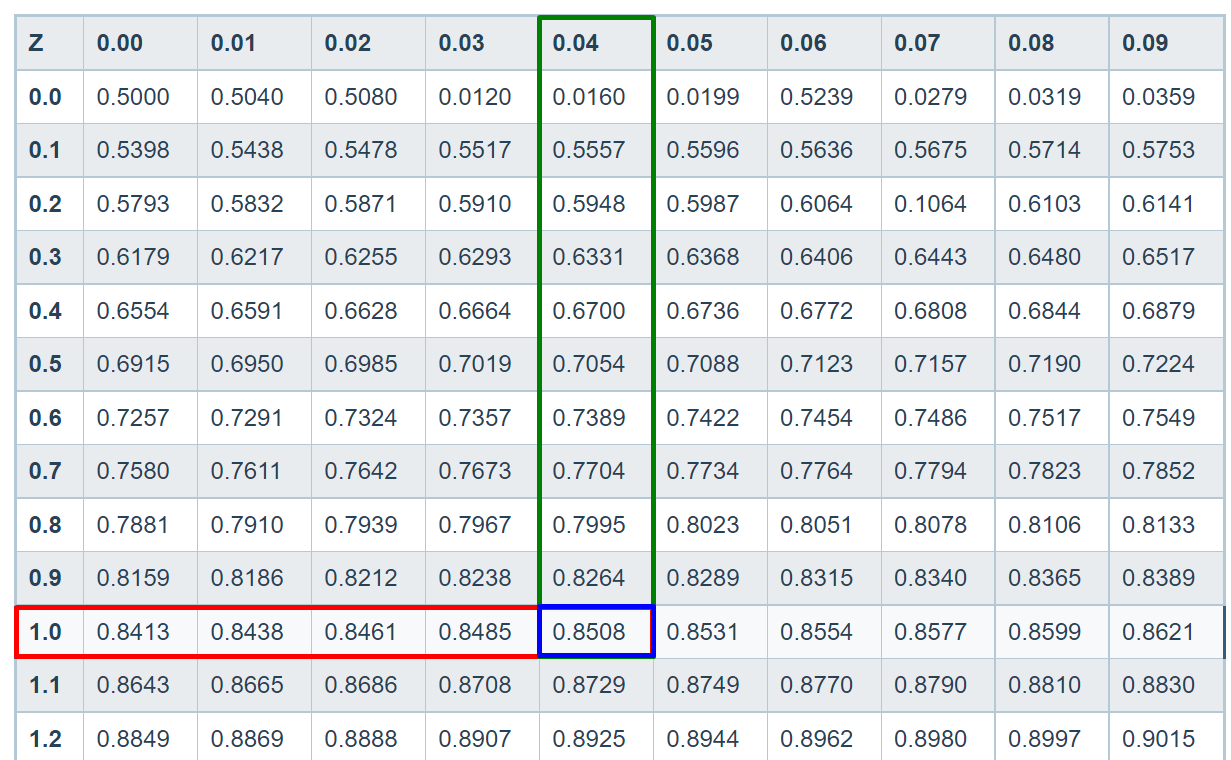
The value matches at 1.0 + 0.04.
So, the approximate value is 1.04.
Example 2:
Calculate the t critical value if α = 0.02 and the degree of freedom is 45
Solution:
Step 1: If both α and degree of freedom are given then you just have to check the table to find out the value.
| df | α | df | α | df | α |
| 1 | 31.8193 | 16 | 2.5835 | 31 | 2.4528 |
| 2 | 6.9646 | 17 | 2.5669 | 32 | 2.4487 |
| 3 | 4.5407 | 18 | 2.5524 | 33 | 2.4448 |
| 4 | 3.747 | 19 | 2.5395 | 34 | 2.4411 |
| 5 | 3.365 | 20 | 2.528 | 35 | 2.4377 |
| 6 | 3.1426 | 21 | 2.5176 | 36 | 2.4345 |
| 7 | 2.998 | 22 | 2.5083 | 37 | 2.4315 |
| 8 | 2.8965 | 23 | 2.4998 | 38 | 2.4286 |
| 9 | 2.8214 | 24 | 2.4922 | 39 | 2.4258 |
| 10 | 2.7638 | 25 | 2.4851 | 40 | 2.4233 |
| 11 | 2.7181 | 26 | 2.4786 | 41 | 2.4208 |
| 12 | 2.681 | 27 | 2.4727 | 42 | 2.4185 |
| 13 | 2.6503 | 28 | 2.4671 | 43 | 2.4162 |
| 14 | 2.6245 | 29 | 2.462 | 44 | 2.4142 |
| 15 | 2.6025 | 30 | 2.4572 | 45 | 2.4121 |
On 45 degrees the value is 2.4121 for the two-tailed T-test.
Summary:
In this article, we have studied the basic definition of critical values, and we have learned a deep introduction to the basics of this topic. We have also discussed practical examples and methods to calculate the T-critical value and z-critical value.
Further in this article, we have discussed all the types of critical values. You have witnessed that it is not a difficult topic, and now you can solve all the problems related to this topic. Happy testing!
