

Fundamental Analysis Of Aarti Industries: Specialty chemicals have become essential in various industries ranging from pharmaceuticals, electronics, agriculture, and automotive. The specialty chemical market has witnessed a significant growth over the years, owing to its wide range of applications and India’s unique position to benefit from MNCs adopting the ‘China+1’ post-pandemic.

Arti Industries is one such stock in this space which is undergoing multiple developments from demerger to huge CAPEX. In this article, we’ll perform a fundamental analysis of Aarti Industries and see if it can be an interesting investment pick.
Fundamental Analysis of Aarti Industries
We’ll begin our Fundamental Analysis of Aarti Industries by becoming acquainted with the company’s operations and products. Following that, we’ll go into the stock’s financials. The article concludes with a highlight of future plans and a summary.

Company Overview
Aarti Industries was established in 1984 by first-generation technocrats and is the leading manufacturer of speciality chemicals. It is one of the highly integrated and most competitive benzene-based speciality chemical companies in the world.
Over the last decade, AIL has evolved from an Indian company serving global markets to a global company choosing to manufacture out of India. The company ranks first to fourth globally for 75% of its portfolio and it is a “Partner of Choice” for a variety of major global and domestic customers.

As of FY23, the company’s infrastructure comprises 16 state-of-the-art manufacturing plants, 11 environmentally conscious Zero Liquid plants, 5 cutting-edge co-generation power plants, and 2 dedicated R&D centres.
Earlier, the company run its speciality chemicals and pharmaceutical business under one name. But in FY22, it announced its demerger from the pharmaceutical business which resulted in 2 separate entities, namely Aarti Industries Limited (AIL) and Aarti Pharmalabs Limited (APL).
The main motive of the demerger was for the companies to focus on their respective core businesses and allocate resources more efficiently. In this article, we will only focus on the company that is focused on the speciality chemical business, that is, Aarti Industries Limited.

Geographic Presence
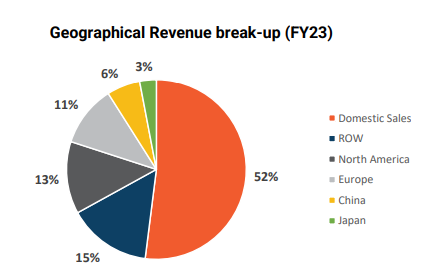
As of FY23, the company has a wide range of customers that includes, more than 700 domestic customers and more than 400 global customers spread across 60 countries.
The following image shows you the geographical revenue break-up of Aarti Industries as of FY23.
The following image depicts the key customers of Aarti industries:

Product Offerings
Aarti Industries has a diverse product offering of more than 100 products that serves leading consumers across the globe for Speciality Chemicals and Intermediate for Pharmaceuticals, Agro Chemicals, Pigments, Polymers, Printing Inks, Dyes, Fuel additives, Surfactants, Aromatics, and various other Speciality Chemicals.
The following Image will give you the revenue breakup of the company for FY23:

Industry Overview
The Indian chemical industry is one of the most crucial parts of our economy, accounting for around 7% of the country’s Gross Domestic Product (GDP).
Given that India is the world’s sixth-largest producer of chemicals and Asia’s third, the Indian chemical sector is well-positioned to capitalize on future opportunities.
The Indian chemicals industry was valued at $178 billion in 2019 and is expected to grow to $304 billion by 2025, at a CAGR of 9.3%. By FY 2040, the sector is estimated to reach $1 trillion.
Aarti Industries – Financials
We will now conduct a Fundamental Analysis of Aarti Industries by using the reports given by the company
Revenue and Net Profit Growth
The Profit/Loss statement of the company indicates that the operating revenue of the company has increased from ₹4,706 Crores to ₹7,283 Crores from FY19 to FY23 respectively. This gives the company a 5-year CAGR of 11.54% on its revenue.
It is to be noted that the company demerged from its pharmaceutical business in Oct FY22 and the financials from FY22 are exclusive of demerged enterprise. Despite this, the company has increased its revenues at a CAGR of 11.54% from FY19-FY23.
The company had also increased its net profit from ₹492 Crores to ₹1,186 Crores from FY19-22. But this number dipped by half during the FY23 to ₹545 Crores. This decline has resulted in a CAGR growth of only 2.59% in the last five years
| Year | Operating Revenue | Profit after tax |
|---|---|---|
| 2019 | 4,706 | 492 |
| 2020 | 4,621 | 536 |
| 2021 | 5,023 | 523 |
| 2022 | 6,871 | 1,186 |
| 2023 | 7,283 | 545 |
| 5 Year CAGR Growth | 11.54% | 2.59% |
Let us now analyze the margins of the company and find out where the company is incurring huge expenses that have resulted in the decline of its profits.
Margin Analysis
During the last five fiscal years, the company posted its highest ever operating profit margin and a net profit margin of 14.80% and 7.50% respectively, in FY22.
This is led by a decline to 14.80% in the operating profit margin and 7.50% in the net profit margins which is the lowest recorded margins in the last 5 years.
As both the operating and net profit margin have declined, we can draw to the conclusion that this decline is due to the increase in the operating expenses.
| Year | Operating Profit Margin | Net Profit Margin |
|---|---|---|
| 2019 | 20.50% | 10.50% |
| 2020 | 21.30% | 11.60% |
| 2021 | 19.60% | 10.40% |
| 2022 | 25.00% | 17.30% |
| 2023 | 14.80% | 7.50% |
Return Ratios: RoCE and RoE
As the financials statement has been recast for FY21 to account for the demerger, the past return ratios cannot be compared to analyse the current situation of the company.
Taking a look at the return ratios from FY21, we can see that the company reported a ROE and a RoCE of 29.50% and 22.37%, respectively, during the year. During FY23, the ROE and RoCE declined to 11.5% and 13.44% respectively. This is due to the result of the decline in revenues during the year.
| Year | ROE (%) | RoCE (%) |
|---|---|---|
| 2019 | 22.50% | 20.49% |
| 2020 | 18.50% | 18.13% |
| 2021 | 15.90% | 14.32% |
| 2022 | 29.50% | 22.37% |
| 2023 | 11.50% | 13.44% |
Debt & Interest Coverage Ratio
Based on the data after the demerger, we can see that the company has a healthy debt condition with the debt-to-equity ratio ranging around 0.55 to 0.58 in the last two financial years. This indicates that the company is largely dependent on its own funds to operate and expand its business. This also means that the company has a lesser burden of repaying the interest and capital amount.
The interest coverage ratio of FY23 suggests that the company has earned enough profits to repay its interest on outstanding loans 6.48 times.
This also means that the company is in a position to borrow more funds for the purpose of expansion and growth.
| Year | Debt to Equity (x) | Interest Coverage Ratios (X) |
|---|---|---|
| 2019 | 0.88 | 4.41 |
| 2020 | 0.68 | 6.42 |
| 2021 | 0.81 | 8.69 |
| 2022 | 0.57 | 16.88 |
| 2023 | 0.58 | 6.48 |
Future Plans of Aarti Industries
So far we looked at previous fiscals’ data for our fundamental analysis of Aarti Industries. Let us now explore what plans the company has for the future.
- The company plans to allocate a CAPEX of approximately Rs. 2,500-3,000 crore for its chemical projects in FY23.
- The company has initiated the site development work on over 100 acres in Jhagadia for the purpose of expanding its business.
- The company is introducing over 40 new chemical products along an integrated value chain. It also has plans to increase its Chloro Toluene Base capacity to 42,000 TPA. These factors can help the company expand its revenue.
- The company also has plans to increase its EBITDA margins to 25-30%.
Key Metrics of Aarti Industries
We are almost at the end of our Fundamental Analysis Of Aarti Industries. Let’s take a quick glance at the stock’s important metrics.
| Particulars | Figures | Particulars | Figures |
|---|---|---|---|
| CMP | ₹ 456 | Market Cap (Cr.) | ₹ 16,894 |
| EPS | ₹ 15.0 | Stock P/E | 34 |
| RoCE (%) | 13.44% | RoE(%) | 11.50% |
| Promoters Holding | 43.6 % | Book Value | ₹ 136 |
| Debt to Equity | 0.58 | Price to Book Value | 3.42 |
| Net Profit Margin(%) | 14.80% | Operating Profit Margin(%) | 7.50% |
In Closing
As we conclude our fundamental analysis of Aarti Industries Limited, we note that though the company’s margins were reduced by the Russia-Ukraine war, it can be considered a temporary setback.
With the increasing revenue and plans the management has set out, the future of the company looks promising. As an investor, we are responsible for ensuring that the company is maintaining its revenue growth and that the management is following through with the plans they have communicated.
Written By Aaron Vas
By utilizing the stock screener, stock heatmap, portfolio backtesting, and stock compare tool on the Trade Brains portal, investors gain access to comprehensive tools that enable them to identify the best stocks also get updated with stock market news, and make well-informed investment decisions.


