

Fundamental Analysis of IEX: The increase in the nation’s GDP, an increase in the income among consumers and a change in our daily lifestyle have led to an increase in the consumption of electricity in India.

This demand is expected to further increase in the future. While various companies produce power in India, there is only one of them that has a majority share in the physical delivery of electricity across the nation. This company is IEX Limited.
While the company’s stock has given good returns in the past, it has witnessed a significant fall in the recent year. In this article, we will conduct a fundamental analysis of IEX industries and try to find the reason behind its recent decline and also see if the stock has future potential to increase in the future.

Fundamental Analysis Of Indian Energy Exchange
Company Overview
The Indian Energy Exchange (IEX) is a leading marketplace for energy in India. It provides a nationwide automated trading platform that enables the physical delivery of electricity, renewables and electricity.
The company has recently pioneered cross-border electricity trade which has with an aim to create an integrated South Asian Power Market.

IEX employs cutting-edge technology that is both user-friendly and customer-focused. It promotes efficient price discovery and facilitates the purchase and sale of power.
IEX has a large network of approximately 7,300 participants from 29 Indian states and 5 union territories. Distribution utilities, conventional and renewable energy providers, and obliged entities are among the participants.
Furthermore, there are over 4,600 commercial and industrial consumers from industries such as metal, food processing, textile, cement, automobile, IT, and others.

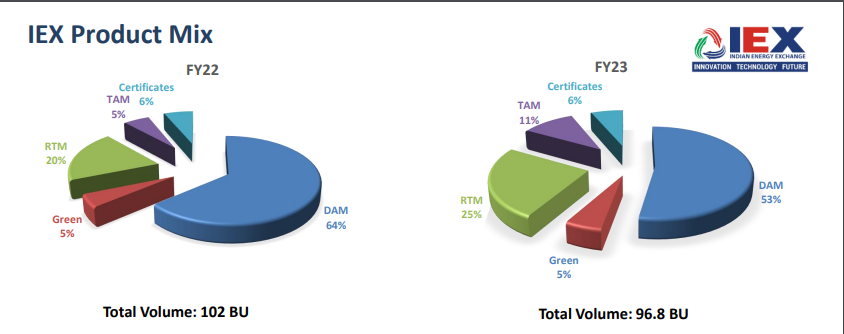
Products of the company
The following are the products offered by the company:
Electricity Market
- Day Ahead Market
- Term Ahead Market (contracts of upto 3 months)
- Real-Time Market
- Cross-Border Electricity Trade
Green Market
- Green Term Ahead Market
- Green Day-Ahead Market
Certificate Market
- Renewable Energy Certificates
- Energy Saving Certificates
The following images will further help you understand the company’s products and product mix.

Industry Overview
India is the world’s third-largest producer and consumer of electricity, with 411.64 GW of installed capacity as of January 31, 2023. The sector contributes significantly to the government’s income, with the government collecting over Rs 1.5 trillion in taxes and duties.
The electricity industry is a crucial component of the Indian economy and plays an important role in the growth of the country.
This increased demand for electricity will benefit power trading businesses like IEX tremendously because they ensure that electricity is accessible when and where it is needed and can assist to stabilise the grid.
Though IEX Limited has a dominant share in the power trading industry, the recent news about the government considering implementing market coupling poses a serious threat to the company losing its market share.
Market coupling is the process of establishing a unified price for electricity across all exchanges. This threatens IEX’s market share because participants will no longer need to trade on a certain exchange to get the best price.
Indian Energy Exchange – Financials
We will now perform a fundamental analysis of IEX exchange using the company’s annual reports.
Revenue and Net Profit Growth
The profit and loss account of the company indicates that the revenues of the company have increased consistently over the last 5 years. The revenue has grown from Rs 294.15 Crores in FY19 to Rs 474.10 Crores in FY23 which gives a CAGR of 12.67% during this duration
The table below shows the total revenues of IEX Limited for 5 financial years:
| Financial Year | Revenue (Rs, in Crores) |
|---|---|
| 2019 | 294.15 |
| 2020 | 297.4 |
| 2021 | 356.23 |
| 2022 | 484.4 |
| 2023 | 474.1 |
| CAGR growth | 12.67% |
Similar to the revenues, the company has also reported a consistent increase in its net profits over the last 5 financial years. The net profit has grown from Rs 165.03 Crores in FY19 to Rs 305.99 Crores in FY23 which gives a CAGR of 16.69% during this duration.
The table below shows the net profit of IEX Limited for 5 financial years:
| Financial Year | Net Profit (in Crores) |
|---|---|
| 2019 | 165.03 |
| 2020 | 175.71 |
| 2021 | 205.43 |
| 2022 | 308.63 |
| 2023 | 305.99 |
| CAGR growth | 16.69% |
Margin Analysis
As the company mainly deals with the distribution of energy and not its production, it does not deal with many operating expenses.
If the take a look at the EBITDA margins of the company, we can see that company has retained the majority of its revenues before accounting for interest, depreciation and tax expenses.
Apart from having these margins above 80%, you can also notice that these margins have consistently increased year-on-year.
The table below shows the EBITDA margins of IEX Limited for 5 financial years:
| Financial Year | EBITDA Margins |
|---|---|
| 2019 | 82.58% |
| 2020 | 82.31% |
| 2021 | 83.86% |
| 2022 | 87.45% |
| 2023 | 86.37% |
Even after accounting for the additional expenses, the company has managed to retain more than 55% of the revenue and also managed to consistently increase its net profit margins year-on-year.
The table below shows the net profit margins of IEX Limited for 5 financial years:
| Financial Year | Net Profit Margins |
|---|---|
| 2019 | 56.1 |
| 2020 | 59.08 |
| 2021 | 57.67 |
| 2022 | 63.71 |
| 2023 | 64.54 |
Return Ratios: RoCE and RoE
The return on equity of IEX Limited has been above 38% over the last five financial years which suggests that the company has generated good returns on shareholders’ capital.
The table below shows the ROE of IEX Limited for 5 financial years:
| Financial Year | ROE |
|---|---|
| 2019 | 44.57 |
| 2020 | 45.29 |
| 2021 | 39.17 |
| 2022 | 43.96 |
| 2023 | 38.27 |
Similarly, the company has reported a RoCE of more than 45% over the last years which indicates an efficient utilization of resources by the company.
The table below shows the ROCE of IEX Limited for 5 financial years:
| Financial Year | RoCE |
|---|---|
| 2019 | 58.08 |
| 2020 | 52.6 |
| 2021 | 45.19 |
| 2022 | 53.84 |
| 2023 | 46.38 |
Debt-to-equity ratio
The debt-to-equity ratio of the company is reported as Nil which indicates that the company has zero or negligible debt and is running its business using its own resources.
Zero debt also suggests that the company does not have any obligations towards repayment of interest or the principal amount which is why it is able to retain its majority of revenue.
Future Plans Of Indian Energy Exchange
So far we looked at the previous fiscals’ data for our fundamental analysis of Indian energy exchange Limited. This section will attempt to make sense of what lies ahead for the company and its shareholders.
- The company has expanded its branch into the ancillary market
- The company has introduced derivatives that will allow for price hedging and lower volatility in prices, hence enhancing liquidity in the spot market.
- The company launched IGX in 2020 which achieved a breakeven in its first year of operation. It is expected to have robust revenue growth over the next 5 years
- ICX a wholly-owned subsidiary of IEX has plans of expanding its business in the voluntary carbon credit market.
Fundamental Analysis of IEX – Key Metrics
We are almost at the end of our fundamental analysis of Indian Energy Exchange Limited. Let’s take a quick look at the stock’s important metrics.
| Particulars | Figures | Particulars | Figures |
|---|---|---|---|
| CMP | ₹ 123 | Market Cap (Cr.) | ₹ 11,016 Cr |
| EPS | ₹ 3.28 | Stock P/E | 39.1 |
| RoCE (%) | 46.38 | RoE(%) | 38.27 |
| Promoters Holding | 0 | Book Value | ₹ 8.80 |
| Debt to Equity | 0 | Price to Book Value | 14.6 |
| Net Profit Margin(%) | 64.54 | Operating Profit Margin(%) | 86.37 |
In Closing
As we conclude our fundamental analysis of IEX Limited, we can say that as long as the company does not lose a major market share due to market coupling and regularly increases its earnings, it can grow its business in the future.
Written By Aaron Vas
By utilizing the stock screener, stock heatmap, portfolio backtesting, and stock compare tool on the Trade Brains portal, investors gain access to comprehensive tools that enable them to identify the best stocks also get updated with stock market news, and make well-informed investment decisions.


