

Fundamental Analysis of Polycab India: From the rapid exchange of digital information to the seamless distribution of energy, the cables and wires sector plays a vital role in the development of the country.

Within this critical sector, one company stands out as a market leader: ‘Polycab India’. Since its lows during covid, the stock has given a multi-bagger of 629% to its investors. In this article, we will conduct a fundamental analysis of Polycab India and see if the stock has future potential to increase in the future.
Fundamental Analysis of Polycab India

We’ll begin our Fundamental Analysis of Polyab India by becoming acquainted with the company’s operations and products. Following that, we’ll go into the stock’s financials. The article concludes with a highlight of future plans and a summary.

Company Overview
The origin of Polycab industries dates back to 1964 when Late Thakurdas Jaisinghani had set up by ‘Sind Electric Stores” which dealt with various electrical products including fans, lighting, switches, and wires. The business was later carried out by his sons which led to led to the foundation of “Polycab Industries’ in 1983.
In 1996, ‘Polycab Wires Private Limited’ was incorporated which has incorporated and has become of the leading manufacturers of FMEG, wires and cables. As of FY23, the company has obtained a 22-24% market share in the organized market and a 15-16% market share in the overall market.

The company has 25 manufacturing facilities across 5 locations set up in India. Furthermore, it has a PAN India presence with more than 4300 dealers & distributors and more than 2,05,0000 retail outlets across the country.
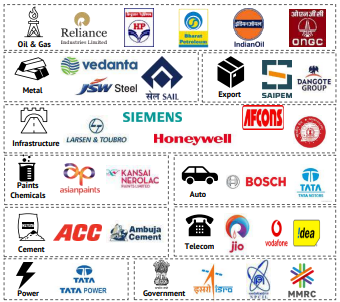
The company’s customer base spans across various industries, encompassing Oil & Gas, Metal, Infrastructure, Chemicals, Cement, and Power sectors.
The following image will show you the customers the has catered to in the past and present:

Moats of the company
Following are the economic moats of Polycab India in the wires and cable business:
- Polycab is the exclusive manufacturer of a comprehensive range of wires and cables in India, boasting 12,000+ SKUs and global certifications.
- The company has a strong relationship with distribution channel partners that have been developed over decades.
- The company efficiently protects its margins against commodity price volatility through access to embedded derivatives from suppliers
- Utilizing high-quality imported copper, in-house manufacturing, and robust backward integration enables the production of superior-quality products.
- The company has the largest distribution network that comprises 4,300+ dealers & distributors and 205,000+ retail outlets, spread across India.
- Optimized chain of supply that gives them the ability to deliver products to any dealer or distributor across India within 24 hours.
Industry Overview
The Indian Wire & Cable industry has grown steadily in recent years, with sectors like Power, Railways, and Telecom driving demand. It’s interesting to note that organised players have a significant share of the market, while unorganized players dominate rural areas. Looking ahead, the industry is projected to grow to ₹900-950 billion by FY26.
Polycab India – Financials
We will now conduct a Fundamental Analysis of Polycab India by using the reports given by the company
Revenue & Net Profit Growth
The financial statement of the company indicates that the operating revenue of the company has increased from ₹7,985 Crores to ₹14,107 Crores from FY19 to FY23 respectively. This gives the company a 5-year CAGR of 15.29% on its operating revenue.
Along with the revenues, the net profits of the company have also increased from ₹500 Crores to ₹1,282 Crores. This gives the company a CAGR of 26.54% on its net profit during the last five financial years.
| Year | Operating Revenue (Rs in Crores) | Profit after tax (Rs in Crores) |
|---|---|---|
| 2019 | 7,985 | 500 |
| 2020 | 8,830 | 765 |
| 2021 | 8,792 | 885 |
| 2022 | 12,203 | 917 |
| 2023 | 14,107 | 1,282 |
| 5 Year CAGR Growth | 15.29% | 26.54% |
Let us now analyze the margins of the company and find out if the margins of the company have increased similarly as its revenues and profits.
Margin Analysis
During the last five financial years, the company has experienced fluctuations in operating margins. But they have maintained a steady range between 9% to 13% based on the varying operating expenses.
Similarly, the net profit margins of the company have experienced some fluctuations. But overall, the net profit margins have increased from 6.3% to 9.1%.
| Year | Operating Profit Margin | Net Profit Margin |
|---|---|---|
| 2019 | 10.99% | 6.30% |
| 2020 | 12.08% | 8.70% |
| 2021 | 11.99% | 10.10% |
| 2022 | 9.45% | 7.50% |
| 2023 | 12.59% | 9.10% |
Return Ratios: RoCE and RoE
The return ratios of the company also show a positive perspective on the company’s performance.
For FY23, both the RoE AND RoCE of the company show an exceptional performance of the company after a slight decline during the last two financial years
The company reported a RoE and a RoCE of 21% and 26.1%, respectively, during FY23. These ratios are an indication of good returns given to the shareholders of the company and efficient use of company resources
| Year | ROE (%) | RoCE (%) |
|---|---|---|
| 2019 | 17.50% | 27.90% |
| 2020 | 19.90% | 26.40% |
| 2021 | 15.50% | 20.70% |
| 2022 | 15.20% | 20.40% |
| 2023 | 21.00% | 26.10% |
Debt & Interest Coverage Ratio
Looking at the company’s leverage status, we can see that it has kept its debt-to-ratio to less than 0.1 during the last five years. This suggests that the company is under less financial strain because it is depending less on borrowed capital to fund its operations and expansion.
This also means that the company is able to retain more of its revenue because it does not have a large commitment to repay debt and interest.
In terms of interest, the company has maintained a good interest coverage ratio throughout the last five years, with a ratio of 27.3 reported for FY23. This means the company has generated enough gross profits to cover its interest expenses 27 times over.
This also implies that the company is in a position to borrow additional funds for the purpose of expansion and growth.
| Year | Debt to Equity (x) | Interest Coverage Ratios (X) |
|---|---|---|
| 2019 | 0.1 | 13.8 |
| 2020 | 0.04 | 35.6 |
| 2021 | 0.05 | 26.2 |
| 2022 | 0.01 | 39.4 |
| 2023 | 0.01 | 27.3 |
Future Plans of Polycab India
The management has given a large target of 20,000 crores of sales by 2026. It has launched a project by the name of Project Leap under which it has taken the following steps:
- The company is focusing on expanding reach, digitalizing CRM, generating demand, and enhancing the utilization of analytics.
- Enhancing the planning and support function of key B2C businesses involves the incorporation of new functions such as sales analytics, channel development, and product management.
- Strengthening its core business by expanding distribution, launching new products, strengthening retail execution and channel excellence, and improving sales force effectiveness.
- Achieving digital excellence by building a field marketing platform, loyalty platform and dashboards.
- Scaling up the business in switches and switchgear segments to achieve a higher margin
- Emphasizing on the FMEG business by expanding distribution, strengthening retail execution & channel excellence and improving sales force effectiveness.
Key Metrics of Polycab India
We are almost at the end of our Fundamental Analysis Of Polycab India. Let’s take a quick glance at the stock’s important metrics.
| Particular | Figures | Particular | Figures |
|---|---|---|---|
| CMP | ₹ 4,997 | Market Cap (Cr.) | ₹ 72,748 Cr |
| EPS | ₹ 96.8 | Stock P/E | 50.19 |
| RoCE (%) | 26.10% | RoE(%) | 21% |
| Promoters Holding | 66.0 % | Book Value | ₹ 443 |
| Debt to Equity | 0.01 | Price to Book Value | 10.4 |
| Net Profit Margin(%) | 12.59% | Operating Profit Margin(%) | 9.10% |
In Closing
We have reached the end of the fundamental analysis of Polycab India. Through this article, we can conclude that, with various factors like the company’s moat to maintain its margins, its strong market share of cables and wires in the organized market, and the plans the company has to increase its total sales, the stock has a good potential for growth in the future.
However, it is our duty as investors to keep track of the company’s earnings to see if it is increasing or maintaining its margins and also see if the company’s performance is better than its industry peers.
Written By Aaron Vas
By utilizing the stock screener, stock heatmap, portfolio backtesting, and stock compare tool on the Trade Brains portal, investors gain access to comprehensive tools that enable them to identify the best stocks also get updated with stock market news, and make well-informed investment decisions.

